This study presents an experimental paradigm for a usability test combining subjective and objective evaluations. The objective evaluation adopted Neuro-Information-Systems (NeuroIS) methods, and the subjective evaluation adopted a usability questionnaire and a NASA-Task Load Index (NASA-TLX) scale.
A subscription to JoVE is required to view this content. Sign in or start your free trial.
Method Article
Usability Evaluation of Augmented Reality: A Neuro-Information-Systems Study
* These authors contributed equally
In This Article
Summary
Abstract
This study introduces an experimental paradigm for a usability test of emerging technologies in a management information system (MIS). The usability test included both subjective and objective evaluations. For the subjective evaluation, a usability questionnaire and a NASA-TLX scale were adopted. For the objective evaluation, methods of Neuro-Information-Systems (NeuroIS) were used. From a NeuroIS perspective, this study used mobile fNIRS and eye tracking glasses for multimodal measurements, which solved the problem of ecological validity of cognitive neuroscience tools used in real-world behavior experiments. This study used Augmented Reality (AR) integrated into the Internet of Things (IoT) as an experimental object. Comparing the differences in the neuroimaging data, the physiological data, the usability questionnaire, and the NASA-TLX scale data between the two information-search modes (AR versus a website), information search with AR had a higher efficiency and a lower cognitive load compared with information search with a website during the process of consumption decision-making. The usability experiment results demonstrate that AR, as an emerging technology in retail, can effectively enhance consumer experiences and increase their purchase intention. The experimental paradigm, combining both subjective and objective evaluations in this study, could be applied to a usability test for emerging technologies, such as augmented reality, virtual reality, artificial intelligence, wearable technology, robotics, and big data. It provides a practical experimental solution for the user experience in human-computer-interactions with the adoption of emerging technologies.
Introduction
Six frontier technologies that interact with consumers, typically represented by augmented reality, virtual reality, artificial intelligence, wearable technology, robotics, and big data, are reshaping many theoretical models of consumer behavior1. Augmented Reality (AR) is a new technology that could enhance consumer experience and improve consumer satisfaction. It superimposes textual information, images, videos, and other virtual items onto real scenarios to fuse virtuality and reality, thus enhancing information in the real world through explanation, guidance, evaluation, and prediction2. AR provides a new kind of human-computer interaction, creating an immersive shopping experience for consumers, and has led to the development of many applications3,4. However, the consumer acceptance of AR services is still minimal, and many companies are thus cautious about adopting AR technology5,6. The technology acceptance model (TAM) has been widely used to explain and predict the adoption behavior of new information technologies7,8. According to the TAM, the adoption intention for a new technology largely depends on its usability9. Therefore, a possible explanation for the slow consumer acceptance of AR services from the TAM perspective may relate to the usability of the new techniques, which highlights the need to evaluate the usability of AR while shopping10,11.
Usability is defined as the effectiveness, efficiency, and satisfaction of achieving specified goals in a specified context by specified users12. Currently, there are two main methods for evaluating usability: subjective and objective evaluations13. Subjective evaluations rely mainly on self-report methods using questionnaires and scales. Following this line of research, the questionnaire used in this study included five features associated with the information search mode to achieve a goal: (1) efficiency, (2) ease of use, (3) memorability (easy to remember), (4) satisfaction (the information search mode is comfortable and pleasant), and (5) generalizability to other objects14,15,16. In addition, cognitive load, representing the load while performing a particular task on the cognitive system of a learner17, is another core indicator of usability18,19. Thus, this study additionally used the NASA Task Load Index (NASA-TLX)13,20 as a subjective metric to measure the cognitive load while shopping using AR versus shopping using website services. It is noteworthy that self-report methods rely on the ability and willingness of individuals to accurately report their attitudes and/or prior behaviors21, leaving open the possibility for mis-reporting, under-reporting, or bias. Thus, objective measures could be a valuable complement to traditional subjective methods22.
Neuro-Information-Systems (NeuroIS) methods are used for objective evaluation of AR usability. NeuroIS, coined by Dimoka et al. at the 2007 ICIS conference, is attracting increasing attention in the field of information systems (IS)23. NeuroIS uses theories and tools of cognitive neuroscience to better understand the development, adoption, and impact of IS technologies24,25. To date, cognitive neuroscience tools, such as functional magnetic resonance imaging (fMRI), electroencephalogram (EEG), positron emission computed tomography, magnetoencephalography (MEG), and functional near-infrared spectroscopy (fNIRS), are commonly used in NeuroIS studies26,27. For instance, Dimoka and Davis used fMRI to measure the subjects' activations when they interacted with the website, and revealed that perceived ease of use influenced activation in the prefrontal cortex (PFC)28. Similarly, using EEG, Moridis et al. found that frontal asymmetry was closely associated with usefulness29. These results indicate that the PFC may play a key role in usability.
Although achievements have been made in previous NeuroIS studies, the paradigms used in these studies had limited body movements of subjects with low ecological validity, limiting their theoretical and practical contributions. Interacting with technologies such as AR while shopping requires free body movements, and subject constraints largely impair consumer experience as discussed in He et al.22. Thus, brain-imaging tools with high ecological validity are needed for a usability test of information systems. In this regard, fNIRS has unique technical advantages: during fNIRS experiments, subjects can move freely30 to some extent. For instance, previous studies have measured subjects' brain activations during several outdoor activities such as cycling using portable fNIRS31. In addition, fNIRS is low-cost and enables the measurement of brain activations for long periods of time32. In this study, fNIRS was used to objectively measure subjects' level of cognitive load while using the shopping services of AR versus a website.
Eye tracking has been a valuable psychophysiological technique for detecting users' visual attention during a usability test in recent years33 and has also been widely used in NeuroIS studies34. The technique relies on the eye-mind hypothesis, which assumes that the observer's focus goes where the attention is directed, that visual attention represents the mental process, and that patterns of visual attention reflect human cognitive strategies35,36,37. In the area of AR research, Yang et al. used eye tracking to find that AR advertisement improved consumers' attitudes toward the advertisement by increasing their curiosity and attention38. In the current study, eye tracking was used to measure subjects' attention, including parameters such as total fixation duration, average fixation duration, fixation frequency, saccade frequency, average saccade duration, and average scan path length.
In summary, this study proposes a usability test method that combines subjective and objective evaluations with AR applications as an example. A usability questionnaire and a NASA-TLX scale were used for subjective evaluation, and multimodal measures combining fNIRS and eye tracking were used for objective evaluation39,40.
Experimental design
Experimental materials: To simulate a real-life shopping context, a product shelf was built in a laboratory, and two different brands of mineral water were placed on the shelf as experimental materials. As essential goods, mineral water was selected because participants would not have bias in subjective evaluations on the basis of their occupational background, gender, and purchasing ability. The price, capacity, and familiarity of the brands were controlled (see Table of Materials) to eliminate the interference of irrelevant variables.
The usability test included two conditions: a smartphone-based AR application (Supplemental Figure 1) and a website (Supplemental Figure 2). The AR application was programmed based on an AR engine. The website was developed using Python, based on Bootstrap for the front-end and Flask for the back-end. The AR application and website were run and browsed on a smartphone. Among the two different brands of mineral water, one was used as the experimental material in the AR condition, and the other was used in the website condition.
Experimental tasks: Participants were asked to perform four information search tasks that derived from IoT application contexts: the quality of water, the storage temperature, the matching diet, and the price per liter. These four information items are what consumers normally pay attention to when they buy mineral water. There was no time constraint for participants to complete the tasks.
Quality of water: The quality of mineral water commonly includes two indicators: the total dissolved solids (TDS) and the pH value. The TDS reflects the mineral content, and the pH value describes the acidity/alkalinity of the water. These two indicators are related to trace elements contained in the mineral water and influence taste. For instance, Bruvold and Ongerth divided the sensory quality of water into five grades according to its TDS content41. Marcussen et al. found that water has good sensory qualities in the range of 100-400 mg/L TDS42. The TDS and pH value of the two brands of mineral water used in this study were measured using TDS and pH meters, respectively, and then marked on the AR application and the website. While performing the task, participants were required to report the TDS and pH values of the mineral water and confirm whether these values were within the nominal range. In the AR condition, participants could acquire this information by scanning the bottle of water. In the website condition, participants were required to perform four steps: (1) finding a numeric code on the back of the bottle of mineral water, (2) entering the numeric code into a query box to obtain the TDS and pH values for mineral water, (3) searching the nominal range for mineral water on the website, and (4) verbally reporting whether TDS and pH value are within the nominal range for the product.
Storage temperature: The quality of mineral water may decrease during transportation and storage owing to changes in temperature. Experiments have shown that the appropriate temperature for mineral water is between 5 °C and 25 °C during transport and storage. In this temperature range, water does not have a bad odor43. In the present experiment, the storage temperature of the two types of mineral water in different places was marked on the AR application and the website. While performing the task, participants were required to report the storage location and corresponding temperature of the water. In the AR condition, participants could acquire this information by scanning the bottle of water. In the website condition, participants could acquire this information by entering the numeric code into a query box.
Matching diet: Different brands of mineral water are suitable for different menus due to their unique mineral composition and bubble content44. In the present experiment, dietary recommendations for the two mineral waters were marked on the AR application and website. While performing the task, participants were required to report how the mineral water matches the food in the menu. In the AR condition, participants could acquire this information by scanning the water bottle. In the website condition, participants could search for this information on the website.
Price per liter: Currently, the labels on the mineral water bottles in China do not display the price per liter information. This makes it difficult for consumers to distinguish the difference in unit prices of different types of mineral water. Therefore, the present experiment required participants to report the price per liter. In the AR application, participants could acquire the price per liter directly by scanning the bottle of water. In the website condition, the information could be calculated from the unit price and volume on the label.
This study used a within-participant design, with participant inclusion and exclusion criteria as described in Table 1. A total of 40 participants completed the experiment (20 males and 20 females, mean age = 21.31 ± 1.16 years). All participants were undergraduates of Jiangsu University of Science and Technology and were randomly arranged into two groups (A and B). In order to avoid the order effect, the experimental order was counterbalanced across the two groups (A/B). Specifically, one group performed the AR condition first and then the website condition, while the other group performed the website first and then the AR condition. The participants were required to complete preparation for the experiment, wear the instruments, and perform the experimental tasks. The inter-experiment interval was set to 10 s to allow cortical activation to return to the baseline level, avoiding cross-influence in the subsequent task. At the end of the AR/website experiment, participants were required to complete the usability questionnaire and the NASA-TLX scale. The experimental flowchart is shown in Figure 1. A photograph of the experimental setup is presented in Figure 2.
Table 1: Inclusion and exclusion criteria for the study. Please click here to download this Table.
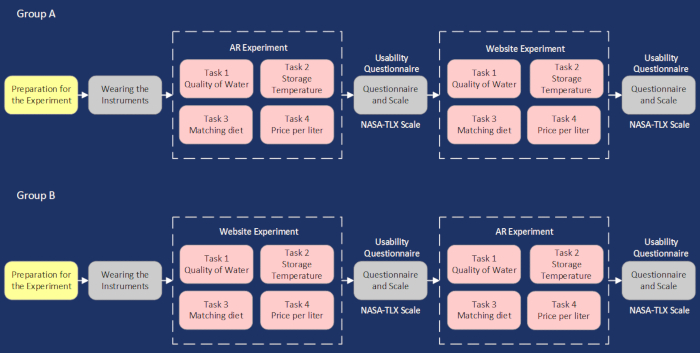
Figure 1: Experimental flowchart. Each experiment lasted ~45 min, with a rest period of 10 s between the tasks. Please click here to view a larger version of this figure.
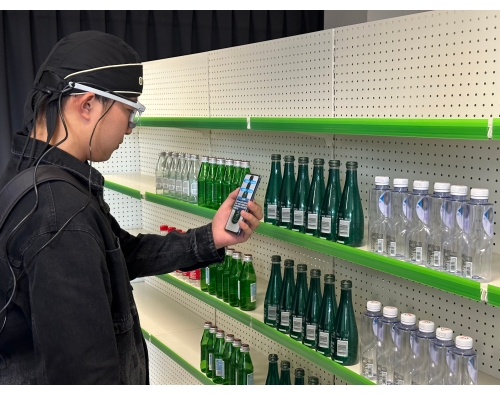
Figure 2: Example setup of the experimental scene. The experimental materials, the participant, and the equipment are shown. Please click here to view a larger version of this figure.
Access restricted. Please log in or start a trial to view this content.
Protocol
This study was conducted in accordance with the principles of the Helsinki Declaration. All participants were informed of the purpose and safety of the experiment and signed the informed consent form before participation. This study was approved by the institutional review board of Jiangsu University of Science and Technology.
1. Experiment procedure
- Preparation for the experiment
- Explain informed consent to the participants and ask them to sign the consent form.
- Perform a color vision test on the participants to confirm that they have normal color discrimination.
- Present 30 mineral water brands to participants and ask them to pick the brands that they are familiar with, to ensure that they are unfamiliar with the brands of mineral water used in the experiment.
- Introduce the procedure of the experiment to the participants.
- Conduct a pre-experiment on the participants using mineral water brands other than the ones used in the study, and ensure that they are familiar with the AR and website operations.
- Direct each participant from Group A to perform the AR experiment first, and then to perform the website experiment. Direct each participant from Group B to perform the website experiment first, and then to perform the AR experiment.
- Wearing instruments
- fNIRS probes
- Clean the forehead skin of the participants with skin preparation gel (see Table of Materials).
- Wrap the probes (see Table of Materials) in a plastic wrap for sweaty circumstances. Fix the probes on the FP1 and FP2 position according to the international 10-20 system with a black headband45. Use a black bandana to cover the probes to protect them against ambient light and improve signal quality.
- Clean the transmitter and receiver of the probes using a 70% isopropyl alcohol pad after finishing the experiment.
- Eye tracker: Capture eye movement in real-world environments using eye tracking glasses (see Table of Materials). Fit prescription lenses on the head unit of the eye tracking glasses magnetically (if required) and ensure that the participants can walk around freely with a corrected sight.
NOTE: Because the eye tracking glasses are not designed to work in conjunction with standard eye glasses, participants who wear eye glasses may still be included in the study by using optional prescription lenses for correction of either short-sightedness or long-sightedness. Participants can also wear standard contact lenses because although they may slightly increase noise, they do not normally introduce errors in the data. Participants cannot use colored or other lenses that change the appearance of the pupil or iris.
- fNIRS probes
2. Measures
- fNIRS
- Open the recording software (see Table of Materials). Connect the probes to a laptop via a Bluetooth adapter, and then record the changes of concentration of oxygenated hemoglobin (O2Hb) in the participants' prefrontal cortex through the laptop, with a sampling frequency of 10 Hz.
- Check the received light intensity and tissue saturation index (TSI) quality to control data quality. Ensure that the received signal is located between 1% and 95%.
- Ensure that the participants sit in a comfortable position on a chair and maintain the resting state for 2 min to collect baseline data before the real experiment.
- Click on the Start button on the software interface to record the fNIRS data.
- Eye tracking
- Set up the hardware for the eye tracking glasses. Connect the USB plug of the eye tracking glasses to a USB port on the laptop. Open the recording software (see Table of Materials) and set the sampling frequency to 120 Hz.
- Calibration: Perform a one-point-calibration. Ask the participant to focus on a clearly identifiable object in their field of view at 0.6 m. Move the crosshair cursor to the object, where the participant is focused on in the scene video and click on the object.
- Press the Record button on the software interface to start recording.
- Questionnaire and scale: Present the usability questionnaire and NASA-TLX scale to the participants after they complete the tasks of the AR/website.
3. Data analysis
- fNIRS data processing
- Convert the optical density values obtained from the fNIRS recording software into concentrations (μmol) according to the modified Beer-Lambert Law46.
- Filter the raw data at low-pass 0.5 Hz to remove systematic noises such as heartbeats and respiration.
- Check and correct the data for motion artifacts by removing the data segments that exceeded three standard deviations above the entire time-series47.
- Export the mean and maximum fNIRS data in the AR and website conditions, and then subtract them from the baseline data.
- Eye tracking data processing
- Export the fixation frequency (count/s), total fixation time (ms), average fixation time (ms), saccade frequency (count/s), average saccade time (ms), and average scan path length (px/s) of the participants.
- Statistical analysis
- Perform a two-tailed test at a significance level of 0.05. Check the data normality using the Shapiro-Wilk test and perform a difference test. Perform multiple comparison corrections for p-values using the false discovery rate (FDR) method.
NOTE: While performing the difference test, the data that followed a normal distribution were analyzed using a paired samples t-test, and the data that did not follow a normal distribution were analyzed using Wilcoxon signed rank test.
- Perform a two-tailed test at a significance level of 0.05. Check the data normality using the Shapiro-Wilk test and perform a difference test. Perform multiple comparison corrections for p-values using the false discovery rate (FDR) method.
Access restricted. Please log in or start a trial to view this content.
Results
The representative results of this study include the usability questionnaire results, eye tracking data analysis, NASA-TLX scale data, fNIRS data analysis, and dynamic cognitive load changes. For the usability questionnaire results, eye tracking data analysis, NASA-TLX scale data and fNIRS data analysis, normality tests, and differences tests were conducted. For dynamic cognitive load changes, this study selected fNIRS and eye tracking data from a single participant to demonstrate the validity of the multimodal measureme...
Access restricted. Please log in or start a trial to view this content.
Discussion
Critical steps within the protocol
During the experiment, several steps were considered to ensure reliability of the results. First, participants who are familiar with the brands of mineral water used in the experiment were excluded, because these participants would have performed the task based on their knowledge of the brand. Second, the participants completed a pre-experiment using other brands of mineral water, which was employed to ensure that the participants were familiar with AR and website...
Access restricted. Please log in or start a trial to view this content.
Disclosures
The authors have nothing to disclose.
Acknowledgements
This study was supported by the Philosophy and Social Science Research Project of Jiangsu Provincial Department of Education (2018SJA1089), Jiangsu Government Scholarship for Overseas Studies (JS-2018-262), the Natural Science Foundation of Zhejiang Province (LY19G020018) and the National Natural Science Foundation of China (NSFC) (72001096).
Access restricted. Please log in or start a trial to view this content.
Materials
| Name | Company | Catalog Number | Comments |
|---|---|---|---|
| AR Engine | Unity Technologies | 2020.3.1 | AR development platform |
| AR SDK | PTC | Vuforia Engine 9.8.5 | AR development kit |
| Eye Tracker (eye tracking glasses) | SMI, Germany | SMI ETG | Head-mounted eye tracking system |
| Eye Tracker Recording software | SMI, Germany | iViewETG Software | Eye Tracker Recording software |
| fNIRS probes | Artinis Medical Systems BV, Netherlands | Artinis PortaLite | Light source: Light emitting diodes Wavelengths: Standard nominal 760 and 850 nm |
| fNIRS software | Artinis Medical Systems BV, Netherlands | OxySoft 3.2.70 | fNIRS data recording and analysis software |
| Mineral Water | Groupe Danone | Badoit | Experimental material in the AR condition Capacity: 330ml Price:  6 6 |
| Mineral Water | Nestlé | Acqua Panna | Experimental material in the website condition Capacity: 250ml Price: 5.4 |
| Skin Preparation Gel | Weaver and Company | Nuprep | Clean the forehead skin of the participants |
| Smartphone | Xiaomi | Redmi K30 Ultra | Smartphone-based AR application and website |
References
- Ameen, N., Hosany, S., Tarhini, A. Consumer interaction with cutting-edge technologies: Implications for future research. Computers in Human Behavior. 120, 106761(2021).
- Javornik, A. Augmented reality: Research agenda for studying the impact of its media characteristics on consumer behaviour. Journal of Retailing and Consumer Services. 30, 252-261 (2016).
- Caboni, F., Hagberg, J. Augmented reality in retailing: a review of features, applications and value. International Journal of Retail & Distribution Management. 47 (11), 1125-1140 (2019).
- Kumar, H. Augmented reality in online retailing: a systematic review and research agenda. International Journal of Retail & Distribution Management. 50 (4), 537-559 (2022).
- Yim, M. Y. C., Park, S. Y. I am not satisfied with my body, so I like augmented reality (AR): Consumer responses to AR-based product presentations. Journal of Business Research. 100, 581-589 (2019).
- Chylinski, M., et al. Augmented reality marketing: A technology-enabled approach to situated customer experience. Australasian Marketing Journal. 28 (4), 374-384 (2020).
- Davis, F. D. A Technology Acceptance Model for Empirically Testing New End-User Information Systems: Theory and Results. , Massachusetts Institute of Technology. Doctoral dissertation (1985).
- Venkatesh, V., Morris, M. G., Davis, G. B., Davis, F. D. User acceptance of information technology: Toward a unified view. MIS Quarterly. 27 (3), 425-478 (2003).
- Davis, F. D. Perceived usefulness, perceived ease of use, and user acceptance of information technology. MIS Quarterly. 13 (3), 319-340 (1989).
- Chen, R., Perry, P., Boardman, R., McCormick, H. Augmented reality in retail: a systematic review of research foci and future research agenda. International Journal of Retail & Distribution Management. 50 (4), 498-518 (2022).
- Poushneh, A., Vasquez-Parraga, A. Z. Discernible impact of augmented reality on retail customer's experience, satisfaction and willingness to buy. Journal of Retailing and Consumer Services. 34, 229-234 (2017).
- ISO. ISO 1998. Ergonomic requirements for office work with visual display terminals (VDTs)-Part 11: guidance on usability. ISO. , (2022).
- Hornbæk, K. Current practice in measuring usability: Challenges to usability studies and research. International Journal of Human-Computer Studies. 64 (2), 79-102 (2006).
- Tullis, T., Albert, B. Measuring the User Experience: Collecting, Analyzing, and Presenting Usability Metrics. , Morgan Kaufmann. Amsterdam, Boston. (2008).
- Shneiderman, B., Plaisant, C., Cohen, M., Jacobs, S. M., Elmqvist, N. Designing the User Interface: Strategies for Effective Human-Computer Interaction. , Pearson. Boston. (2017).
- Morillo, P., Orduña, J. M., Casas, S., Fernández, M. A comparison study of AR applications versus pseudo-holographic systems as virtual exhibitors for luxury watch retail stores. Multimedia Systems. 25 (4), 307-321 (2019).
- Paas, F. G., Van Merriënboer, J. J. Instructional control of cognitive load in the training of complex cognitive tasks. Educational Psychology Review. 6 (4), 351-371 (1994).
- Ismail, R., Fabil, N., Saleh, A. Extension of pacmad model for usability evaluation metrics using goal question metrics (Gqm) approach. Journal of Theoretical and Applied Information Technology. 79 (1), 90-100 (2015).
- Fan, X., Chai, Z., Deng, N., Dong, X. Adoption of augmented reality in online retailing and consumers' product attitude: A cognitive perspective. Journal of Retailing and Consumer Services. 53, 101986(2020).
- Hart, S. G., Staveland, L. E. Development of NASA-TLX (Task Load Index): Results of empirical and theoretical research. Advances in Psychology. 52, 139-183 (1988).
- Petty, R. E., Cacioppo, J. T., Schumann, D. Central and peripheral routes to advertising effectiveness: The moderating role of involvement. Journal of Consumer Research. 10 (2), 135-146 (1983).
- He, L., Pelowski, M., Yu, W., Liu, T. Neural resonance in consumers' right inferior frontal gyrus predicts attitudes toward advertising. Psychology & Marketing. 38 (9), 1538-1549 (2021).
- Riedl, R., Fischer, T., Léger, P. M., Davis, F. D. A decade of NeuroIS research: Progress, challenges, and future directions. ACM SIGMIS Database: the DATA BASE for Advances in Information Systems. 51 (3), 13-54 (2020).
- Vom Brocke, J., Liang, T. P. Guidelines for Neuroscience Studies in Information Systems Research. Journal of Management Information Systems. 30 (4), 211-234 (2014).
- Dimoka, A., Pavlou, P. A., Davis, F. NeuroIS: The potential of cognitive neuroscience for information systems research. Information Systems Research. 22 (4), 687-702 (2011).
- de Guinea, A. O., Titah, R., Léger, P. M. Explicit and implicit antecedents of users' behavioral beliefs in information systems: A neuropsychological investigation. Journal of Management Information Systems. 30 (4), 179-210 (2014).
- Dimoka, A. How to conduct a Functional Magnetic Resonance (fmri) study in social science research. MIS Quarterly. 36 (3), 811-840 (2012).
- Dimoka, A., Davis, F. D. Where does TAM reside in the brain? The neural mechanisms underlying technology adoption. ICIS 2008 Proceedings. , 1-19 (2008).
- Moridis, C. N., Terzis, V., Economides, A. A., Karlovasitou, A., Karabatakis, V. E. Using EEG frontal asymmetry to predict IT user's perceptions regarding usefulness, ease of use and playfulness. Applied Psychophysiology and Biofeedback. 43 (1), 1-11 (2018).
- Pinti, P., et al. A review on the use of wearable functional near-infrared spectroscopy in naturalistic environments. Japanese Psychological Research. 60 (4), 347-373 (2018).
- Piper, S. K., et al. A wearable multi-channel fNIRS system for brain imaging in freely moving subjects. Neuroimage. 85, 64-71 (2014).
- Quaresima, V., Ferrari, M. Functional Near-Infrared Spectroscopy (fNIRS) for assessing cerebral cortex function during human behavior in natural/social situations: A concise review. Organizational Research Methods. 22 (1), 46-68 (2019).
- Wang, J., et al. Exploring relationships between eye tracking and traditional usability testing data. International Journal of Human-Computer Interaction. 35 (6), 483-494 (2019).
- Dimoka, A., et al. On the use of neurophysiological tools in IS research: Developing a research agenda for NeuroIS. MIS Quarterly. 36, 679-702 (2012).
- Just, M. A., Carpenter, P. A. Eye fixations and cognitive processes. Cognitive Psychology. 8 (4), 441-480 (1976).
- Alex, P., Ball, L. J. Eye Tracking in Human-Computer Interaction and Usability Research: Current Status and Future. Encyclopedia of Human Computer Interaction, IGI Global. , 211-219 (2006).
- Just, M. A., Carpenter, P. A. A theory of reading: from eye fixations to comprehension. Psychological Review. 87 (4), 329(1980).
- Yang, S., Carlson, J. R., Chen, S. How augmented reality affects advertising effectiveness: The mediating effects of curiosity and attention toward the ad. Journal of Retailing and Consumer Services. 54, 102020(2020).
- Debie, E., et al. Multimodal fusion for objective assessment of cognitive workload: A review. IEEE Transactions on Cybernetics. 51 (3), 1542-1555 (2021).
- Işbilir, E., Çakır, M. P., Acartürk, C., Tekerek, A. Ş Towards a multimodal model of cognitive workload through synchronous optical brain imaging and eye tracking measures. Frontiers in Human Neuroscience. 13, 375(2019).
- Bruvold, W. H., Ongerth, H. J. Taste quality of mineralized water. Journal-American Water Works Association. 61 (4), 170-174 (1969).
- Marcussen, H., Holm, P. E., Hansen, H. Chr.B. Composition, flavor, chemical food safety, and consumer preferences of bottled water. Comprehensive Reviews in Food Science and Food Safety. 12 (4), 333-352 (2013).
- Whelton, A. J., Dietrich, A. M. Relationship between intensity, concentration, and temperature for drinking water odorants. Water Research. 38 (6), 1604-1614 (2004).
- (LIFESTYLE) What your choice of water says about you. FT live. , Available from: https://m.ftchinese.com/story/001006284/en?archive (2006).
- Pellegrini-Laplagne, M., et al. Effect of simultaneous exercise and cognitive training on executive functions, baroreflex sensitivity, and pre-frontal cortex oxygenation in healthy older adults: a pilot study. GeroScience. , (2022).
- Delpy, D. T., et al. Estimation of optical pathlength through tissue from direct time of flight measurement. Physics in Medicine & Biology. 33 (12), 1433-1442 (1988).
- Han, W., Gao, L., Wu, J., Pelowski, M., Liu, T. Assessing the brain 'on the line': An ecologically-valid assessment of the impact of repetitive assembly line work on hemodynamic response and fine motor control using fNIRS. Brain and Cognition. 136, 103613(2019).
- Spiers, H. J., Maguire, E. A. Decoding human brain activity during real-world experiences. Trends in Cognitive Sciences. 11 (8), 356-365 (2007).
- Spence, C. Neuroscience-Inspired Design: From Academic Neuromarketing to Commercially Relevant Research. Organizational Research Methods. 22 (1), 275-298 (2019).
- Grasso-Cladera, A., Costa-Cordella, S., Rossi, A., Fuchs, N. F., Parada, F. J. Mobile brain/body imaging: Challenges and opportunities for the implementation of research programs based on the 4E perspective to cognition. Adaptive Behavior. 0 (0), 1-26 (2022).
- Krampe, C., Strelow, E., Haas, A., Kenning, P. The application of mobile fNIRS to "shopper neuroscience" - first insights from a merchandising communication study. European Journal of Marketing. 52, 244-259 (2018).
- Meade, A. W., Watson, A. M., Kroustalis, C. M. Assessing common methods bias in organizational research. 22nd annual meeting of the society for industrial and organizational psychology. , New York. 1-10 (2007).
- Liang, T. P., Lin, Y. L., Shiau, W. L., Chen, S. F. Investigating common method bias via an EEG study of the flow experience in website design. Journal of Electronic Commerce Research. 22 (4), 305-321 (2021).
- Kim, Y. M., Rhiu, I., Yun, M. H. A systematic review of a virtual reality system from the perspective of user experience. International Journal of Human-Computer Interaction. 36 (10), 893-910 (2020).
Access restricted. Please log in or start a trial to view this content.
Reprints and Permissions
