The experimental protocol demonstrates the paradigm for acquiring and analyzing electroencephalography (EEG) signals during upper limb movement in individuals with stroke. The alteration of the functional network of low-beta EEG frequency bands was observed during the movement of the impaired upper limb and was associated with the degree of motor impairment.
A subscription to JoVE is required to view this content. Sign in or start your free trial.
Method Article
Electroencephalography Network Indices as Biomarkers of Upper Limb Impairment in Chronic Stroke
* These authors contributed equally
In This Article
Summary
Abstract
Alteration of electroencephalography (EEG) signals during task-specific movement of the impaired limb has been reported as a potential biomarker for the severity of motor impairment and for the prediction of motor recovery in individuals with stroke. When implementing EEG experiments, detailed paradigms and well-organized experiment protocols are required to obtain robust and interpretable results. In this protocol, we illustrate a task-specific paradigm with upper limb movement and methods and techniques needed for the acquisition and analysis of EEG data. The paradigm consists of 1 min of rest followed by 10 trials comprising alternating 5 s and 3 s of resting and task (hand extension)-states, respectively, over 4 sessions. EEG signals were acquired using 32 Ag/AgCl scalp electrodes at a sampling rate of 1,000 Hz. Event-related spectral perturbation analysis associated with limb movement and functional network analyses at the global level in the low-beta (12-20 Hz) frequency band were performed. Representative results showed an alteration of the functional network of low-beta EEG frequency bands during movement of the impaired upper limb, and the altered functional network was associated with the degree of motor impairment in chronic stroke patients. The results demonstrate the feasibility of the experimental paradigm in EEG measurements during upper limb movement in individuals with stroke. Further research using this paradigm is needed to determine the potential value of EEG signals as biomarkers of motor impairment and recovery.
Introduction
Upper limb motor impairment is one of the most common consequences of stroke and is related to limitations in activities of daily living1,2. Alpha (8-13 Hz) and beta (13-30 Hz) band rhythms are known to be closely associated with movements. In particular, studies have shown that altered neural activity in the alpha and lower beta (12-20 Hz) frequency bands during movement of an impaired limb is correlated with the degree of motor impairment in individuals with stroke3,4,5. Based on these findings, electroencephalography (EEG) has emerged as a potential biomarker that reflects both severity of motor impairment and possibility of motor recovery6,7. However, previously developed EEG-based biomarkers have proved inadequate for investigating the characteristics of motor impairment in individuals with stroke, largely due to their reliance on resting-state EEG data rather than task-induced EEG data8,9,10. Complex information processing related to motor impairments, such as the interaction between ipsilesional and contralesional hemispheres, can be revealed only through task-induced EEG data, not resting-state EEG. Therefore, further studies are not only required to explore the relationship between neuronal activities and motor impairment characteristics and to clarify the usefulness of EEG generated during movement of the impaired body part as a potential biomarker for motor impairment in individuals with stroke11.
Implementing EEG for assessing behavioral effects requires task-specific paradigms and protocols. To date, various EEG protocols have been suggested12, where individuals with stroke performed imagined or actual movements to induce movement-related brain activities11,13. In the case of imagined movements, about 53.7% of participants could not definitely imagine a corresponding movement (called "illiteracy") and thus failed to induce movement-related brain activities14. Moreover, it is difficult for individuals with severe stroke to move the entire upper extremity, and there is a possibility of unnecessary artifacts during data acquisition due to unstable movements. Therefore, guidance based on expert know-how is required to acquire task-related high-quality EEG data and neurophysiologically interpretable results. In this study, we comprehensively designed an experimental paradigm for individuals with stroke to perform a relatively simple hand movement task and provided an experimental procedure with detailed guidance.
By outlining the visualized experimental protocol in this article, we aimed to illustrate the specific concepts and methods used for the acquisition and analysis of neuronal activities related to the movement of the upper limb using an EEG system. In demonstrating the difference in neuronal activities via EEG between the paretic and nonparetic upper limbs in participants with hemiplegic stroke, this study aimed to present the feasibility of EEG using the described protocol as a potential biomarker for the severity of motor impairment in individuals with stroke in a cross-sectional context.
Access restricted. Please log in or start a trial to view this content.
Protocol
All experimental procedures were reviewed and approved by the Institutional Review Board of Seoul National University Bundang Hospital. For the experiments in this study, 34 participants with stroke were recruited. Signed informed consent was obtained from all participants. A signed informed consent was obtained from a legal representative if a participant met the criteria but could not sign the consent form because of disability.
1. Experimental setup
- Patient recruitment
- Perform the screening process using the following inclusion criteria:
Aged 18 to 85 years with the presence of impaired upper limb functions;
First-ever ischemic or hemorrhagic stroke confirmed by brain computed tomography or magnetic resonance imaging;
Participant's ability to follow the instructions for clinical assessment and the EEG study;
Absence of a history of any other psychiatric or neurological diseases except stroke. - Exclude patients based on the following:
Previous disease involving the central nervous system (e.g., traumatic brain injury, brain tumor, Parkinson's disease);
Inability to wear the EEG cap; and
Inability to follow the instructions for the clinical assessment and the EEG study.
NOTE: The inclusion and exclusion criteria were chosen to select the participants capable of participating in the experiment and to regulate the demographic factors that could influence the results. - Provide all recruited participants with information about the details of the experimental procedure.
- Perform the screening process using the following inclusion criteria:
- Experimental system: EEG
- Use an EEG system consisting of 32 Ag/AgCl scalp electrodes, a textile EEG cap, and EEG recording software for data recording.
- Use a personal computer (PC) with EEG recording software installed and connect the PC to the EEG device via Bluetooth.
- Use another PC with a numerical analysis and programming software application for engineering (see Table of Materials).
- For stimuli presentation, connect the PC to a dedicated trigger box (Figure 1).
NOTE: The detailed specifications of the two PCs are provided in Table of Materials.
- Experimental paradigm based on programming software
NOTE: The participants performed a hand extension task using the affected and unaffected hands, during which EEG data were measured. Figure 2 shows the experimental paradigm of this study.- Present two visual stimuli, CLOSE and OPEN, for 30 s each, on the center of a monitor to measure baseline resting-state EEG data, during which the participant closes and opens the eyes.
NOTE: Because resting-state EEG data are relatively less contaminated by unwanted physiological artifacts, they are useful for verifying the quality of EEG data and identifying individual EEG characteristics with respect to the resting state. - Present a hand motion image for 3 s to instruct the participant to make a hand extension movement, followed by a fixation mark for 5 s for resting.
NOTE: This procedure was regarded as a trial and was repeated 10 times in a single session. Each participant underwent 4 sessions for each hand. The participant had a break whenever he/she wanted after performing each session to prevent excessive fatigue.
- Present two visual stimuli, CLOSE and OPEN, for 30 s each, on the center of a monitor to measure baseline resting-state EEG data, during which the participant closes and opens the eyes.

Figure 1: Schematic of the equipment setup. A PC (PC1) presenting experimental stimuli was connected to a trigger box, and another PC (PC2) was connected to an EEG amplifier. Stimulation events generated in PC1 were delivered to the EEG amplifier via the trigger box connected to PC1. Please click here to view a larger version of this figure.
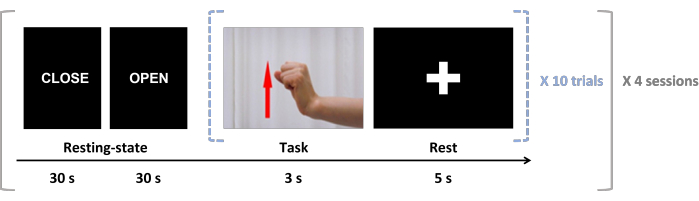
Figure 2: Experimental paradigm used in this study. A single trial consisted of a hand extension movement of 3 s followed by a relaxation of 5 s. This pattern was repeated 10 times in a single session. A total of eight sessions were performed; four sessions involved affected hand movement, while the other four involved unaffected hand movement.This figure was adapted from Shim et al.17 with permission from Mary Ann Liebert, Inc. Please click here to view a larger version of this figure.
2. Recording movement-related EEG data
- EEG setup
- Seat the participant in a comfortable armchair in front of a monitor.
NOTE: The distance between the participant and the monitor should be at least 60 cm to prevent eye fatigue. However, an excessive distance should be avoided (e.g., >150 cm) because it could distract the participant's concentration. - To accurately wear the cap for EEG measurement, define the Cz location based on the international 10-20 system using the intersection of the longitudinal line connecting the nasion and inion and the transverse line connecting the upper part of both auricles.
NOTE: An EEG cap may not be required depending on the EEG measurement equipment. In such case, EEG electrodes are directly attached to the scalp according to the international 10-20 system15. - For an accurate EEG measurement, use an appropriately sized EEG cap according to the head size of the participant and place it so that the Cz electrode position is placed on the individual Cz location.
- Fix the chin strap with appropriate tightness; this will prevent the participant from being uncomfortable during swallowing and blinking in the experiment. After that, confirm that the T9 and T10 electrode positions of the EEG cap are in the temporal region above both auricles, and the Fpz electrode position of the EEG cap is located in the middle of the forehead.
NOTE: If those electrodes are out of the designated location, consider changing the cap. Three EEG cap sizes were used in our study (54 cm: small, 56 cm: medium, 58 cm: large). - After correctly placing the EEG cap, attach 32 Ag/AgCl scalp electrodes on the scalp according to the extended international 10-10 system, with the ground and reference electrodes at Fpz and FCz, respectively16.
NOTE: The location of the reference electrode (FCz) is relatively less influenced by various physiological artifacts, such as those from electrooculography, electromyography, and electrocardiography, because it is located around the central area (Cz) of the scalp. - Adjust the impedance level between the EEG electrodes and the scalp using conductive gel, and fix the hair with the gel to prevent any obstruction between the EEG electrodes and the scalp.
NOTE: It is important to confirm whether any bridge between adjacent EEG electrodes is created due to gel leakage. - Use the software for EEG recording.
- Turn on the EEG system and execute Configuration > Select Amplifier. Choose Liveamp > > amplifier > connect. Search for Liveamp function for the wireless connection (Figure 3).
- Execute the Impedance check function to monitor the impedance level for each electrode.
NOTE: Conducting the experiment with an impedance level of <20 KΩ is recommended (Figure 4). - Execute the monitoring function to confirm whether the EEGs of all electrodes have similar amplitude levels through real-time EEG signal monitoring (Figure 5).
NOTE: The amplitude of the EEG signal is generally between 10 µV and 100 µV, and the alpha (8-12 Hz) power increases around the occipital area when the eyes are closed. Therefore, the quality of EEG data can be qualitatively confirmed by monitoring the amplitude level and alpha oscillations on the channels around the occipital area while the eyes are closed.
- Seat the participant in a comfortable armchair in front of a monitor.
- Paradigm setup
- For stable EEG data acquisition, use two separate PCs for presenting external stimuli and recording EEG data (see Figure 1).
- To present experimental stimuli to the participants, create a stimulation program based on the experimental paradigm using programming software (introduced in step 1.3).
NOTE: A software-based stimulation program was created in this study, but other software can be used depending on their compatibility with the EEG equipment used for the experiment as well as user convenience. The programming software-based stimulus script is provided in Supplementary File 1 (Experimental_stimulus.m). The event information, indicating the onset point of stimuli, is generated by the in-house programming software, transmitted to the EEG amplifier via the trigger box, and ultimately to the EEG recording software (Figure 1). - Execute the program presenting the experimental stimuli in monitoring mode (refer to sub step 2.1.10). Subsequently, confirm that the event information is correctly marked in a timely manner at the bottom of the EEG recording software each time a stimulus is presented, as shown in Figure 6.
NOTE: Information on the time point is recorded whenever a new stimulus is presented and is subsequently used for data segmentation. Therefore, it is important to obtain the exact time points of experimental events as much as possible to prevent inaccurate data segmentation, which would lead to unreliable results in the analysis. - Initiate the EEG recording software, then independently run the stimulus presentation program developed based on the experimental paradigm using programming software to prevent the data omission.
NOTE: For convenience of data analysis, creating file names with a consistent rule for data storage (e.g., Sub1_Session1) is recommended.
- EEG recording
- Measure EEG at a sampling rate of 1,000 Hz following the experimental paradigm introduced in step 1.3.
NOTE: The sampling rate can be changed depending on the range of EEG frequencies the researcher wants to investigate. It is generally recommended to use a sampling rate of >200 Hz where EEG information can be investigated at ≤100 Hz based on the Nyquist theorem. This is because most EEG information exists below 100 Hz. - Maintain the same experimental environments (e.g., experimental place, equipment, room temperature, etc.) as much as possible between the participants and instruct them to minimize unnecessary movements during the EEG measurement.
- Measure EEG at a sampling rate of 1,000 Hz following the experimental paradigm introduced in step 1.3.

Figure 3: Wireless connection procedure between an EEG amplifier and PC with the EEG recording software. Follow the steps in order: (A) select amplifier, (B) connect amplifier, (C) search for the connected amplifier for wireless connection, (D) connection complete. Please click here to view a larger version of this figure.

Figure 4: Impedance check procedure for each channel. All channels should be adjusted to green color for stable EEG measurement. It is recommended to conduct the experiment with an impedance of less than 20 KΩ. Please click here to view a larger version of this figure.
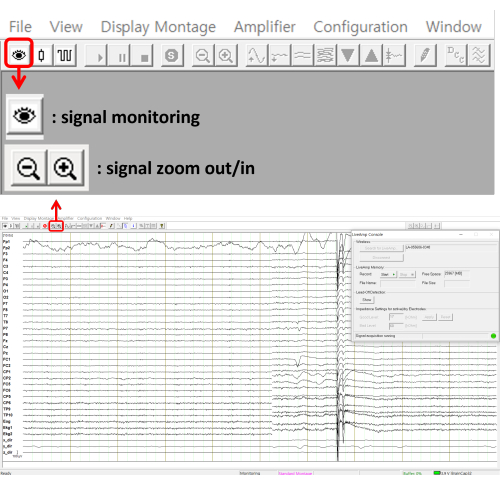
Figure 5: Real-time data monitoring procedure for each channel. Signals from all channels being measured can be monitored in real-time and can be zoomed in/out using the option (red box) on the top bar. Please click here to view a larger version of this figure.
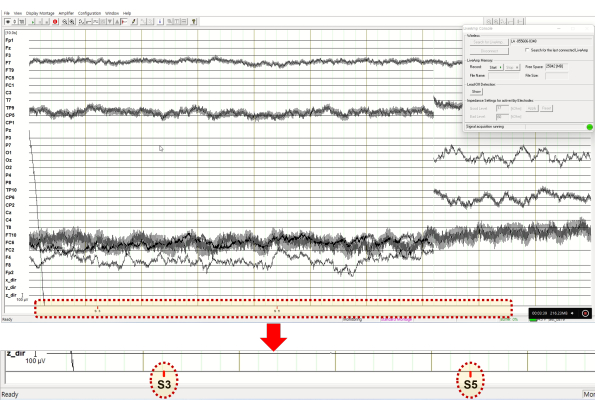
Figure 6: Screenshot for monitoring event information. The red bars indicate event makers that are presented each time a stimulus is provided by PC1. Please click here to view a larger version of this figure.
3. EEG data analysis
NOTE: This study provides precise guidelines for replicating the research concept. Therefore, it provides a brief outline of the analysis process and representative results. The detailed processes and the associated results can be found in a previous study17. This serves as an indication that Mary Ann Liebert, Inc. has granted permission for the use of copyrighted material.
- Preprocessing
- Remove eye-related artifacts from the raw EEG data using mathematical procedures based on principal component analysis implemented in EEG data preprocessing software18,19 (see Table of Materials).
NOTE: If any epoch displayed prominent artifacts (± 100 µV), even after preprocessing in any of the electrodes, it was excluded from further analysis. The average number of rejected epochs, including their standard deviation, was 3.69 ± 7.15 for the affected hand-movement task and 1.62 ± 3.95 for the unaffected hand-movement task. - Apply a bandpass filter between 0.1 Hz and 55 Hz. Segment the preprocessed EEG data from -1 s to 3.5 s for each trial based on the task onset to contain the baseline period used for event-related spectral perturbation (ERSP) and functional network analyses.
- Remove eye-related artifacts from the raw EEG data using mathematical procedures based on principal component analysis implemented in EEG data preprocessing software18,19 (see Table of Materials).
- ERSP analysis
NOTE: The measured EEG data were validated via ERSP analysis for a low-beta frequency band (12-20 Hz) associated with voluntary movements.- Conduct a short-time Fourier transform for each trial to calculate EEG spectral powers, for which the newtimef function of the EEGLAB toolbox in the programming software was used20 (a non-overlapping Hanning window, 250 ms window size).
- Normalize the power spectrum of each trial by subtracting the average power of the baseline period (-1 to 0 s) to investigate the changes in spectral powers between the hand movement task and the baseline period.
- Estimate baseline-normalized ERSP maps for each patient by averaging the normalized power spectra across trials.
- Functional network analysis
NOTE: A functional network analysis was conducted to investigate EEG changes from a brain network perspective. To compute weighted whole-brain network indices based on graph theory, brain connectivity between different regions was computed first using the phase locking value (PLV). A functional connectivity matrix was then computed using the results of the PLV-based connectivity analysis, which was subsequently used to compute whole-brain network indices17. All functional network analyses were performed using the programming software.- Calculate the Hilbert transform-based phase locking value (PLV) for a low-beta frequency band (12-20 Hz) using an in-house function21,22. The in-house function for computing the Hilbert Transform-based PLV is provided in Supplementary File 2 (myPLV.m).
- Assess the PLVs between all possible pairs of the 32 EEG electrodes at each time point during the task periods (0-3.5 s) and create a symmetric adjacency matrix (32 x 32, number of electrodes = 32) by averaging the PLVs over the task period. Use the PLV matrix as input data for network analysis17,23.
- Evaluate four weighted global-level network indices based on graph theory using the Brain Connectivity Toolbox (https://sites.google.com/site/bctnet): (1) strength, (2) clustering coefficient, (3) path length, and (4) small-worldness17,24,25.
Access restricted. Please log in or start a trial to view this content.
Results
Figure 7 presents the topographical low-beta ERD maps of each hand-movement task. A significantly strong low-beta ERD was observed in the contralesional hemisphere compared with the ipsilesional hemisphere for both the affected and unaffected hand-movement tasks.
Access restricted. Please log in or start a trial to view this content.
Discussion
This study has introduced an EEG experiment for measuring upper limb movement-related neuronal activities in individuals with stroke. The experimental paradigm and methods of acquisition and analysis of EEG were applied to determine the ERD patterns in the ipsilesional and contralesional motor cortex.
The results of the ERSP maps (Figure 7) demonstrated the difference in the degree of neuronal activation when moving the impaired and unaffected hands. The results ...
Access restricted. Please log in or start a trial to view this content.
Disclosures
MS, NJP, WSK, and HJH have a patent-pending entitled "Method for providing information related to motor impairment and devices used therefor", Number 10-2022-0007841.
Acknowledgements
This work was supported by the National Research Foundation of Korea (NRF) grant funded by the Korea government (MSIT) (No. NRF-2022R1A2C1006046), by the Original Technology Research Program for Brain Science through the National Research Foundation of Korea (NRF) funded by the Ministry of Education, Science and Technology (2019M3C7A1031995), by National Research Foundation of Korea (NRF) grant funded by the Korea government (MSIT) (No. NRF-2022R1A6A3A13053491), and by the MSIT(Ministry of Science and ICT), Korea, under the ITRC (Information Technology Research Center) support program (IITP-2023-RS-2023-00258971) supervised by the IITP (Institute for Information & Communications Technology Planning & Evaluation).
Access restricted. Please log in or start a trial to view this content.
Materials
| Name | Company | Catalog Number | Comments |
|---|---|---|---|
| actiCAP | Easycap, GmbH Ltd., Herrsching, Germany | CAC-32-SAMW-56 | Textile EEG cap platform to accommodate EEG electrodes |
| Brain Vision Recorder (Software) | Brain Products GmBH Ltd., Munich, Germany | - | Software used to record EEG signal |
| Curry 7 (Software) | Compumedics, Australia | - | Software used in preprocessing of EEG data |
| MATLAB R2019a (Software) | MathWorks Inc., Natick, MA, USA | - | Software used to run the experimental stimulus and analyze the EEG data |
| Recording PC | Lenovo Group Limited, Hong Kong, China | Model: X58K | Intel Core i7-7700HQ CPU@2.80 GHz, RAM 8 GB /EEG data recording using Brain Vision Recorder |
| Sensor&Trigger Extension(STE) | Brain Products GmBH Ltd., Munich, Germany | STE-055604-0162 | Adds physioloigcal signals to the EEG amplifier |
| Splitter box | Brain Products GmBH Ltd., Munich, Germany | BP-135-1600 | Connects Ag/AgCl electrodes to the EEG amplifier |
| Stimulation PC | Hansung Corporation, Seoul, Korea | Model: ThinkPad P71 | Intel Core i7-8750H CPU@2.20 GHz, RAM 8 GB Presenting stimulation screen using MATLAB |
| TriggerBox | Brain Products GmBH Ltd., Munich, Germany | BP-245-1010 | Receives trigger signal from PC and relay it to EEG recording system |
References
- Faria-Fortini, I., Michaelsen, S. M., Cassiano, J. G., Teixeira-Salmela, L. F. Upper extremity function in stroke subjects: Relationships between the international classification of functioning, disability, and health domains. Journal of Hand Therapy. 24 (3), 257-265 (2011).
- Veerbeek, J. M., Kwakkel, G., van Wegen, E. E., Ket, J. C., Heymans, M. W. Early prediction of outcome of activities of daily living after stroke: a systematic review. Stroke. 42 (5), 1482-1488 (2011).
- Babiloni, C., et al. Human movement-related potentials vs desynchronization of EEG alpha rhythm: a high-resolution EEG study. Neuroimage. 10 (6), 658-665 (1999).
- Giaquinto, S., Cobianchi, A., Macera, F., Nolfe, G. EEG recordings in the course of recovery from stroke. Stroke. 25 (11), 2204-2209 (1994).
- Bartur, G., Pratt, H., Soroker, N. Changes in mu and beta amplitude of the EEG during upper limb movement correlate with motor impairment and structural damage in subacute stroke. Clinical Neurophysiology. 130 (9), 1644-1651 (2019).
- Boyd, L. A., et al. Biomarkers of stroke recovery: Consensus-based core recommendations from the Stroke Recovery and Rehabilitation Roundtable. International Journal of Stroke. 12 (5), 480-493 (2017).
- Thibaut, A., et al. Using brain oscillations and corticospinal excitability to understand and predict post-stroke motor function. Frontiers in Neurology. 8, 187(2017).
- Caliandro, P., et al. Small-world characteristics of cortical connectivity changes in acute stroke. Neurorehabilitation and Neural Repair. 31 (1), 81-94 (2017).
- Saes, M., et al. Is Resting-state EEG longitudinally associated with recovery of clinical neurological impairments early poststroke? A prospective cohort study. Neurorehabilitation and Neural Repair. 34 (5), 389-402 (2020).
- Vecchio, F., et al. Cortical connectivity from EEG data in acute stroke: A study via graph theory as a potential biomarker for functional recovery. International Journal of Psychophysiology. 146, 133-138 (2019).
- Ang, K. K., et al. A randomized controlled trial of EEG-based motor imagery brain-computer interface robotic rehabilitation for stroke. Clinical EEG and Neuroscience. 46 (4), 310-320 (2015).
- Abiri, R., Borhani, S., Sellers, E. W., Jiang, Y., Zhao, X. A comprehensive review of EEG-based brain-computer interface paradigms. Journal of Neural Engineering. 16 (1), 011001(2019).
- Antelis, J. M., Montesano, L., Ramos-Murguialday, A., Birbaumer, N., Minguez, J. Decoding upper limb movement attempt from EEG measurements of the contralesional motor cortex in chronic stroke patients. IEEE Transactions on Biomedical Engineering. 64 (1), 99-111 (2017).
- Lee, M. H., et al. EEG dataset and OpenBMI toolbox for three BCI paradigms: an investigation into BCI illiteracy. Gigascience. 8 (5), giz002(2019).
- Jasper, H. H. Report of the committee on methods of clinical examination in electroencephalography: 1957. Electroencephalography and Clinical Neurophysiology. 10, 370-375 (1958).
- Chatrian, G. E., Lettich, E., Nelson, P. L. Ten percent electrode system for topographic studies of spontaneous and evoked EEG activities. American Journal of EEG technology. 25 (2), 83-92 (1985).
- Shim, M., et al. Altered functional networks of alpha and low-beta bands during upper limb movement and association with motor impairment in chronic stroke. Brain Connectivity. , (2021).
- Semlitsch, H. V., Anderer, P., Schuster, P., Presslich, O. A solution for reliable and valid reduction of ocular artifacts, applied to the P300 ERP. Psychophysiology. 23 (6), 695-703 (1986).
- Kim, Y. W., et al. Riemannian classifier enhances the accuracy of machine-learning-based diagnosis of PTSD using resting EEG. Progress in Neuropsychopharmacology & Biological Psychiatry. 102, 109960(2020).
- Griffin, D., Lim, J. Signal estimation from modified short-time Fourier transform. IEEE Transactions on Acoustics, Speech, and Signal Processing. 32 (2), 236-243 (1984).
- Lachaux, J. P., Rodriguez, E., Martinerie, J., Varela, F. J. Measuring phase synchrony in brain signals. Human Brain Mapping. 8 (4), 194-208 (1999).
- Shim, M., Kim, D. W., Lee, S. H., Im, C. H. Disruptions in small-world cortical functional connectivity network during an auditory oddball paradigm task in patients with schizophrenia. Schizophrenia Research. 156 (2-3), 197-203 (2014).
- Shim, M., Hwang, H. J., Lee, S. H. Impaired functional cortical networks in the theta frequency band of patients with post-traumatic stress disorder during auditory-cognitive processing. Frontiers in Psychiatry. 13, 811766(2022).
- Bassett, D. S., Bullmore, E. Small-world brain networks. Neuroscientist. 12 (6), 512-523 (2006).
- Rubinov, M., Sporns, O. Complex network measures of brain connectivity: uses and interpretations. Neuroimage. 52 (3), 1059-1069 (2010).
- Shiner, C. T., Tang, H., Johnson, B. W., McNulty, P. A. Cortical beta oscillations and motor thresholds differ across the spectrum of post-stroke motor impairment, a preliminary MEG and TMS study. Brain Research. 1629, 26-37 (2015).
- López-Larraz, E., Sarasola-Sanz, A., Irastorza-Landa, N., Birbaumer, N., Ramos-Murguialday, A. Brain-machine interfaces for rehabilitation in stroke: A review. NeuroRehabilitation. 43 (1), 77-97 (2018).
- Fong, K. N., Chan, C. C., Au, D. K. Relationship of motor and cognitive abilities to functional performance in stroke rehabilitation. Brain Injury. 15 (5), 443-453 (2001).
- Vecchio, F., et al. Acute cerebellar stroke and middle cerebral artery stroke exert distinctive modifications on functional cortical connectivity: A comparative study via EEG graph theory. Clinical Neurophysiology. 130 (6), 997-1007 (2019).
- Hwang, H. J., Kwon, K., Im, C. H. Neurofeedback-based motor imagery training for brain-computer interface (BCI). Journal of Neuroscience Methods. 179 (1), 150-156 (2009).
- Park, S. A., et al. Evaluation of feature extraction methods for EEG-based brain-computer interfaces in terms of robustness to slight changes in electrode locations. Medical & Biological Engineering & Computing. 51 (5), 571-579 (2013).
Access restricted. Please log in or start a trial to view this content.
Reprints and Permissions
