This protocol enables the impact of prophages on their hosts to be revealed. Bacterial cultures are synchronized using conditions that best support the lysogenic state, limiting spontaneous induction. RT-qPCR unequivocally distinguishes prophage-restricted genes and those uncoupled from phage control from those that are expressed during the lytic replication cycle.
Method Article
Understanding the Impact of Temperate Bacteriophages on Their Lysogens Through Transcriptomics
In This Article
Summary
Abstract
Temperate phages are found integrated as prophages in the majority of bacterial genomes. Some prophages are cryptic and fixed in the bacterial chromosome, but others are active and can be triggered into a replicative form either spontaneously or by exposure to inducing factors. Prophages are commonly associated with the ability to confer toxin production or other virulence-associated traits on their host cell. More recent studies have shown they can play a much bigger role in altering the physiology of their hosts. The technique described here has enabled us to investigate how prophages affect gene expression in the opportunistic bacterium Pseudomonas aeruginosa.
In this work, the growth of the wild-type P. aeruginosa strain PAO1 was compared with that of isogenic lysogens carrying different combinations of prophages from the Liverpool Epidemic Strain (LES) LESB58. In a lysogen culture, a proportion of bacterial cells will be supporting lytic bacteriophage replication (spontaneous induction) with a high level of expression per cell of late phage genes, such as those associated with the assembly of phage particles, thus masking the low-level gene expression associated with lysogen-restricted gene expression. The impact of spontaneous induction can thus obscure prophage gene expression across a lysogen population.
Growth profiling experiments were used to identify spontaneous induction, which was minimal during the early exponential growth phase. This study reports how to prepare sample cultures during the early exponential growth phase and how to set up adequate controls despite low cell numbers. These protocols ensure the reliable and reproducible comparison of wild-type and lysogenic bacteria under various conditions, thus improving the transcriptomic profiling of prophage genomes and aiding in the identification of previously unrecognized prophage functions.
Introduction
Recently, phage therapy for tackling antimicrobial resistance1 and CRISPR-Cas-based gene editing2 have generated renewed interest in bacteriophage research. Again, advancements in biotechnology have enabled the deeper investigation of the interactions between bacteria and phages3. However, the therapeutic use of phage ("phage therapy") is hampered by concerns about phages acting as mobile genetic elements with the capacity to transfer virulence and resistance genes horizontally4. The expanse of "dark matter"5 (genes with unknown functions) is both troubling and enticing. Dark matter is considered a gap in our understanding of phage biology and a largely untapped resource for molecular tools and potential novel therapeutics6. The development of high-throughput sequencing techniques, along with improved gene annotation7,8,9 and new peptide-folding algorithms10, is improving the detection, description, and functional prediction of phage genes. However, science is still far from validating most phages' gene functions in culture or in the real world.
RNA sequencing (RNA-Seq) can globally map gene expression during phage infection and has significantly improved the understanding of both the phage and bacterial elements involved in lytic and lysogenic cycles11,12. During lysogenic processes, temperate phage genomes are integrated into bacterial DNA to become prophages13. Global gene expression profiling experiments can be used to identify prophage-restricted genes that are encoded on temperate phage genomes but only expressed during the lysogenic state11. Such genes do not encode phage structural proteins and are not involved in any phage infection processes. RNA-Seq can be used to identify those genes that are more likely to influence the biology of the bacterial host, either by inducing a gain of function or regulating the existing bacterial genes, thus often enabling the bacteria to adapt to changing environments. Therefore, the ability of prophages to act as microbial puppet masters, controlling a range of bacterial functions, could be studied.
There are two major barriers to the effective analysis of prophage-restricted gene expression. Firstly, the availability of susceptible hosts is a key issue. By definition, prophages are already incorporated into their specific host genome, so it is challenging to find a susceptible wild-type host to compare the global gene expression in the presence and absence of the prophage. This can be achieved either through the de novo infection of another susceptible host or the deletion of the prophage from the original wild-type isolate, without disrupting the rest of the host genome. The second barrier lies in the heterogeneous nature of lysogenic populations. Some prophages degrade through mutation or recombination to become "cryptic", meaning they are fixed in a specific location of the bacterial genome. However, other prophages are "active" and can be induced into a replicative, lytic cycle spontaneously or after exposure to inducing factors. In many lysogenic cultures, the rate of spontaneous induction means that a proportion of the bacterial cells are always undergoing lytic phage replication14,15,16. A high level of expression of late phage genes in these populations masks the low-level gene expression associated with lysogen-restricted gene expression11,17. The proportion of lysogens undergoing spontaneous prophage induction may vary with the growth state, growth conditions, or other triggers. Therefore, to study the impacts of prophages upon the lysogen, spontaneous prophage induction events must be minimized as much as possible by optimizing the growth conditions to favor the lysogenic state.
This study reports the preparatory work done to investigate the influence of a set of cohabiting prophages from the Liverpool Epidemic Strain (LES) of Pseudomonas aeruginosa. Active prophages were induced and isolated from LES and used to infect the model P. aeruginosa host strain, PAO116,18,19. The whole genomes of the wild-type P. aeruginosa strain, PAO1, and its lysogen, PAO1Φ2, were sequenced (at a depth of 30x coverage) to ensure the identity of the wild-type strain and to confirm that the lysogen was isogenic. The LES has been associated with increased morbidity and mortality in cystic fibrosis patients, and LES phages19 have been suggested to aid adaptation to the cystic fibrosis lung environment16,19,20. Despite strong evidence that these prophages affect the biology of their host20,21, the majority of their gene functions are yet to be characterized, and the specific mechanisms of interaction are poorly understood. A transcriptomics approach can empirically uncover the prophage gene functions in a controlled host background. Since spontaneous induction can affect expression profiles, this article describes how to optimize the growth conditions to favor the lysogenic state. Such synchronization of cultures can be validated by real-time PCR to quantify the expression levels of key genetic markers that are associated with crucial stages of LES phage replication in PAO1. The same approach has been used previously to identify the prophage-restricted functions of Shiga-toxigenic phages that affect motility, acid resistance, and antimicrobial resistance in Escherichia coli11,17,21,22.
Protocol
1. Create a selectable indicator host (Figure 1)
NOTE: Phage culture lysates can contain contaminating cells from the original bacterial host. Having an antibiotic-resistant indicator strain allows for the discrimination between the indicator strain and the original bacterial host of the prophage. Using a selectable indicator strain enables the accurate enumeration of the infective phage particles without requiring centrifugation or filtration steps to remove the phage from the lysogen cells following the phage amplification steps. The selectable indicator host strain also reduces the time and number of steps for phage enumeration so that multiple conditions can be trialed simultaneously.
- Identify a suitable indicator host strain susceptible to lytic and lysogenic infection by the temperate phage of interest. The P. aeruginosa lab strain PAO118,20 was used and is susceptible to the three LES phages (LESΦ2, LESΦ3, and LESΦ4).
- Choose a suitable selective agent (rifampicin was used here), and perform a broth dilution assay to determine the minimum inhibitory concentration (MIC) for the indicator host (16 µg·mL−1 is the MIC for PAO1)23,24.
- Sequentially expose the indicator host cultures to increasing concentrations of the selective agent in lysogeny broth (LB), starting below the MIC (in this case 5 µg·mL−1), for 18–24 h, with shaking, and at 37 °C.
- Transfer the culture growing at the highest concentration at a ratio of 1:100 (inoculum to medium) into two-fold increased concentrations of the selective agent (18–24 h each time) until the MIC has been increased sufficiently. PAO1 became a rifampicin-resistant strain (PAO1-RifR) at 300 µg·mL−1 rifampicin.
2. Temporal direct enumeration of spontaneous induction (Figure 2)
- Set up overnight starter cultures of both the lysogen (e.g., P. aeruginosa PAO1 lysogen harboring LES phages) and indicator host (PAO1-RifR) by inoculating a single colony in 5 mL of LB, and incubate at 37 °C with shaking at 180 rpm (18–24 h).
- Set up fresh lysogen and indicator host cultures by inoculating the overnight cultures in 100 mL of LB at a ratio of 1:100, and incubate at 37 °C with shaking (180 rpm).
- Monitor the lysogen growth by measuring the OD600 and viable count using the Miles Misra technique25. To do this, collect a 1 mL sample from each lysogen culture every hour from the point of inoculation for 8 h.
- Serially dilute the sample immediately after collection by adding 100 µL of the sample into 900 µL of the respective medium. Vortex well at the maximum speed, discard the tip at each dilution, and continue the dilution series from 10−1 to 10−9.
- Spot 10 µL of the required dilutions in triplicate onto an LB agar plate, allow to dry, and incubate at 37 °C for 18–24 h.
- To calculate the number of viable bacterial cells, find a dilution with easily countable colonies. Count the number of colonies in each spot, and then use the following formula:

NOTE: As the lysogen culture grows, active phage particles will be produced by spontaneous induction. The production of infective phages means that the transcriptome of the lysogen population is now contaminated with lytic replication cycle-associated gene expression from the lytic phage replication signal and the corresponding host cell response. It is, thus, important to identify the growth stage at which the proportion of lysogenic cells to free infective phage particles is highest in order to limit as much background transcription noise (generated by the lytic phage transcriptome) as possible in the data set.
- To enumerate the infective phage particles in each temporal sample, inoculate 5 mL of sterile 0.4% bacteriological agar in LB (top agar) with 100 µL of mid-exponential phase indicator host (OD600: 0.4–0.5; in this case, PAO1-RifR) in the presence of an appropriate selective agent (50 µg·mL−1 rifampicin in this case, as the MIC of the PAO1 host is only 16 µg·mL−1; see Table of Materials, row 8 and row 9)
- Spot 10 µL of the same serial dilution (see step 2.2.2) onto the inoculated top agar layer, and allow to dry before incubating at 37 °C for 18–24 h.
- To calculate the infective phage particles, find a dilution with easily countable plaques. Count the number of plaques in each spot.

- Find the time/condition for which the spontaneous induction per CFU (colony forming unit) is minimal for the further experimental steps.
3. Preparation of un-induced and induced lysogen cultures for RNA extraction (Figure 3)
- Set up a fresh overnight culture by inoculating a single colony of the lysogen in 5 mL of LB, and incubate at 37 °C with shaking (180 rpm) for 18–24 h.
- Subculture the overnight culture in 80 mL of LB at a ratio of 1:100 in eight 250 mL flasks.
- Label the first flask as “un-induced” and the others as “induced”, along with the time points when each sample should be harvested (i.e., “induced t = 0”, “induced t = 10 min”, “induced t = 20 min”, etc.; Figure 3).
- After 90 min of incubation, when the OD600 is between 0.1–0.2, or at the time of minimal spontaneous induction (see the discussion), add 4 µL of 1% glacial acetic acid (v/v) to the un-induced flask (Figure 3).
NOTE: As the inducing agent in this work was made using 1% glacial acetic acid as the solvent, the same amount of solvent was added alone as a control step. Alternative controls may be considered depending on the preparation of different inducers. - Add the 80 mL culture from the un-induced flask to 720 mL of sterile LB, and immediately add the stop solution (ice-cold 5% [v/v] phenol, pH 4.3, 95 % [v/v] ethanol) using a volume that is 20% of the culture volume (160 mL), and incubate on ice for a minimum of 30 min and no longer than 2 h to stabilize the RNA transcripts12,26,27. This is the un-induced sample.
- Induce the remaining cultures in seven 250 mL flasks (Figure 3) with the MIC of an appropriate inducing agent (in this case, 25 mg·mL−1 norfloxacin, prepared in 1% glacial acetic acid [w/v], used at a final concentration of 1 µg·mL−1), mix well, and incubate at 37 °C and with shaking at 180 rpm for 1 h.
NOTE: This step will force the lysogen culture into a more coordinated state of lytic replication. Most cells in the culture will begin to undergo lytic production of infective phage particles. - Allow the cells to recover by adding 80 mL of culture from the induced flask to 720 mL of sterile LB, which effectively dilutes the inducing agent. Harvest the bacterial cells from each flask every 10 min from time 0 until 1 h by adding a stop solution, as mentioned in step 3.5.
NOTE: The stop solution stabilizes the RNA for up to 2 h. However, to enhance the sample stability perform all the further steps at 4 °C. - Harvest by centrifugation at 10,000 x g for 15 min at 4 °C as soon as possible, not exceeding 2 h post-treatment to avoid RNA degradation.
- Discard the supernatant, and gently resuspend the bacterial pellets in the residual liquid using an adjustable automatic pipette before transferring each sample to a 1.5 mL microfuge tube.
- Centrifuge the microfuge tubes at high speed (13,000 x g) in a microfuge at 4 °C for 1 min, and discard the residual supernatant.
- Flash-freeze the pellets by plunging each sealed microfuge tube into liquid nitrogen. This will aid the efficient lysis of the cells for RNA extraction.
- Add TRIzol (1 mL) to each frozen pellet, and homogenize the suspension by pipetting (do not vortex). Store at −80 °C until ready to perform RNA extraction for all the samples.
NOTE: The protocol can be paused at this point. - Repeat steps 3.1–3.13 with three biological replicates.
4. Isolation of RNA from un-induced and induced lysogen cultures
CRITICAL: All these steps should be performed in an RNase-free environment28. The workbenches should be wiped with 10% NaClO or proprietary RNase inactivators. The labware should be treated with RNase inhibitors such as DEPC treatment, and nuclease-free water should be used in all the reactions.
- Thaw the frozen TRIzol-treated pellets from step 3.12 on ice, and add 400 µL of molecular biology-grade chloroform.
- Agitate the vials well by inversion for 10 s to complete the lysis of all cells (do not vortex). Then, incubate at room temperature (21 °C) for 2–5 min.
- Separate the aqueous layer from the TRIzol/chloroform mix by centrifugation using a refrigerated table-top microfuge at 4 °C and 13,000 x g for 15 min.
- Collect the aqueous phase (~ 500 µL, top layer) using a 1,000 µL pipette, taking care not to disturb the interphase or organic phase (bottom layer). Transfer to a new 1.5 mL microfuge tube.
- Add 450 µL of molecular biology-grade isopropanol to the separated aqueous phase, mix well by inversion (do not vortex), and incubate at room temperature (21 °C) for 30 min.
- Recover the RNA by centrifugation using a refrigerated centrifuge at 4 °C and 13,000 x g for 30 min.
- Discard the supernatant without disturbing the RNA pellet, and wash the pellet twice with 800 µL of 70 % ethanol prepared with nuclease-free water (do not pipette up and down). Ensure the stability of the RNA pellet by repeating the centrifugation step for 5 min after each wash.
- Discard the ethanol, and air-dry the pellet.
NOTE: Aspirate the ethanol around the pellet carefully using a 10 µL microtip, and dry the pellet by inverting the tube on clean blotting paper. The RNA pellet should turn colorless, and the edges should appear ruffled and visible. Drying too little can leave residual ethanol that can impact downstream processes, and drying the pellet too much can make the resuspension difficult. - Resuspend the RNA in nuclease-free water (50 µL) by incubating at 65 °C on a thermo-shaker with intermittent mixing (every 30 s) for a total of 3–5 min.
CRITICAL: The 2'- OH group of RNA is capable of catalyzing the autocleavage of RNA strands at a high temperature above 65 °C and a high pH. Temperatures below 65 °C will retard the resuspension of the residual DNA, thus limiting the amount of DNA that must be digested at a later stage with DNase I digestion. Hence, keeping the temperature at 65 °C is critical to obtain the best samples.
NOTE: The protocol can be paused at this point, and the samples can be stored at −80 °C.
5. Removal of contaminating DNA from the RNA by DNase treatment
- To remove contaminating DNA from the total RNA before the first-strand cDNA synthesis, add a 0.1 volume of 10x DNase buffer and 1 μL of DNase enzyme to 10 μg of total RNA. Mix the tube gently, and incubate at 37 °C for 30 min.
- Resuspend the DNase inactivation reagent, and add a minimum of 2 μL or a 10% volume of the total reaction volume. Mix well, and incubate the samples for 5 min at room temperature (21 °C) during the redispersion of the DNase inactivation reagent.
- Pellet the DNase reagents by centrifugation using a table-top microcentrifuge at 10,000 × g for 1.5 min.
- Transfer the supernatant containing the RNA to a fresh tube without disturbing the pellet.
NOTE: Check the quality of RNA using a 1 μL scale UV spectrophotometer and microfluidic-based nucleic acid computer analyzer as per the manufacturer’s instructions; purified total RNA can be stored at −80 °C. For qRT-PCR, RNA could be used directly at this point. For more sensitive downstream processes, such as RNA sequencing, that require stringent sample quality, an A260/230 ratio of ε 2.0 must be reached to proceed further. - Make up the volume of the DNA-free RNA solution to 500 μL using nuclease-free water.
- Add 50 μL of nuclease-free 3 M sodium acetate (pH 5.3) and 495 μL of isopropanol. Mix well, and incubate at room temperature for 30 min.
NOTE: This step will precipitate the RNA. - Recover the RNA by centrifugation at 13,000 x g and 4 °C for 30 min.
- Wash the RNA pellet thrice with ice-cold 70% ethanol by centrifuging the samples at 13,000 x g and 4 °C for 5 min after each wash to remove the salts completely.
- Check the quality of the RNA using a 1 μL scale UV spectrophotometer and microfluidic-based nucleic acid computer analyzer as per the manufacturer’s instructions; purified total RNA can be stored at −80 °C.
NOTE: The guide29 was used to achieve the RNA quality standards. If the A260/230 ratio is <2.0, then repeat steps 5.5–5.9.
6. Qualitative and quantitative analysis of the DNase-free RNA
- Validate the efficiency of the DNase treatment for each sample by performing a quantitative PCR using 16S rRNA primers (Table 2) with 1 μg of total RNA, and confirm that no amplification product is produced.
NOTE: The ideal primers to assess gDNA contamination would be primers that are designed to anneal at intron-exon junctions or regulatory regions in prokaryotes or at transcriptionally inactive sites30,31. - Determine the RNA integrity number (RIN) using a microfluidic-based nucleic acid computer analyzer as per the manufacturer’s instructions.
NOTE: Samples that show an RIN ≥ 9 should be used for the first-strand synthesis. Samples that show an RIN < 9 should be discarded, and the isolation steps (1.1–5.4) should be repeated. - Quantify the total RNA concentration using the HS RNA assay kit and a fluorimeter according to the manufacturer’s instructions.
7. First-strand cDNA synthesis
- Prepare an RNA primer mixture for each sample by mixing 1 μg of total RNA with 1 μL of random hexamers (50 ng·μL−1) and 1 μL of 10 mM dNTP mix. Then, adjust the total volume to 10 μL using nuclease-free water.
- Incubate the reaction at 65 °C for 5 min, and place on ice for 1 min.
- Prepare a cDNA synthesis mix for each sample by adding 2 μL of 10x RT buffer; 4 μL of 25 mM MgCl2; 2 μL of 0.1 M DTT; 1 μL of RNase inhibitor (40 U·μL−1); and 1 μL of the reverse transcription reagent (200 U·μL−1) in the indicated order.
- Add the cDNA synthesis mix to the RNA/primer mixture. Mix gently, and centrifuge the samples briefly to collect the components at the bottom of the tube.
- Prime the mix by incubating the samples for 10 min at 25 °C, followed by 50 min at 50 °C. Terminate the reactions by incubating at 85 °C for 5 min, and chill on ice.
- Add 1 μL of RNase H to each tube, and incubate at 37 °C for 20 min to remove the RNA from the DNA:RNA hybrid.
- Finally, dilute the cDNA synthesis reaction to a total volume of 80 μL, and store it at −80 °C until further use.
NOTE: The protocol can be paused at this point.
8. Standard curve and quantitative (q)-PCR to determine the expression levels of marker genes that indicate different stages of phage replication
- Identify a set of target genes that can act as markers for each stage of replication of the phage of interest. In our case, these were as detailed in Table 2.
- Amplify each of the target genes from the template genomic DNA using relevant primers and using PCR with the following amplification conditions: initial denaturation at 95 °C for 2 min; denaturation at 95 °C for 30 s; annealing at the optimal annealing temperature depending on the primers (58 °C was used here) for 30 s; extension at 72°C for 1 min; and final extension at 72 °C for 5 min.
- Purify each amplicon using a PCR purification kit, and clone them in a TA cloning vector as per the manufacturer’s instructions. Verify the sequence of each cloned product by Sanger sequencing.
NOTE: The protocol can be paused at this point. - Calculate the copy number for individual plasmids using the following equation20:

- Prepare a standard template for each marker gene by serially diluting the plasmid DNA from 109 copies/μL to 102 copies/μL in molecular-grade nuclease-free sterile H2O.
- Perform quantitative PCR according to the manufacturer’s instructions for the preferred qPCR system with 1 μL of cDNA (from step 7.7) for each sample in triplicate, along with the respective plasmid standards in triplicate; perform the PCR in a 96-well plate for each target.
- Plot the Log DNA copy number (x-axis) versus the cycle threshold (y-axis, Ct), and use an appropriate platform such as Excel or R to perform a linear regression calculation to display the coefficient of determination (R2) and a linear equation.
NOTE: The coefficient of determination should be above 0.98. - Estimate the copy number for each target using the linear equation (y = mx + b) derived from the linear regression (step 8.7), where y is the estimated Ct; x is the log DNA copy number; m is the slope of the line, which defines the change in the Ct with respect to the DNA copy number; and b is the y-axis intercept that represents the estimated Ct for one DNA copy32.
- For each marker gene calculate the efficiency of the PCR amplification (E) by using the parameters from the linear regression of the standard curve and the following equation, where m is the slope derived from step 8.7 and step 8.8:
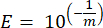
- Validate all the primers in terms of their percent efficiency using the following equation:
NOTE: The efficiency must be in the range of 90%–110%.

- Calculate the absolute copy number of the DNA using the following formula:

where Ct (step 8.8) is the cycle threshold, b is the intercept (step 8.8), m is the slope (step 8.8), and E is the efficienceny of PCR amplification (step 8.9).
CRITICAL: When comparing the amplification of two or more targets by q-PCR, the PCR efficiency must be calculated for each target in order to compare the absolute DNA copy numbers. - In this study, the 16S rRNA, proC, and rpoD genes were used as the general internal controls, and gyrB was used as an induction control33,34,35.
NOTE: When choosing internal controls from the RNA seq data, it is best to select internal controls that do not change in expression levels for the conditions tested. Careful consideration of appropriate controls is always important for the meaningful interpretation of the results.
Results
In this work, the direct temporal enumeration of phage production from a PAO1 LESΦ2 lysogen culture grown under non-inducing conditions was used to determine the impact of spontaneous LESΦ2 induction. The phage density was at its lowest point with a mean of ~2.61 x 10⁶ plaque-forming units (PFU)·mL−1 2 h after subculture in fresh medium during the early exponential phase of growth, suggesting that lysogeny was the dominant state. The LESΦ2 titer rapidly increased to a mean of ~2.4 x 10⁸ PFU·mL−1 within 4 h and reached the highest density after 6 h (mean of ~5.83 x 10⁹ PFU·mL−1; Figure 4).
Minimal spontaneous induction was observed during the early log phase of lysogen growth (after 2 h). However, the measurable presence of phages in the culture medium was the result of many prior events, including the following: the packaging of nucleic acids into protein heads, the assembly of proteins into phage particles, and the expression of late phage genes, middle-stage phage genes, and early regulatory phage genes. It was important to catch the infected cells prior to the expression of the phage-associated replication events; hence, 90 min was chosen to let the culture grow prior to induction. To capture the gene expression profile of the PAO1, LESΦ2 lysogen samples from a culture were harvested pre-induction and post-induction over a 90 min period, as mentioned in step 3.4. This 90 min time point is well before high levels of spontaneous induction of the resident prophage are detected by the plaque assay from step 2.3.2. Since the bacterial cell density was low during early exponential growth, the culture volumes were scaled up to 800 mL to ensure ample material for the gene expression studies. The samples were collected from the uninduced culture and induced cultures every 10 min, and RNA was extracted to map the expression profile of the key markers for lysogeny and lytic replication during the bacterial growth. Total RNA was purified and validated for the absence of genomic DNA using qPCR assays targeting the 16S rRNA gene (step 6.1). The samples reaching an RIN ≥ 9 passed quality control and were converted to cDNA.
The annotated LESΦ2 genome was examined to identify genes that are well-known players in the lysogenic and lytic replication cycles of temperate phages. These identified genes were then used to validate the qRT-PCR for the expression profiling of the lysogen cycle-restricted and lytic cycle-associated genes from induced and un-induced cultures. We quantified the absolute DNA copy number and conducted a Wilcoxon signed-rank test using R36 to compare the expression levels in un-induced and induced cultures (Figure 5). A marked increase in the expression of the cro gene (an early marker of lytic replication) from ~2.31 x 10⁹ copies in un-induced cultures to ~3.02 x 10¹¹ copies 30 min post-induction (Wilcoxon signed-rank test: p < 0.01) was observed. Similarly, O proteins and P proteins, which are mid-stage markers of lytic replication (and are predicted to be involved in phage genome replication), also showed significant upregulation from ~1.74 x 10⁸ to ~1.25 x 10¹⁰ copies (Wilcoxon signed-rank test: p < 0.01) and from ~ 6.05 x 10² to ~5.68 x 10⁵ copies (Wilcoxon signed-rank test: p < 0.01), respectively. Finally, the tail-associated structural genes were used as late markers of the lytic replication cycle. Again, we observed a significant increase in expression from ~2.31 x 10⁶ copies in un-induced cultures to ~4.38 x 10⁸ copies 30 min post-induction (Wilcoxon signed-rank test: p < 0.01). Thus, the quantitative RT-PCR data confirmed that the gene expression of well-established marker genes for lytic replication followed the expected trend, with the early, mid, and late markers showing multiple-fold differential expression in the predicted order (Figure 5). Since the expression of the markers for lytic replication was upregulated 30 min post-recovery, this is considered as an appropriate representative time point for studying the transcriptomic landscape of active temperate phages and their bacterial hosts during the lytic cycle.
We observed some expression of lytic genes in un-induced conditions, confirming that some spontaneous induction always occurs, even in optimized cultures in which the lysogen numbers are represented with the highest ratio of CFU to released PFU in the early log phase. This means that there will always be some level of “noise” in the transcriptomics data, which reinforces the importance of carefully prepared controls, including induced and un-induced cultures. The appropriate choice of the internal control genes to determine the fold changes in expression relies on carefully examining the transcriptomics data to identify genes that are expressed at the same level in both the un-induced and induced samples. Our preliminary results suggest that rpoD was the most reliable control gene tested and had the most stable expression (~1.71 x 10⁵ copies before induction and ~3.33 x 10⁵ copies 30 min post-induction; Wilcoxon signed-rank test: p = 0.3594) compared to the 16S rRNA or proC genes (Figure 5). The variability of the expression of the internal controls led to the measurement of the absolute numbers of transcripts. Future examination of the transcriptomics data will support the choice of appropriate internal controls for further validation.
The cI gene was used in our gene profiling exercise, as it is a well-recognized marker of lysogeny. Compared to the markers for lytic replication, the expression of the cI gene was relatively stable (Figure 5), but the copy number of this gene was reassuringly high in the un-induced cultures compared to those of the markers for lytic replication. These data are in agreement with the low PFU numbers in the same samples, thus confirming that high repressor expression was associated with lower levels of phage production. The data reported here demonstrate that the expression of the cI transcript for this particular phage is not significantly downregulated post-induction, as seen in the Stx phages11,17. Repressor activity is normally controlled at both the transcriptional and post-translational levels, so the repressor gene can be transcribed, but the resultant protein is immediately subjected to autocleavage. Further experimentation is required to validate transcriptional and post-translational controls. Moreover, from our standard curve, the minimum detection limit of qPCR appears to be ~102 copies.
Together, our findings from plaque and qRT-PCR assays validate our strategy for culture and RNA sample preparation to generate a well-controlled input for RNA-Seq experiments. The un-induced cultures in the early-exponential phase exhibited low levels of spontaneous induction and lytic gene expression, suggesting the dominance of lysogeny. In contrast, the cultures isolated 30 min after induction showed significant increases in the expression of marker genes that indicate the dominance of lytic replication.
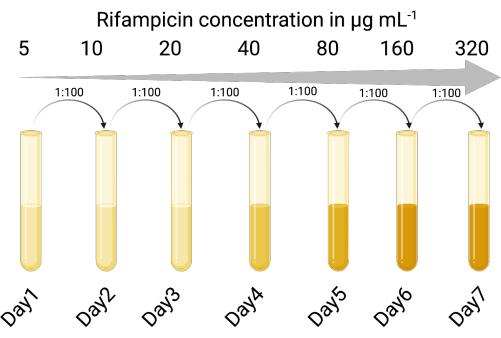
Figure 1: The protocol for creating the rifampicin-resistant indicator host (Created with BioRender.com). Please click here to view a larger version of this figure.
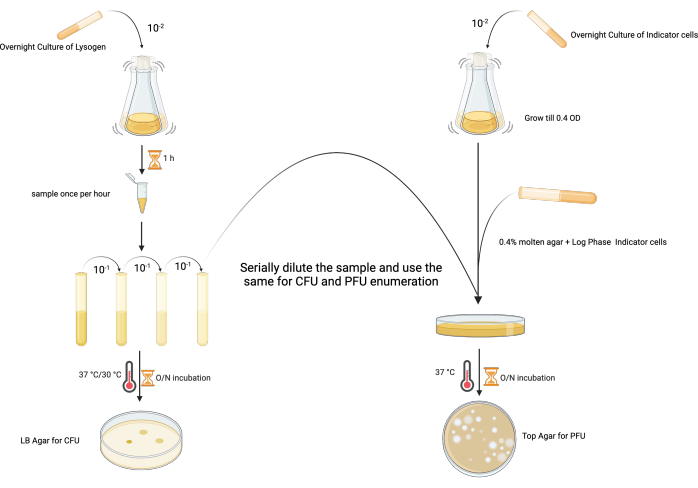
Figure 2: The experimental design for enumerating the PFU and CFU of a lysogen from the same sample. (Created with BioRender.com) Please click here to view a larger version of this figure.
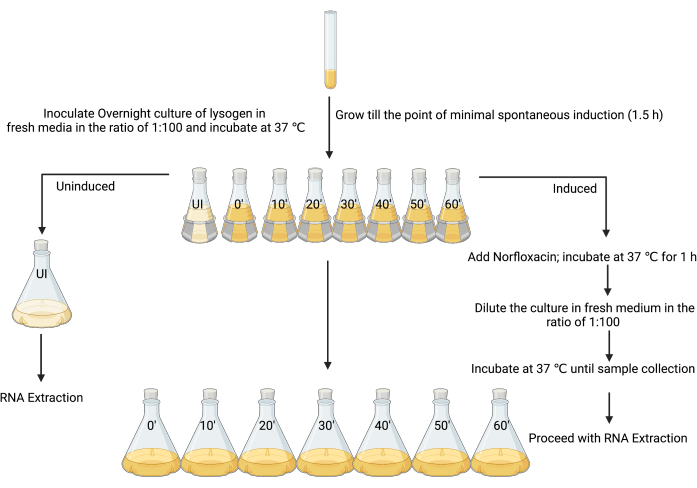
Figure 3: The experimental design for sampling induced and un-induced cultures for RNA isolation. (Created with BioRender.com) Please click here to view a larger version of this figure.
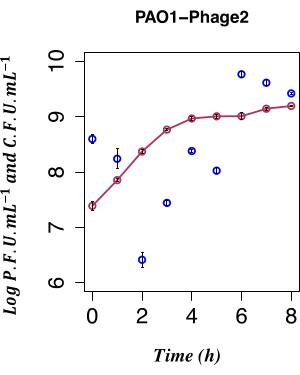
Figure 4: Temporal enumeration of spontaneous induction. Temporal enumeration of spontaneous LES prophage production using the PFU from the PAO1 Φ2 lysogen with the concurrent CFU, n = 8 (two biological and four technical replicates); the error bars represent the standard deviation. The dark red points indicate the CFU·mL−1 in LB; the dark blue points indicate the PFU·mL−1 in LB. The spontaneous release of the φ2 infective phage by the lysogens is at the lowest measurable level at 2 h post-inoculation. Please click here to view a larger version of this figure.
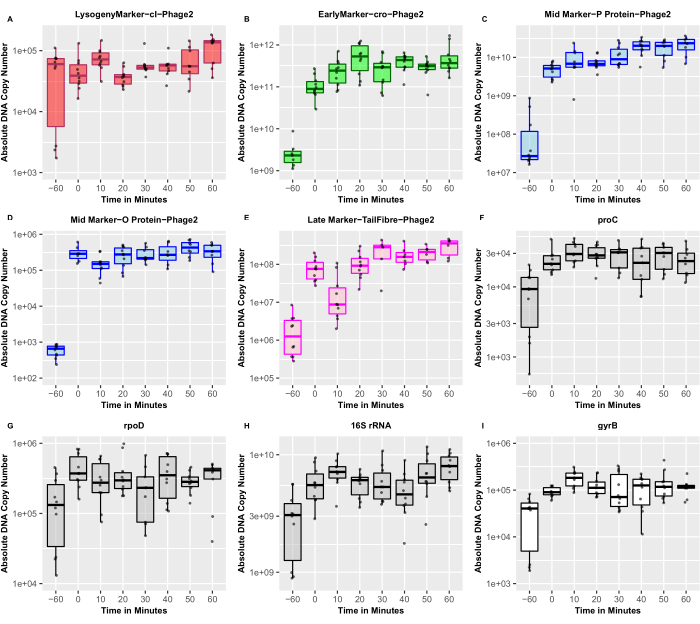
Figure 5: Absolute copy number of the target marker genes. The absolute copy number of phage marker genes confirm the predicted expression patterns, derived using RT-qPCR, of genes expected to play important roles in lysogeny and lytic cycles. The dots represent both three biological and three technical replicates (n = 9). (A)The red box represents the lysogeny marker, cI; (B) green represents the early lytic marker, cro; (C,D) blue represents the mid lytic markers, DNA replication genes; (E) magenta represents the late lytic marker, tail structural genes; (F–H) gray represents the host markers that were used as internal controls, and (I) white represents the DNA gyrase B, which was used as an induction control. The solid horizontal lines show the median of the distribution. Please click here to view a larger version of this figure.
Table 1: Primers designed in this study. The sequences of specific primers for the marker genes and internal controls used in this study are provided, along with their corresponding NCBI accession IDs. Please click here to download this Table.
Table 2: Efficiency of the primers used in this study calculated using the qPCR standard curve. Please click here to download this Table.
Discussion
The creation of a selectable indicator host, previously used in plaque assays to more accurately quantify the spontaneous induction of Stx phage from E. coli MC106137,38,39, has been described here for P. aeruginosa phage LESΦ2. This intervention has the added benefit of reducing the sample processing steps and time, thus enabling the simultaneous assessment of spontaneous induction rates in multiple culture conditions. There is a risk of generating other mutations during the creation of rifampicin-resistant variants40; however, in this work, the evolved strain was only used as an indicator host for the enumeration of plaques from cultures of interest and was not included in the transcriptomic analysis. As long as the selectable indicator strain remains equally susceptible to infection by the phage of interest, there is no concern about other acquired mutations. Nevertheless, no differences in the restriction fragment length polymorphism profiles were detected by the pulse field gel electrophoresis (PFGE) analysis of PAO1WT and PAO1RIF (data not shown).
When choosing host cells, it is rare to find an indicator strain that does not already harbor prophages. As a case in point, PAO1 harbors the filamentous prophage Pf4. The experimental controls for this study were designed to be able to directly examine the gene expression of specific phages (in this case, LES prophage 2) and the effects this phage has on bacterial gene expression. In the comparison of transcripts from PAO1 carrying the LES prophage 2 and lacking the LES prophage 2 (both lysogen and non-lysogen carry the endogenous Pf4), which serve as internal controls to exclude the impact of Pf4 on the host. Additionally, it has been demonstrated that Pf4 usually does not cause lysis in its host cell41 and is, therefore, not capable of confounding the results of these experiments.
It is well-established that careful quality control is crucial in sample preparation for producing meaningful omics data42. However, as previously described11, the careful characterization of prophage activity in the preparation of lysogen cultures for such studies is rarely performed. Here, we detail our systematic protocols for preparing a well-controlled and optimized set of cultures for transcriptomic studies to better explore the interactions between bacteria and temperate phages. The synchronicity of the population was controlled by bringing the culture through at least four doublings before treating it with the inducing antibiotic norfloxacin. By determining the MIC of norfloxacin for the strain in the study, we could ensure that the concentration of the inducing agent was just above the MIC for the “induction” treatment. The treated cells were then diluted 1:10 to lower the norfloxacin concentration below the MIC after the 1 h treatment in order to allow the cells to recover and complete the phage replication process, ending in the lysis of the cell and the release of infective phage progeny. The cells only enter the lytic replication cycle following the induction stimulus once the concentration of norfloxacin has been brought below the MIC during the recovery period. In this case, going above 1 µg·mL−1 norfloxacin means that the drug could not be effectively diluted below the MIC, as the MIC for norfloxacin for PAO1 is 0.19 µg·mL−1. The level of inducer dilution must be balanced with the need for lysogen recovery and the retention of the culture density for harvesting the RNA. The data discussed here demonstrate that it is possible to synchronize cultures to create samples in which lysogeny dominates, thus reducing the noise from spontaneous induction and enabling the detection of true lysogeny-driven changes in gene expression. Since the lysogenic state is predominant in the early-exponential phase of growth when the bacterial cell density is low, we suggest scaling up the cultures to harvest enough RNA for subsequent gene expression studies such as RNA-Seq.
The use of norfloxacin as an inducing agent to force cultures into the lytic cycle is well-reported43,44; however, this will also affect the expression of other bacterial genes in the process45,46. To mitigate this, RNA libraries from control wild-type cultures grown under the same inducing and non-inducing conditions should be included in RNA-Seq experiments. The use of internal controls and key marker genes to validate the stages of phage replication by qRT-PCR is also crucial for accurate comparisons. Quantitative RT-PCR profiling cannot be interpreted by comparing the absolute numbers of transcripts for each gene at various time points; it is the shape of the profile that matters. First, only one small region in the transcript for any gene has been sampled, so whether it is a short-lived or longer-lived element is unknown27. Certainly, RNA-Seq mapping of transcripts shows that the density of the mapping data varies significantly over the length of a gene. Secondly, it is the shape of the gene expression profile that should be interpreted for a marker gene associated with the lytic cycle or the lysogenic lifestyle or even uncoupled from the phage regulatory circuits11. Spontaneous induction is a real issue in lysogen culture and will always result in the expression of lytic cycle-associated genes. However, profiling does show that the genes associated with the lytic replication cycle are suppressed in their expression pre-induction (at least two log folds) and up-regulated post-induction.
The previously conducted transcriptomic analyses of Stx phage interactions with E. coli support a thorough understanding of the phage genes involved in maintaining lysogeny and triggering the lytic cycle11,17. Currently, the LES phages of P. aeruginosa have been annotated, but their key gene functions are less well understood. Transcriptomic studies will enable the re-annotation of the LES prophages and improve our understanding of the genes involved in the lysogeny and lytic cycle. Linking gene sequence to function represents a major challenge in the study of novel prophages, which further highlights the need for more studies to confirm the phage gene functions for the production of better annotation tools47. The wider application and adaptation of the protocols and extra quality control measures detailed in this video article could help in unveiling various prophage functions and, thus, improving annotation pipelines and transforming our understanding of phage and bacterial biology.
Materials
| Name | Company | Catalog Number | Comments |
|---|---|---|---|
| PAO1 | 6 | ||
| LESB58 | 6 | ||
| LES phages | Induced and purified from LESB58 using Norfloxacin. | This study | |
| Lysogeny Broth (LB) | Merck | 1.10285.500 | |
| LB Agar | Merck | 1.10283.500 | |
| Agar Agar | Fisher | A/1080/53 | |
| Top Agar | 0.4 g Agar Agar+2.5 g LB Broth in 100 mL water; autoclave and use. | - | |
| Rifampicin | Sigma (Stock: 50 mg/mL in Methanol- Mix well and use 0.22µm filter to sterilize and store it in -20°C until use) | R3501 | |
| Glacial Acetic Acid | Fisher 1% (v/v) in water | 10060000 | |
| Norfloxacin | Sigma (Stock: 25 mg/mL of 1% Glacial Acetic Acid-Mix well and use 0.22µm filter to sterilize and store it in -20°C until use;To avoid freeze thaw cycles, store as small aliquotes) | N9890 | |
| Phenol saturated with citrate buffer pH 4.3 | Sigma | P-4682 | |
| Molecular Biology grade Ethanol | Fisher | 16695992 | |
| TRIzol | Invitrogen | 12044977 | |
| Chloroform | Fisher | 11398187 | |
| Isopropanol | Fisher | 17150576 | |
| Nuclease-free H2O | Invitrogen | 10526945 | |
| 10X TURBO DNase | Ambion | AM1907 | |
| Qubit RNA HS, BR Kit | Invitrogen | Q10210 | |
| Agilent RNA 6000 Nano Kit | Agilent | 5067-1511 | |
| SuperScriptIII first strand synthesis kit | Invitrogen | 18080051 | |
| PCR Reagents | Bioline Mytaq Red 2X | BIO-25043 | |
| qPCR Reagents | Sensifast SYBR Hi Rox | BIO-92020 | |
| PCR purification kit | Isolate II PCR and Gel Kit | BIO-52060 | |
| TA cloning kit | TA Cloning Kit, with pCR 2.1 Vector, without competent cells | K202040 | |
| StepOne Real Time PCR system | Thermo Fisher Scientific | 4376600 |
References
- Lin, D. M., Koskella, B., Lin, H. C. Phage therapy: An alternative to antibiotics in the age of multi-drug resistance. World Journal of Gastrointestinal Pharmacology and Therapeutics. 8 (3), 162-173 (2017).
- Jiang, W., Marraffini, L. A. CRISPR-Cas: New tools for genetic manipulations from bacterial immunity systems. Annual Review of Microbiology. 69 (1), 209-228 (2015).
- Santos, S. B., Azeredo, J. Bacteriophage-based biotechnological applications. Viruses. 11 (8), 737(2019).
- Rodríguez-Rubio, L., Jofre, J., Muniesa, M. Is genetic mobilization considered when using bacteriophages in antimicrobial therapy. Antibiotics. 6 (4), 32(2017).
- Hatfull, G. F. Dark Matter of the biosphere: The amazing world of bacteriophage diversity. Journal of Virology. 89 (16), 8107-8110 (2015).
- Yukgehnaish, K., et al. PhageLeads: Rapid assessment of phage therapeutic suitability using an ensemble Machine Learning approach. Viruses. 14 (2), 342(2022).
- Seemann, T. Prokka: Rapid prokaryotic genome annotation. Bioinformatics. 30 (14), 2068-2069 (2014).
- Arndt, D., et al. PHASTER: A better, faster version of the PHAST phage search tool. Nucleic Acids Research. 44, W16-W21 (2016).
- Banerjee, S., et al. FINDER: An automated software package to annotate eukaryotic genes from RNA-Seq data and associated protein sequences. BMC Bioinformatics. 22 (1), 205(2021).
- Jumper, J., et al. Highly accurate protein structure prediction with AlphaFold. Nature. 596 (7873), 583-589 (2021).
- Veses-Garcia, M., et al. Transcriptomic analysis of Shiga-toxigenic bacteriophage carriage reveals a profound regulatory effect on acid resistance in Escherichia coli. Applied and Environmental Microbiology. 81 (23), 8118-8125 (2015).
- Owen, S. V., et al. A window into lysogeny: revealing temperate phage biology with transcriptomics. Microbial Genomics. 6 (2), e000330(2020).
- Davies, E. V., Winstanley, C., Fothergill, J. L., James, C. E. The role of temperate bacteriophages in bacterial infection. FEMS Microbiology Letters. 363 (5), 015(2016).
- Livny, J., Friedman, D. I. Characterizing spontaneous induction of Stx encoding phages using a selectable reporter system. Molecular Microbiology. 51 (6), 1691-1704 (2004).
- Fogg, P. C. M., et al. Identification of multiple integration sites for Stx-phage Φ24B in the Escherichia coli genome, description of a novel integrase and evidence for a functional anti-repressor. Microbiology. 153 (12), 4098-4110 (2007).
- James, C. E., et al. Differential infection properties of three inducible prophages from an epidemic strain of Pseudomonas aeruginosa. BMC Microbiology. 12, 216(2012).
- Riley, L. M., et al. Identification of genes expressed in cultures of E. coli lysogens carrying the Shiga toxin-encoding prophage Φ24B. BMC Microbiology. 12 (1), 42(2012).
- Stover, C. K., et al. Complete genome sequence of Pseudomonas aeruginosa PAO1, an opportunistic pathogen. Nature. 406 (6799), 959-964 (2000).
- Winstanley, C., et al. Newly introduced genomic prophage islands are critical determinants of in vivo competitiveness in the Liverpool Epidemic Strain of Pseudomonas aeruginosa. Genome Research. 19 (1), 12-23 (2009).
- Davies, E. V., et al. Temperate phages enhance pathogen fitness in chronic lung infection. The ISME Journal. 10 (10), 2553-2555 (2016).
- Allison, H. E. Stx-phages: drivers and mediators of the evolution of STEC and STEC-like pathogens. Future Microbiology. 2 (2), 165-174 (2007).
- Allison, H. E., et al. Immunity profiles of wild-type and recombinant Shiga-like toxin-encoding bacteriophages and characterization of novel double lysogens. Infection and Immunity. 71 (6), 3409-3418 (2003).
- Mori, N., et al. A peptide based on homologous sequences of the β-barrel assembly machinery component BamD potentiates antibiotic susceptibility of Pseudomonas aeruginosa. Journal of Antimicrobial Chemotherapy. 67 (9), 2173-2181 (2012).
- Chojnacki, M., et al. A novel, broad-spectrum antimicrobial combination for the treatment of Pseudomonas aeruginosa corneal infections. Antimicrobial Agents and Chemotherapy. 63 (10), e00777(2019).
- Miles, A. A., Misra, S. S., Irwin, J. O. The estimation of the bactericidal power of the blood. Epidemiology & Infection. 38 (6), 732-749 (1938).
- Srikumar, S., et al. RNA-seq brings new insights to the intra-macrophage transcriptome of Salmonella Typhimurium. PLoS Pathogens. 11 (11), e1005262(2015).
- Kröger, C., et al. The transcriptional landscape and small RNAs of Salmonella enterica serovar Typhimurium. Proceedings of the National Academy of Sciences of the United States of America. 109 (20), E1277-E1286 (2012).
- Green, M. R., Sambrook, J. How to win the battle with RNase. Cold Spring Harbor Protocols. (2), (2019).
- Koetsier, G. A practical guide to analyzing nucleic acid concentration and purity with microvolume spectrophotometers. New England BioLabs Inc. , Available from: https://www.neb.com/-/media/nebus/files/application-notes/technote_mvs_analysis_of_nucleic_acid_concentration_and_purity.pdf?rev=c24cea043416420d84fb6bf7b554dbbb (2019).
- Saunders, N. A., Lee, M. A. Real-Time PCR: Advanced Technologies and Applications. , Caister Academic Press. Norfolk, UK. (2013).
- Bustin, S. A. A-Z of Quantitative PCR. , International University Line. La Jolla, CA. (2004).
- Ruijter, J. M., et al. Efficiency correction is required for accurate quantitative PCR analysis and reporting. Clinical Chemistry. 67 (6), 829-842 (2021).
- Fothergill, J. L., Neill, D. R., Loman, N., Winstanley, C., Kadioglu, A. Pseudomonas aeruginosa adaptation in the nasopharyngeal reservoir leads to migration and persistence in the lungs. Nature Communications. 5 (1), 4780(2014).
- Huang, J., et al. Temperature-dependent expression of phzM and its regulatory genes lasI and ptsP in rhizosphere isolate Pseudomonas sp. strain M18. Applied and Environmental Microbiology. 75 (20), 6568-6580 (2009).
- Savli, H., et al. Expression stability of six housekeeping genes: a proposal for resistance gene quantification studies of Pseudomonas aeruginosa by real-time quantitative RT-PCR. Journal of Medical Microbiology. 52 (5), 403-408 (2003).
- Kassambara, A. rstatix: Pipe-Friendly Framework for Basic Statistical Tests. , Available from: https://CRAN.R-project.org/package=rstatix (2022).
- McDonald, J. E., et al. High-throughput method for rapid induction of prophages from lysogens and its application in the study of Shiga toxin-encoding Escherichia coli strains. Applied and Environmental Microbiology. 76 (7), 2360-2365 (2010).
- Smith, D. L., et al. Short-tailed Stx phages exploit the conserved YaeT protein to disseminate Shiga toxin genes among Enterobacteria. Journal of Bacteriology. 189 (20), 7223-7233 (2007).
- James, C. E., et al. Lytic and lysogenic infection of diverse Escherichia coli and Shigella strains with a verocytotoxigenic bacteriophage. Applied and Environmental Microbiology. 67 (9), 4335-4337 (2001).
- Rees, V. E., et al. Characterization of hypermutator Pseudomonas aeruginosa isolates from patients with cystic fibrosis in Australia. Antimicrobial Agents and Chemotherapy. 63 (4), e02538(2019).
- Li, Y., et al. Excisionase in Pf filamentous prophage controls lysis-lysogeny decision-making in Pseudomonas aeruginosa. Molecular Microbiology. 111 (2), 495-513 (2019).
- Van Kampen, A. H. C., Moerland, P. D. Taking bioinformatics to systems medicine. Systems Medicine. 1386, 17-41 (2016).
- Matsushiro, A., Sato, K., Miyamoto, H., Yamamura, T., Honda, T. Induction of prophages of enterohemorrhagic Escherichia coli O157:H7 with norfloxacin. Journal of Bacteriology. 181 (7), 2257-2260 (1999).
- James, C. E., et al. Lytic activity by temperate phages of Pseudomonas aeruginosa in long-term cystic fibrosis chronic lung infections. The ISME Journal. 9 (6), 1391-1398 (2015).
- Shaw, K. J., et al. Comparison of the changes in global gene expression of Escherichia coli induced by four bactericidal agents. Microbial Physiology. 5 (2), 105-122 (2003).
- Long, H., et al. Antibiotic treatment enhances the genome-wide mutation rate of target cells. Proceedings of the National Academy of Sciences of the United States of America. 113 (18), E2498-E2505 (2016).
- González-Tortuero, E., et al. VIGA: A sensitive, precise and automatic de novo VIral Genome Annotator. bioRxiv. , (2018).
Reprints and Permissions
