Here, we demonstrate the use of cell-based electrical impedance (CEI) as a very easy and straightforward method to study Zika virus infection and replication in human cells in real time. Furthermore, the CEI assay is useful for the evaluation of antiviral compounds.
Method Article
Cell-Based Electrical Impedance Platform to Evaluate Zika Virus Inhibitors in Real Time
In This Article
Summary
Abstract
Cell-based electrical impedance (CEI) technology measures changes in impedance caused by a growing or manipulated adherent cell monolayer on culture plate wells embedded with electrodes. The technology can be used to monitor the consequences of Zika virus (ZIKV) infection and adherent cell replication in real time, as this virus is highly cytopathogenic. It is a straightforward assay that does not require the use of labels or invasive methods and has the benefit of providing real-time data. The kinetics of ZIKV infection are highly dependent on the employed cell line, virus strain, and multiplicity of infection (MOI), which cannot be easily studied with conventional endpoint assays. Furthermore, the CEI assay can also be used for the evaluation and characterization of antiviral compounds, which can also have dynamic inhibitory properties over the course of infection. This methods article gives a detailed explanation of the practical execution of the CEI assay and its potential applications in ZIKV research and antiviral research in general.
Introduction
Zika virus (ZIKV) outbreaks are associated with serious disease complications, such as microcephaly and Guillain-Barre syndrome1,2,3. Although future epidemics are plausible due to various risk factors such as spreading mosquito vector distribution and increasing urbanization, to date, no vaccine or antiviral drug has made it to market yet3,4. Therefore, traditional ZIKV research methods should be supplemented with novel tools to study this virus and its potential antiviral compounds. Antiviral research is often based on phenotypic assays, where the endpoint is the presence of a specific parameter, such as the appearance of a virus-induced cytopathic effect (CPE) or production of a particular virus-induced protein by means of a reporter gene5,6,7. However, these methods have endpoint readouts, are labor-intensive, and may require complex analysis. Therefore, impedance-based methods offer an attractive alternative.
Cell-based electrical impedance (CEI) is defined as the resistance to current flow from one electrode to another, caused by an adherent cell layer seeded on electrode-containing wells.The established CEI technology employed in this methodology is Electric Cell-substrate Impedance Sensing (ECIS), originally developed by Giaever and Keese8,9. This is used in a broad field of biological research domains, such as cancer metastasis, toxicology, and wound healing10,11,12. Its principle relies on an electric field that is generated by a continuous sweeping of alternating current (AC) voltages over a range of frequencies13. The cells are exposed to these noninvasive electric fields, and at predetermined intervals, the impedance changes caused by cell growth or changes in cell adherence or morphology are measured14. Furthermore, altered cell viability also leads to impedance changes, rendering the technology a useful tool to monitor infection with cytopathogenic viruses15,16,17. As morphological changes of the cell layer will be detected at the nanoscale range, the technology offers a highly sensitive detection tool. The CEI assay described in this article is an easy, noninvasive, real-time, label-free method to measure the impedance changes of the cell layer over time.
Although CEI has not been used to evaluate the course of ZIKV infection or its potential antivirals, its use as a diagnostic tool has been investigated before18. In a recent study, the use of the CEI assay to determine the antiviral activity of several ZIKV inhibitors in A549 cells was validated for the first time19. This methods article describes this CEI assay in more detail and expands it to various adherent cell lines, as well as a variety of ZIKV strains at various multiplicities of infection (MOI). Hereby, the versatile use of this method in flavivirus antiviral research is demonstrated. The method has the crucial benefit of real-time cell monitoring, which allows the detection of important infection time points and the dynamic inhibiting activity by potential antiviral compounds. Taken together, the CEI technology offers a powerful and valuable tool to complement the current range of antiviral methodologies.
Protocol
All steps described are carried out under sterile conditions in a laminar flow cabinet of a Biosafety level 2 laboratory. All used viruses were obtained and used as approved, according to the rules of a Belgian institutional review board (Departement Leefmilieu, Natuur en Energie, protocol SBB 219 2011/0011) and the Biosafety Committee at the KU Leuven.
1. Cell culture maintenance
NOTE: This protocol is performed with a selection of cell lines, but can of course be adapted to any adherent cell line, only requiring cell seeding density optimization.
- Grow the A549 human lung adenocarcinoma cell line, the U87 human malignant glioblastoma cell line, and the HEL 299 human embryonal lung fibroblast cells in T75 culture flasks at 37 °C and 5% CO2 in a humidified incubator.
- Subculture the cells at 80%-95% confluency. All reagents should be at room temperature (RT) before culturing the cells.
- Remove the conditioned culture medium from the cells. Use 5 mL of Dulbecco's phosphate-buffered saline (DPBS) to wash the cell monolayer once.
- Distribute 1 mL of 0.25% trypsin-ethylenediaminetetraacetic acid (EDTA) evenly over the cell monolayer. Then, incubate for up to 3 min at 37 °C until the cells start to detach.
- Add 9 mL of fresh complete growth medium (see Table of Materials for details). Pipet gently up and down to resuspend the cells.
- Transfer the desired volume of cell suspension to a new T75 culture flask and add an appropriate volume of fresh growth medium to obtain a total volume of 15 mL.
NOTE: The in vitro cell lines used in this protocol are subcultured in 1:4 to 1:10 dilutions, depending on the specific cell line, to allow ideal growth conditions. Subcultures are performed every 3-4 days, so the desired cell suspension volume can also vary based on the number of incubation days.
2. Preparation of CEI plate
- Take a 96-well plate with interdigitated electrodes (see Table of Materials) and fill all the wells with 100 µL of growth culture medium.
- Fill the spaces between the wells with DPBS.
NOTE: This is done to reduce the edge effect due to evaporation that is observed when culturing cells in 96-well plates. - Incubate the plate for 4 h at 37 °C in an incubator with 5% CO2.
3. Seeding of cells
- Detach the cells from the culture flask, as described in section 1, and resuspend them in fresh growth medium in a 50 mL tube.
- Count the number of viable cells using the method of choice.
NOTE: In the case of A549 cells, viability generally reaches ~100%. To determine the cell number, we use an automated cell analysis system based on acridine orange/propidium iodide staining (see Table of Materials). Other cell counting methods work equally well. - Resuspend the cells in fresh growth medium to obtain the desired cell density. In this study, the optimal A549 cell density is 0.15 × 10⁶ (viable) cells/mL.
- Take the 96-well plate with interdigitated electrodes out of the incubator and remove the medium with a multichannel pipet.
- Dispense 100 µL of the cell suspension (corresponding to 15 × 103 cells in this case) per well in the 96-well plate.
- Allow the cells to equilibrate for 15 min at room temperature before placing them in the CEI device.
4. Setting up and running the CEI assay
- Place the incubator that houses the CEI device plate holder at 37 °C and 5% CO2.
- Place the 96-well plate in the device.
- Open the device's software and set up a new experiment by clicking Setup in the Collect Data pane. Wait for the laptop to connect to the ECIS device and configure the plate by checking the wells' impedances. Check whether all the wells are correctly configured, as indicated by a green color. If not, repeat step 4.2 until all the wells are green.
- In the Well Configuration pane, select the array type, according to the used culture ware.
- Select Multiple Frequency/Time mode.
NOTE: In this mode, the device measures impedance changes at a range of frequencies. - Start the measurement by clicking Start.
NOTE: Real-time impedance can be monitored on the software's interface. Select the desired frequency to be shown. In this example, 16 kHz is chosen.
5. Compound preparation and incubation
NOTE: As an example of an antiviral compound, labyrinthopeptin A1 is used (See Table of Materials). Since this protocol can be generalized to all compounds with potential antiviral activity, we refer to it as 'the compound'.
- Allow complete cell culture medium without the addition of fetal bovine serum (FBS) (referred to as 'assay buffer') to equilibrate at RT.
- Keep the compounds on ice.
- Prepare a 10x concentrated dilution of each compound in assay medium in 5 mL polypropylene tubes.
- Serially dilute the compounds in assay medium in 5 mL polypropylene tubes to obtain the desired 10x concentrations.
- Pause the CEI device by clicking Pause in the Data Collection Setup pane. Wait for the current time point to be completed and take out the 96-well plate.
- Verify the adherence and monolayer formation of the cells under a light microscope.
- Remove 20 µL from each well with a multichannel pipet.
- Add 20 µL of compound solution or vehicle in the desired wells. Prepare a layout with the specific conditions for proper pipetting.
- Incubate the plate for 15 min at 37 °C with 5% CO2.
NOTE: A normal cell incubator is used for this incubation step instead of a CEI device. Cell control (CC) wells are vehicle-treated wells.
6. Virus preparation and infection
- Thaw a vial of virus stock. In this example, ZIKV MR766 and ZIKV PRVABC59 are used.
- Prepare virus dilutions at the desired MOI or dilutions in assay medium in a 15 mL polypropylene tube.
NOTE: In this representative example, MOI 0.5, 0.1, 0.05, 0.01, 0.005, 0.001, 0.005, and 0.00005 are used. - Add 100 µL of virus dilution in the assigned wells of the 96 well plate. Add assay medium to the CC wells.
- Decontaminate the employed virus containers.
- Put the plate back in the CEI device and continue the measurements for 6 consecutive days by clicking Resume Experiment.
NOTE: Virus control (VC) wells are vehicle-treated infected cells, whereas in CC wells, assay medium is added instead of virus dilution. If the cytotoxicity of the compounds is evaluated, add 100 µL of assay buffer instead of virus dilution.
7. Data analysis
- End the experiment by clicking Finish and add optional summary comments, such as information about the specific experimental conditions in the appearing window. Click OK when data collection is complete.
- Select the desired frequency in the Graph pane where the largest impedance difference between CC and VC is measured at the end of the experiment.
- To determine the best frequency, run a pilot experiment with uninfected and infected cells and choose the frequency that-at the time point where the impedance of the infected cells has dropped to its baseline level-leads to the largest observed impedance difference between the uninfected and infected cells. In the case of A549 cells infected with ZIKV, this is 16 kHz.
- To export all the data in a spreadsheet format, make sure all wells are selected in the Well Configuration pane and click File | Export data | Graph data.
- Normalize the data by subtracting the average VC impedance value measured at the end of the experiment from all the data points and dividing this by the average CC impedance value of the last time point measured before infection.
- Plot the normalized data in the function of time to obtain CEI profile graphs.
- Calculate the normalized area under the curve (AUCn) of each condition to determine parameters such as 50% inhibitory concentrations (IC50).
- Calculate other useful parameters, such as CIT50, to, for example, compare the infectivity of various virus strains.
Results
In this article, the use of the CEI assay in ZIKV research is described in detail. The workflow of this assay is illustrated in Figure 1. We demonstrate the convenience of real-time monitoring of ZIKV infection in a desired cell type, as well as the evaluation of infection inhibition by an antiviral compound. As an antiviral example, we use the well-described peptide labyrinthopeptin A1 (Laby A1); we refer to this as 'the compound', since its specific properties are beyond the scope of this methods article and are discussed elsewhere20,21. Of note, the reproducibility of the method is not discussed in the results section, since we want to focus on the individual impedance profiles obtained using the methodology. However, this has been described previously19.
In the first set of experiments, we demonstrate the importance of cell density optimization when performing CEI infection assays (Figure 2). When too many cells are seeded, the cell monolayer will have fully grown and be unable to further spread across the CEI electrodes. This leads to a smaller difference between CC and VC, and thus a lower resolution, decreasing the detection window of antiviral activity. This is well exemplified in Figure 2E. For certain larger cell types, such as U87 cells, seeding cells too densely might even lead to complete detachment of the cell monolayer when manipulating the plate, as demonstrated here (Figure 2F). This is also observed microscopically.
Figure 2 also demonstrates that the assay is very useful for performing cell susceptibility studies. It is clear from Figure 2A,B that the infection kinetics are highly dependent on the cell type. Figure 2C demonstrates that U87 cells are only susceptible to ZIKV infection at high MOIs.
In the second set of experiments, the versatile use of the CEI infection assay is highlighted using various ZIKV strains at different MOIs and in the presence of a well-described antiviral compound (Figure 3). These experiments are performed with A549 cells, a model commonly used in flavivirus research22,23. This cell line has also been used in other studies that have demonstrated its suitability in CEI assays24. First, infection kinetics by a representative ZIKV strain of the African lineage MR766, are compared to those of the Asian lineage PRVABC59. Figure 3A demonstrates that both strains have comparable CEI patterns, with PRVABC59 having slightly slower CPE-inducing properties. This is also reflected by the CIT50 values (Figure 3B). This interesting parameter was first introduced by Fang et al.16 and takes into account the kinetics of CEI measurements. It is defined as the time needed to reduce impedance by 50% as compared to the cell control.
Next, the cells were infected with three different MOIs of either ZIKV MR766 or PRVABC59, in the presence or absence of various compound concentrations, and the impedance profiles were monitored. As can be observed from Figure 3C-H, certain compound concentrations inhibit or delay the impedance drop caused by ZIKV infection. This is also reflected when the AUC values are calculated. The CEI assay results also demonstrate visually that the antiviral activity depends on the MOI and on the time point of potency evaluation. AUCn calculations can be used to determine IC50 values, as demonstrated in Figure 3I. Finally, Figure 3H shows that CIT50 values can also be used to determine and compare compound potencies. Inactive compounds or compound concentrations are characterized by CEI profiles, AUC, and CIT50 values comparable to those of VC.
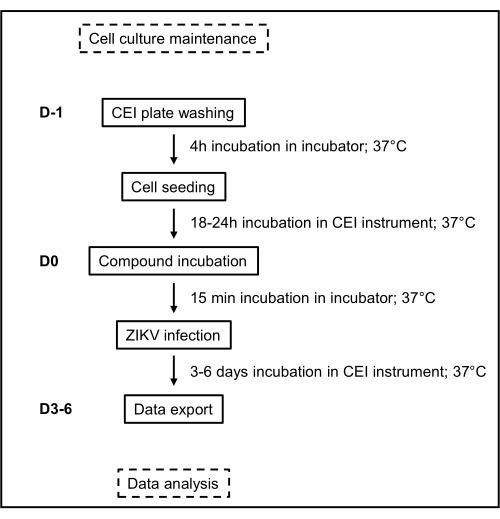
Figure 1: Schematic overview of the assay's workflow. The timeline and different handling and incubation steps of the CEI assay are depicted here. Abbreviations: CEI = cell-based electrical impedance; ZIKV = Zika virus; D = days. Please click here to view a larger version of this figure.
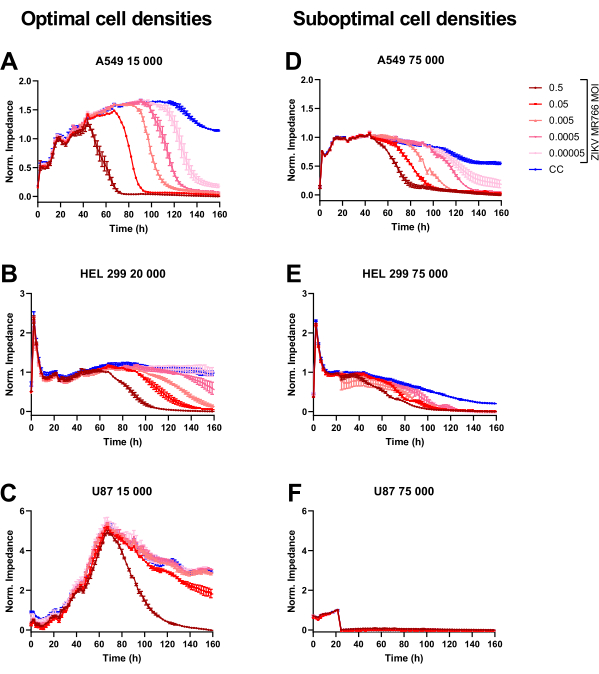
Figure 2: Normalized CEI profiles of ZIKV-infected cells at different densities. (A,D) A549, (B,E) HEL 299, or (C,F) U87 cells were seeded at (A-C) 15,000-20,000 ("optimal") or (D-F) 75,000 ("suboptimal") cells per well in a 96-well CEI plate. After 24 h of impedance monitoring, the cells were infected with tenfold MOI dilutions of ZIKV MR766. Impedance was further monitored for 5 consecutive days. CEI profiles (mean ± range of two technical replicates) of a representative experiment are shown. Abbreviations: CEI = cell-based electrical impedance; MOI = multiplicity of infection; ZIKV = Zika virus; Norm = normalized. Please click here to view a larger version of this figure.
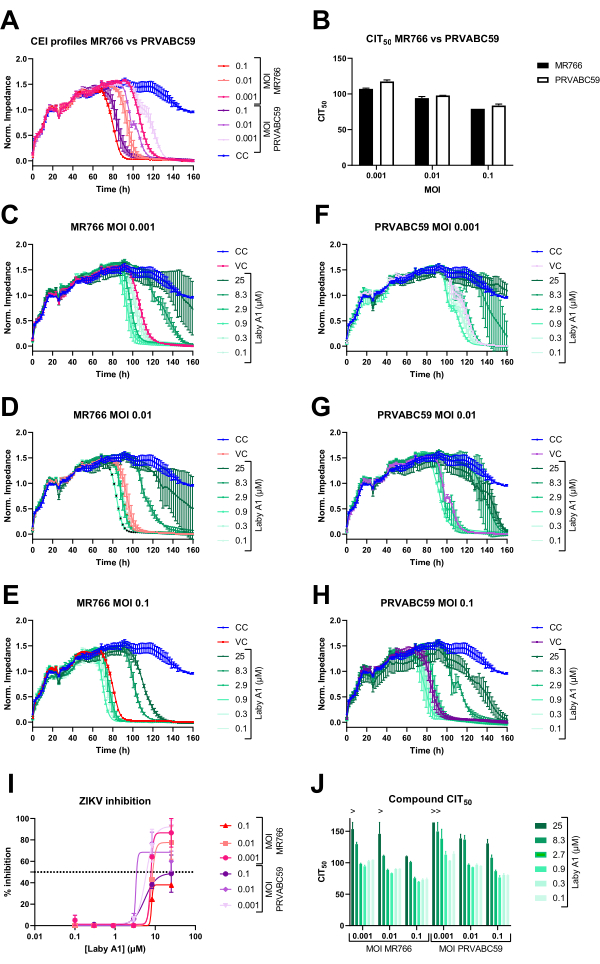
Figure 3: Normalized CEI profiles of A549 cells after infection with two ZIKV strains and inhibition by an antiviral compound. (A) Adherent A549 cells were infected with various MOIs of either ZIKV MR766 or ZIKV PRVABC59, and impedance was monitored continuously. Mean ± SD of three technical replicates of a representative experiment is shown. (B) CIT50 values were calculated based on the CEI profile of A and compared. Mean ± SD of three technical replicates performed is shown. (C-H) Adherent A549 cells were treated with various compound concentrations and subsequently infected with a specific MOI of either ZIKV MR766 (C-E) or ZIKV PRVABC59 (F-H). Impedance was continuously monitored. Mean ± range of two technical replicates of a representative experiment is shown. (I) To compare compound inhibition against different ZIKV strains and dilutions, the AUCn was calculated, and inhibitory percentages were determined by subtracting all conditions by the CC AUCn and dividing by the VC AUCn. (J) The CIT50 values of the experiment shown in C-H were calculated to compare the different ZIKV strains and MOI. Mean ± range of two technical replicates is shown. Abbreviations: CEI = cell-based electrical impedance; MOI = multiplicity of infection; ZIKV = Zika virus; Norm = normalized; CIT50 = time at which impedance decreased by 50% relative to untreated control; AUC = area under the curve; CC = cell control; VC = virus control. Please click here to view a larger version of this figure.
Discussion
This article describes the use of the CEI assay in ZIKV antiviral research. The assay has the benefit of real-time monitoring and can therefore be used to evaluate the kinetics of ZIKV infection and antiviral inhibition with selective compounds. The data obtained with this method allows for an objective and visual observation of the virus-induced CPE and the potency of a potential antiviral compound.
Since CEI is a very sensitive method, great care must be taken when performing this cellular assay. It is crucial that precise pipetting is performed to avoid pipetting variation as much as possible. Moreover, other factors that might influence experimental outcomes, such as cell number and used viral stock, must be kept constant between experiment repetitions. These are factors that highly influence the kinetics of cell growth and infection and could therefore lead to variation in calculated CIT50 values and/or other parameters.
When performing the CEI assay in the presence of (potential) antiviral compounds, it is important to determine if they influence the impedance of the cells in the absence of a virus. The technique is so sensitive that impedance changes might be measured well below the compound's cytotoxic concentrations19.
Although only ZIKV data are shown in this article, the assay can be easily applied to other cytopathogenic (flavi)viruses, with only minimal optimization effort, such as optimal CEI monitoring frequency determination. Adaptations of the CEI assay have been employed with various human and animal viruses, such as chikungunya, influenza A, and human and equine herpesviruses25,26,27,28. Here, it is also used as a simple method for the quantification of viral titers or for the identification of antiviral compounds. These studies used real-time cell analysis, an alternative CEI method.
The use of the CEI technology is limited to adherent cell types, as the assay's principle relies on the properties of adherent cells to spread across the electrode-embedded wells. Well surface coatings such as fibronectin can be used to improve cell attachment29. The methodology has some other drawbacks, the first related to its cost. Apart from the investment in the CEI monitoring device and accompanying hard- and software, the consumables are also somewhat expensive. Further, since the protocol requires monitoring viral infection for several days, one 96-well plate per week can be evaluated. Together with the high cost, this limits the use to low- to medium-throughput settings.
Because of these throughput issues, the technology is unsuitable for antiviral screening settings. However, it is highly appealing in initial experimental phases, for example, when evaluating cell susceptibility for the study of ZIKV infection in a certain disease-related setting. The technology is also useful with transfected or knockout cell lines to easily observe changes in infection kinetics, for example, in the presence or absence of certain entry receptors. This is interesting when investigating the involvement of cellular factors in ZIKV infection. Further, in later preclinical phases, when a certain lead candidate has been selected, the CEI assay can be used for further in-depth characterization of a selected compound. CEI biosensors can also be modified by immobilizing certain biorecognition elements, such as virus-specific antibodies, for the detection of viruses18. Altogether, this highlights the versatile use of CEI in a virology setting.
Disclosures
The authors confirm that there is no conflict of interest.
Acknowledgements
The authors thank Clément Heymann and Gorrit Lootsma for proofreading the manuscript. The study was supported by internal grants of the Laboratory of Virology and Chemotherapy (Rega Institute, KU Leuven).
Materials
| Name | Company | Catalog Number | Comments |
|---|---|---|---|
| A549 cells | American Type Culture Collection (ATCC) | CCL-185 | These cells are cultured in MEM Rega-3 supplemented with 10% FBS, 2 mM L-glutamine, 0.075% sodium bicarbonate. |
| Acridine Orange/Propidium Iodide Stain | Logos Biosystems | F23001 | Live/dead stain |
| Cellstar polypropylene tubes, 15 mL | Greiner bio-one | 1,88,271 | |
| Cellstar polypropylene tubes, 50 mL | Greiner bio-one | 2,27,261 | |
| Dulbecco's Modified Essential Medium (DMEM) | Gibco, Thermo Fisher Scientific | 41965-039 | Cell culture medium for U87 and HEL 299 cells |
| Dulbecco's Phosphate Buffered Saline (DPBS) | Gibco, Thermo Fisher Scientific | 14190-094 | |
| ECIS cultureware 96W20idf | Applied BioPhysics | 96W20idf PET | Assay plate for CEI device |
| Electric cell-substrate impedance sensing (ECIS) Z array station | Applied BioPhysics | CEI device, including 96 well station, external control module and laptop with control, acquisition and display software. The necessary software is installed before shipment. NOTE: this device is currently out of production and has been replaced by the more advanced ECIS Z-Theta device | |
| Falcon polystyrene tubes, 5 mL | Corning | 352054 | |
| Fetal Bovine Serum (FBS) | Cytiva | SV30160.03 | Cell culture medium additive for all used cells |
| HEL 299 cells | ATCC | CCL-137 | These cells are cultured in DMEM supplemented with 10% FBS and 0.01 M HEPES. |
| HEPES buffer, 1 M | Gibco, Thermo Fisher Scientific | 15630-056 | Cell culture medium additive for U87 cells |
| Labyrinthopeptin A1 | Kind gift from Prof. Dr. Roderich Süssmuth, Technische Universität Berlin, Germany | Antiviral compound used as an example in this protocol. It is dissolved in DMSO. | |
| L-Glutamine, 200 mM | Gibco, Thermo Fisher Scientific | 25030-024 | Cell culture medium additive for A549 cells |
| Luna cell counting slides | Logos Biosystems | L12001 | |
| Luna-FL dual fluoresence cell counter | Logos Biosystems | L20001 | Cell viability counter |
| Minimum Essential Medium Rega-3 (MEM Rega-3) | Gibco, Thermo Fisher Scientific | 19993013 | Cell culture medium for A549 cells |
| Sodium Bicarbonate, 7.5% | Gibco, Thermo Fisher Scientific | 25080-060 | Cell culture medium additive for A549 cells |
| Tissue culture flask T75 | TPP | Y9076 | |
| Trypsin-EDTA, 0.25% | Gibco, Thermo Fisher Scientific | 25200-056 | Dissociation reagent |
| U87 cells | ATCC | HTB-14 | These cells are cultured in DMEM supplemented with 10% FBS and 0.01 M HEPES. |
| Virkon Rely+On tablets | Lanxess | 115-0020 | Disinfectant sollution |
| Zika virus (ZIKV) MR766 | ATCC | VR-84 | ZIKV prototype strain, isolated from sentinel Rhesus monkey in Uganda in 1968 |
| ZIKV PRVABC59 | ATCC | VR-1843 | ZIKV strain isolated from patient in Puerto Rico in 2015 |
References
- Cao-Lormeau, V. M., et al. Guillain-Barré Syndrome outbreak associated with Zika virus infection in French Polynesia: a case-control study. Lancet. 387 (10027), 1531-1539 (2016).
- Mlakar, J., et al. Zika virus associated with microcephaly. The New England. Journal of Medicine. 374 (10), 951-958 (2016).
- Pierson, T. C., Diamond, M. S. The emergence of Zika virus and its new clinical syndromes. Nature. 560 (7720), 573-581 (2018).
- Pergolizzi, J., et al. The Zika virus: Lurking behind the COVID-19 pandemic. Journal of Clinical Pharmacy and Therapeutics. 46 (2), 267-276 (2021).
- Bernatchez, J. A., et al. Development and validation of a phenotypic high-content imaging assay for assessing the antiviral activity of small-molecule inhibitors targeting Zika virus. Antimicrobial Agents and Chemotherapy. 62 (10), e00725(2018).
- Zou, J., Shi, P. Y. Strategies for Zika drug discovery. Current Opinion in Virology. 35, 19-26 (2019).
- Mottin, M., et al. Discovery of new Zika protease and polymerase inhibitors through the open science collaboration Project OpenZika. Journal of Chemical Information and Modeling. 62 (24), 6825-6843 (2022).
- Giaever, I., Keese, C. R. Monitoring fibroblast behavior in tissue culture with an applied electric field. Proceedings of the National Academy of Sciences. 81 (12), 3761-3764 (1984).
- Giaever, I., Keese, C. R. A morphological biosensor for mammalian cells. Nature. 366 (6455), 591-592 (1993).
- Rahim, S., Üren, A. A real-time electrical impedance based technique to measure invasion of endothelial cell monolayer by cancer cells. Journal of Visualized Experiments. (50), e2792(2011).
- Szulcek, R., Bogaard, H. J., van Nieuw Amerongen, G. P. Electric cell-substrate impedance sensing for the quantification of endothelial proliferation, barrier function, and motility. Journal of Visualized Experiments. (85), e51300(2014).
- Li, X., et al. Hsp70 suppresses mitochondrial reactive oxygen species and preserves pulmonary microvascular barrier integrity following exposure to bacterial toxins. Frontiers in Immunology. 9, 1309(2018).
- Wegener, J., Keese, C. R., Giaever, I. Electric cell-substrate impedance sensing (ECIS) as a noninvasive means to monitor the kinetics of cell spreading to artificial surfaces. Experimental Cell Research. 259 (1), 158-166 (2000).
- Xu, Y., et al. A review of impedance measurements of whole cells. Biosensors and Bioelectronics. 77, 824-836 (2016).
- Pennington, M. R., Van de Walle, G. R. Electric cell-substrate impedance sensing to monitor viral growth and study cellular responses to infection with alphaherpesviruses in real time. mSphere. 2 (2), e00039(2017).
- Fang, Y., Ye, P., Wang, X., Xu, X., Reisen, W. Real-time monitoring of flavivirus induced cytopathogenesis using cell electric impedance technology. Journal of Virological Methods. 173 (2), 251-258 (2011).
- McCoy, M. H., Wang, E. Use of electric cell-substrate impedance sensing as a tool for quantifying cytopathic effect in influenza a virus infected MDCK cells in real-time. Journal of Virological Methods. 130 (1-2), 157-161 (2005).
- Stukovnik, Z., Bren, U. Recent developments in electrochemical-impedimetric biosensors for virus detection. International Journal of Molecular Sciences. 23 (24), 15922(2022).
- Oeyen, M., Meyen, E., Doijen, J., Schols, D. In-depth characterization of Zika virus inhibitors using cell-based electrical impedance. Microbiology Spectrum. 10 (4), e0049122(2022).
- Prochnow, H., et al. Labyrinthopeptins exert broad-spectrum antiviral activity through lipid-binding-mediated virolysis. Journal of Virology. 94 (2), e01471(2020).
- Oeyen, M., et al. Labyrinthopeptin A1 inhibits dengue and Zika virus infection by interfering with the viral phospholipid membrane. Virology. 562, 74-86 (2021).
- Vicenti, I., et al. Comparative analysis of different cell systems for Zika virus (ZIKV) propagation and evaluation of anti-ZIKV compounds in vitro. Virus Research. 244, 64-70 (2018).
- Gobillot, T. A., Humes, D., Sharma, A., Kikawa, C., Overbaugh, J. The robust restriction of Zika virus by type-I interferon in A549 cells varies by viral lineage and is not determined by IFITM3. Viruses. 12 (5), 503(2020).
- Verma, N. K., Moore, E., Blau, W., Volkov, Y., Babu, P. R. Cytotoxicity evaluation of nanoclays in human epithelial cell line A549 using high content screening and real-time impedance analysis. Journal of Nanoparticle Research. 14, 1137(2012).
- Thieulent, C. J., et al. Screening and evaluation of antiviral compounds against Equid alpha-herpesviruses using an impedance-based cellular assay. Virology. 526, 105-116 (2019).
- Labadie, T., Grassin, Q., Batéjat, C., Manuguerra, J. -C., Leclercq, I. Monitoring influenza virus survival outside the host using real-time cell analysis. Journal of Visualized Experiments. (168), e61133(2021).
- Piret, J., Goyette, N., Boivin, G. Novel method based on real-time cell analysis for drug susceptibility testing of herpes simplex virus and human cytomegalovirus. Journal of Clinical Microbiology. 54 (8), 2120-2127 (2016).
- Zandi, K. A real-time cell analyzing assay for identification of novel antiviral compounds against chikungunya virus. Methods in Molecular Biology. 1426, 255-262 (2016).
- Ebrahim, A. S., et al. Functional optimization of electric cell-substrate impedance sensing (ECIS) using human corneal epithelial cells. Scientific Reports. 12 (1), 14126(2022).
Reprints and Permissions
