This study presents a naturalistic experimental setup that allows researchers to present real-time action stimuli, obtain response time and mouse tracking data while participants respond after each stimulus display, and change actors between experimental conditions with a unique system including a special transparent organic light-emitting diode (OLED) screen and light manipulation.
Method Article
A Naturalistic Setup for Presenting Real People and Live Actions in Experimental Psychology and Cognitive Neuroscience Studies
1Department of Cognitive Science, Middle East Technical University, 2Interdisciplinary Neuroscience Graduate Program, Bilkent University, 3Department of Computer Engineering, Middle East Technical University, 4Department of Cognitive Science, Jagiellonian University, 5Department of Psychology, Interdisciplinary Neuroscience Graduate Program, National Magnetic Resonance Research Center (UMRAM), Aysel Sabuncu Brain Research Center, Bilkent University
Opens in a new tab
In This Article
Summary
Loading...
$$\rightleftharpoonup{xx}$$
$$\longleftharp{xx}$$,
$$\longrightharp{xx}$$,
Abstract
Loading...
$$\rightleftharpoonup{xx}$$
$$\longleftharp{xx}$$,
$$\longrightharp{xx}$$,
Perception of others' actions is crucial for survival, interaction, and communication. Despite decades of cognitive neuroscience research dedicated to understanding the perception of actions, we are still far away from developing a neurally inspired computer vision system that approaches human action perception. A major challenge is that actions in the real world consist of temporally unfolding events in space that happen "here and now" and are actable. In contrast, visual perception and cognitive neuroscience research to date have largely studied action perception through 2D displays (e.g., images or videos) that lack the presence of actors in space and time, hence these displays are limited in affording actability. Despite the growing body of knowledge in the field, these challenges must be overcome for a better understanding of the fundamental mechanisms of the perception of others' actions in the real world. The aim of this study is to introduce a novel setup to conduct naturalistic laboratory experiments with live actors in scenarios that approximate real-world settings. The core element of the setup used in this study is a transparent organic light-emitting diode (OLED) screen through which participants can watch the live actions of a physically present actor while the timing of their presentation is precisely controlled. In this work, this setup was tested in a behavioral experiment. We believe that the setup will help researchers reveal fundamental and previously inaccessible cognitive and neural mechanisms of action perception and will be a foundation for future studies investigating social perception and cognition in naturalistic settings.
Introduction
Loading...
$$\rightleftharpoonup{xx}$$
$$\longleftharp{xx}$$,
$$\longrightharp{xx}$$,
A fundamental skill for survival and social interaction is the ability to perceive and make sense of others' actions and interact with them in the surrounding environment. Previous research in the last several decades has made significant contributions to understanding the fundamental principles of how individuals perceive and understand others' actions1,2,3,4,5,6,7,8,9,10,11. Nevertheless, given the complexity of interactions and the circumstances in which they occur, there is an obvious need to further develop the body of knowledge in naturalistic settings in order to reach a more complete understanding of this complex skill in daily life settings.
In natural environments such as our daily life settings, perception and cognition exhibit embodied, embedded, extended, and enactive characteristics12. In contrast to internalist accounts of brain functions that tend to understate the roles of the body and the environment, contemporary approaches to embodied cognition focus on the dynamic coupling of the brain, body, and environment. On the other hand, most social psychology, cognitive psychology, and neuroscience research on action perception tend to assume that utilizing well-controlled and simplified experiment designs in laboratory conditions (e.g., images or videos in computerized tasks) yields results that can be generalized to more complex scenarios such as real-world interactions1,2,3,4,5,6,7,8,9,10,11. This assumption guarantees that robust and reliable data can be obtained under many circumstances. Nevertheless, a well-known challenge is that the validity of the models derived from carefully controlled experiments is limited when tested in a real-world context13. Consequently, further investigations13,14,15,16,17,18,19,20,21,22 have been conducted to address the ecological and external validity of stimuli and experimental designs in various fields of research.
In this study, a novel method is suggested for investigating how individuals perceive and evaluate others' actions by using live actions performed by a real, physically present actor. Scenarios similar to real-life contexts are employed, while the experimenters have control over possible confounding factors. This study is a form of "naturalistic laboratory research", within the framework of Matusz et al.14 which can be conceived as an intermediate stage between "classic laboratory research", which makes use of maximal control over the stimuli and environment, often at the expense of naturalness, and "fully naturalistic real-world research", which aims to maximize naturalness at the expense of control over the stimulation and the environment14. The study aims to address the need for empirical investigations at this level in action perception research in order to bridge the gap between the findings obtained in traditional laboratory experiments with a high degree of experimental control and the findings obtained in studies conducted in entirely unconstrained, natural settings.
Controlled versus unconstrained experiments
Experimental control is an efficient strategy for designing experiments to test a specific hypothesis, as it allows researchers to isolate target variables from likely confounding factors. It also allows for revisiting the same hypothesis with certain levels of amendments, such as using slightly or totally different stimuli in the same design or testing the same stimuli in alternative experimental setups. Systematic investigation through controlled experiments is a traditional form of methodology in research in cognitive science and relevant domains. Controlled experiments still help to establish the body of knowledge on the fundamental principles of cognitive processes in various domains of research, such as attention, memory, and perception. However, recent research has also acknowledged the limitations of traditional laboratory experiments in terms of generalizing the findings to real-world settings, and researchers have been encouraged to conduct studies in enhanced ecological settings13,14,15,16,17,18,19,20,21. This shift aims to address two important issues regarding the discrepancy between traditional laboratory experiments and real-world settings. First, the world outside the laboratory is less deterministic than in experiments, which limits the representative power of systematic experimental manipulations. Second, the human brain is highly adaptive, and this is often underestimated due to the practical limitations of designing and conducting experimental studies22. The concept of "ecological validity"23,24 has been used to address methods for resolving this issue. The term is usually used to refer to a prerequisite for the generalization of experimental findings to the real world outside the laboratory context. Ecological validity has also been interpreted as referring to validating virtually naturalistic experimental setups with unconstrained stimuli to ensure that the study design is analogous to real-life scenarios25. Due to the high degree of variance in the interpretation of this term, an understanding of the advantages and limitations of alternative methodologies and stimulus selection is required.
Levels of naturalism in stimuli and experiment design
Previous work in experimental psychology and cognitive neuroscience has used a wide range of stimuli with different levels of naturalism26. Most researchers prefer to use static images or short dynamic videos because these stimuli are easier to prepare than those that could simulate a real action or an event. Despite having advantages, these stimuli do not allow researchers to measure contingent behaviors among social agents. In other words, they are not actable and do not have social affordance27. In recent years, an alternative to these non-interactive stimuli has been developed: real-time animations of virtual avatars. These avatars allow for the investigation of the interactions between avatars and their users. However, the use of virtual avatars is subject to reduced user apprehension, especially when they do not appear particularly engaging in terms of their realistic and contingent behaviors26. Therefore, there is now more interest in using real social stimuli in experimental studies. Although their design, data recording, and analysis may require advanced equipment and complex data analysis, they are the best candidates for understanding naturalistic human behavior and cognition.
The present study proposes a methodology for using real-life social stimuli in a laboratory environment. This study aims to investigate how people perceive and evaluate others' actions in a setting with enhanced ecological validity compared to traditional laboratory experiments. We have developed and described a novel setup in which participants are exposed to real actors who are physically present and share the same environment with them. In this protocol, the participants' response times and mouse trajectories are measured, which requires precise timing of the stimuli presentation and strict control over the experimental conditions in this enhanced ecological setting. Therefore, the experimental paradigm stands out among the frameworks present in the literature since the naturalness of the stimuli is maximized without sacrificing control over the environment. Below, the protocol presents the steps to establish such a system and then continues with the representative results for the sample data. Finally, a discussion of the paradigm's significance, limitations, and plans for modifications is presented.
Experimental design
Before proceeding to the protocol section, we describe the parameters used in the present study and present the details of the stimuli together with the experimental design.
Parameters in the study
This study aims to measure how the type of actor and the class of actions they perform affect the mind perception processes of the participants. In the protocol, the mind perception process is measured in two main dimensions, namely agency and experience, as proposed by previous research28. The high and low ends of these two dimensions are also included, as recently introduced by Li et al.29.
The structure of the study was inspired by the single-category version30 of the commonly used implicit association task (IAT)31. In this task, the response times of the participants while they match an attribute concept with the target concept are used as an indication of the strength of their implicit associations for these two concepts. In the adaptation of this implicit task, the participants are presented live actions performed by real actors and required to match them to target concepts. The target concepts are the high and low ends of the agency or experience dimensions, depending on the block of the experiment.
To summarize, the independent variables are Actor Type and Action Class. Actor Type has two levels (i.e., two different actors, Actor1 and Actor2, performing in the study). Action Class has two levels: Action Class1 and Action Class2, and each class contains four actions. The participants evaluate the two actors separately in four blocks (one actor in each block), and in each block, the actors perform all of the actions in a counter-balanced order. The participants perform evaluations with respect to two pre-defined and forced dimensions: Agency and Experience. The four blocks in the experiment are (1) Actor1 in Agency Block, (2) Actor2 in Agency Block, (3) Actor1 in Experience Block, and (4) Actor2 in Experience Block. The order of the blocks is also counter-balanced among the participants so that the blocks with the same agent never follow each other.
Besides the answers of the participants, the response times and the x-y coordinates of the wireless mouse they use while they move toward one of the two response alternatives are recorded. So, the dependent variables are the response and the response time (RT) of the participants, as well as the measurements of maximum deviation (MD) and area under the curve (AUC), derived from the computer mouse-tracking. The variable response is categorical; it can be High or Low, and since the evaluations are done in one of the given blocks, the responses can also be labeled as High-Agency, Low-Agency, High-Experience, or Low-Experience. Response time is a continuous variable; its unit is seconds, and it refers to the elapsed time between the start of the presentation of an action and the occurrence of a mouse click on one of the response alternatives. The MD of a trajectory is a continuous variable, and it refers to the largest perpendicular deviation between the trajectory of the participant(s) and the idealized trajectory (straight line). The AUC of a trajectory is also a continuous variable, and it refers to the geometric area between the trajectory of the participant(s) and the idealized trajectory32.
Stimuli and design of the experiment
A three-staged experiment is used in the present study. The measurements from the third part are used for the analyses; the first two parts serve as preparation for the final part. Below, we describe each part of the experiment together with the experimental stimuli and hypotheses.
In Experiment Part 1 (lexical training part), the participants complete a training session to understand the concepts of Agency and Experience and the capacity levels represented with the words High and Low. To select the concepts (n = 12) to be used in this training session, some of the authors of the current work conducted a normative study33. Since the present study was planned to be conducted in the native languages of the participants, the concepts were also translated into Turkish before being normalized. Concepts were selected from among those that were strongly associated with the High (n= 3) and Low (n= 3) ends of the two dimensions (six concepts for each). This part is crucial since the participants' understanding of the concepts is expected to guide their evaluation processes.
In Experiment Part 2 (action identification part), participants watch the same eight actions performed by Actor1 and Actor2 one after the other and report what the action is to the experimenter. This section serves as a manipulation check; by presenting all the actions when both actors are performing them, it is possible to make sure that the participants understand the actions and are familiar with the actors before they start the implicit test, where they need to make fast evaluations. The actions selected for Action Class1 and Action Class2 are those that had the highest H scores and confidence levels (four different action exemplars in each action class) according to the results of the two normative studies (N = 219) for each actor condition conducted by some of the authors (manuscript in preparation). All actions are performed within an equal time duration of 6 s.
This is an ongoing study, and it has some other components; however, the hypotheses for the sections described above are as follows: (i) the type of actor will affect the dependent variables; Actor2 will yield longer RTs, higher MDs, and larger AUCs compared to Actor1; (ii) the type of action will affect the dependent measurements; Action Class1 will yield longer RTs, higher MDs, and larger AUCs compared to Action Class2; (iii) the dependent measurements for High and Low responses for the same actor and action class will differ across the block dimensions: Agency and Experience.
Protocol
Loading...
$$\rightleftharpoonup{xx}$$
$$\longleftharp{xx}$$,
$$\longrightharp{xx}$$,
The experimental protocols in this study were approved by the Ethics Committee for Research with Human Participants of Bilkent University. All participants included in the study were over 18 years old, and they read and signed the informed consent form before starting the study.
1. General design steps
NOTE: Figure 1A (top view) and Figure 1B and Figure 1C (front and back views) demonstrate the laboratory layout; these figures were created with respect to the original laboratory setup and configuration designed for this particular study. Figure 1A shows the top-view layout of the lab. In this figure, it is possible to see LED lights on the ceiling and the actor cabinet. The blackout curtain system divides the room in half and helps light manipulation by preventing light from leaking into the front part of the room (Participant Area). Figure 1B presents the view of the laboratory from the perspective of the experimenter. The participant sits right in front of the OLED screen, and using the see-through display, they can watch the live actions performed by the actors. They give their responses by using the response device (a wireless mouse) in front of them. The experimenter can simultaneously watch the actor through the participant display (OLED screen) and the footage coming from the security camera. Figure 1C demonstrates the backstage of the study (Actor Area) with the security camera and the Actor personal computer (PC), which are not visible to the participant. The security camera footage goes to the Camera PC to establish communication between the actors and the experimenter. The Actor PC displays the block order and the next action information to the actor so that the experiment flows without any interruption. The actors can check the next action quickly while the participants respond to the action in the previous trial.
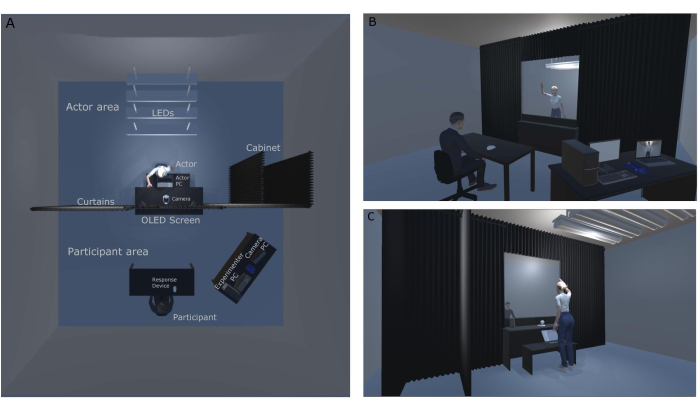
Figure 1: Naturalistic laboratory setup. (A) Top-down view of the naturalistic laboratory setup. (B) The back and front sides of the naturalistic experimental setup from the participant's viewpoint. (C) The back and front sides of the naturalistic experimental setup from the actor's viewpoint. Please click here to view a larger version of this figure.
- Design a setup that includes three computers, including (1) a main control desktop (Experimenter PC), (2) an actor laptop (Actor PC), and (3) a Camera PC, one wireless response device (Participant Mouse), two displays, a lighting circuit, and a security camera (see Figure 2A for the system diagram of the setup of this study).
NOTE: The Experimenter PC will be used by the experimenter to run the experiment scripts, the Actor PC will be used by the actor to track the blocks of the experiment and the order of the actions in the blocks, and the third device, the Camera PC, will be connected to the security camera located in the actor area and used by the experimenter to monitor the backstage. - Connect the separate displays (one for the presentation of stimuli [Participant Display], which is the OLED screen) and a screen for the monitoring of the experiment, the response device, and the lighting circuit (via wires or wireless connections) to the Experimenter PC (see Figure 2A).
- Connect the Experimenter PC and the Actor PC over a wireless network to convey information related to the experiment status (e.g., "next action ID is 'greeting''") to the actors.
- Design and build a lighting circuit that (see Figure 2B for the circuit board) can be controlled by a microcontroller to turn the LEDs on and off.
NOTE: Figure 3A shows the opaque usage of the OLED screen used in the study from the experimenter's view. To ensure opaqueness, the background of the screen is adjusted to white (RGB: 255, 255, 255), and all the lights in the room (both in the Participant Area and the Actor Area) are turned off. The participant sees the fixation before the stimuli. Figure 3B shows the transparent usage of the digital screen in the study from the experimenter's view. To enable transparency, the screen's background is adjusted to black (RGB: 0, 0, 0), and the LED lights on the ceiling are turned on. The participant watches the actor. Figure 3C shows the opaque usage of the digital screen in the study. To ensure opaqueness, the background of the screen is adjusted to white (RGB: 255, 255, 255), and all the lights in the room are turned off. The participant is presented with the evaluation screen to give a response. They need to drag the cursor to the top left or top right of the screen (one of the two response choices, either High or Low) using a wireless mouse. Their mouse trajectory and response time are recorded. - Connect the microcontroller to the Experimenter PC.
- Store the scripts that run the experiment in the Experimenter PC.
NOTE: Figure 4A shows the backstage (Actor Area) during the experiment. The front lights of the room (Participant Area) are off, and the Actor PC is showing the name of the action that will be performed by the actor. Figure 4B shows the actor cabinet in which the actors can wait for their turn and change their outfits. The actor cabinet is not visible from the participant's view, and since a curtain system is used, the actors can use any entrance they want. During the experiment, the fluorescent lights displayed in the figure are off.
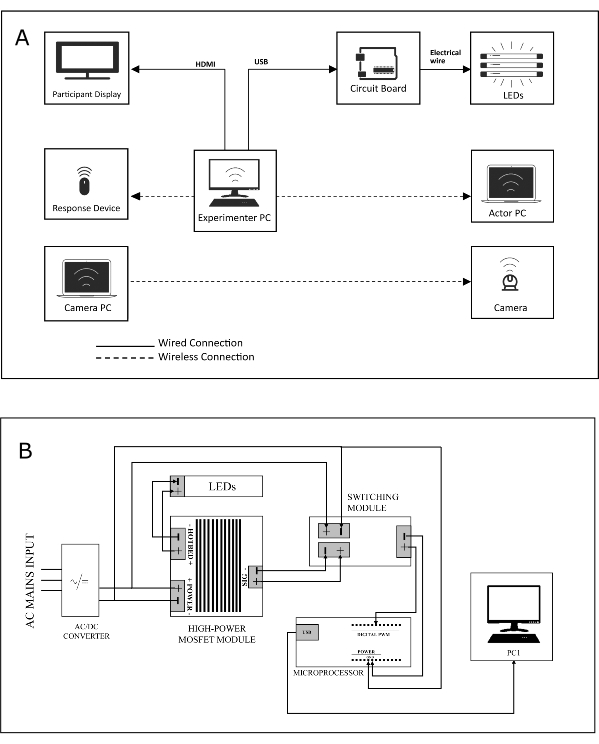
Figure 2: System and wiring diagram. (A) The system diagram of the naturalistic experimental setup. (B) The wiring diagram of the light circuit that supports the OLED screen during the experiment. Please click here to view a larger version of this figure.
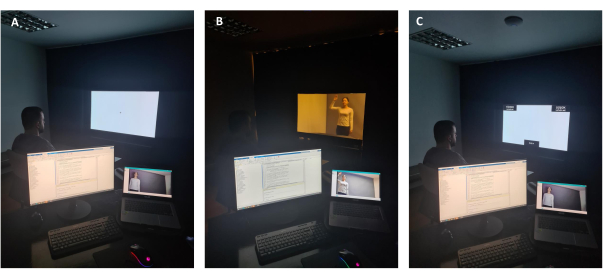
Figure 3: OLED screen from the experimenter's viewpoint. (A) Opaque use of the OLED digital screen from the experimenter's viewpoint. (B) Transparent use of the OLED digital screen from the experimenter's viewpoint. (C) Opaque use of the OLED digital screen from the experimenter's viewpoint during a response period. Please click here to view a larger version of this figure.
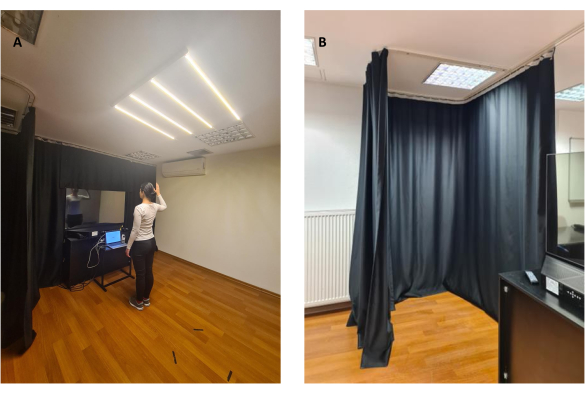
Figure 4: Backstage of the experiment. (A) Backstage during an experiment trial. (B) The actor cabinet is at the back of the OLED screen, in which the actors can wait for their turn to be visible during the experiment. Please click here to view a larger version of this figure.
2. Design and implementation of the lighting circuit
- Steps to follow before powering the devices/components of the circuit
- To change the states of the LEDs that are installed backstage (Actor Area), provide the Experimenter PC with the ability to switch the LEDs to either ON or OFF.
- To convey the digital commands that will be sent from the Experimenter PC over a USB cable, select a microcontroller device that can take digital inputs and generate a digital output (see the Table of Materials for the microcontroller used in this study).
- Select a specific USB port of the Experimenter PC to connect to the USB input of the microcontroller via a USB cable. Do not turn on the PC before making sure all connections have been established successfully.
- Include a switching module to increase the amplitude of the output signal (around 3.3 V) generated by the microcontroller.
- Connect the designated digital output pin (for this experiment, the designated pin is D9) and the ground pins of the microcontroller to the switching module.
- To run the load (the LEDs), include a high-power metal-oxide-semiconductor field-effect transistor (MOSFET) module (or MOSFET module) that is driven by the signal generated by the switching module, and connect the signal pins of the MOSFET module to the corresponding signal-ground pair on the switching module.
- Connect the hot-bed pins of the MOSFET module to the load.
- To supply a regulated constant voltage to the modules (and indirectly, to the LEDs), include a LED power supply that takes alternating current (AC) mains input and generates a constant DC voltage in the circuit.
- Connect the outputs of the LED power supply to the power inputs of both the MOSFET module and the switching module.
- Steps to follow after wiring the circuit components
- Connect the USB cable to the selected USB port of the Experimenter PC.
- Create a serial communication link between the microcontroller and the software environment running on the Experimenter PC (see subsection Connecting the microcontroller to Experimenter PC).
- Connect the LED power supply to the AC mains input.
3. Programming of the experiment
NOTE: Create three main experimental scripts (ExperimentScript1.m [Supplemental Coding File 1], ExperimentScript2.m [Supplemental Coding File 2], and ExperimentScript3.m [Supplemental Coding File 3]), as well as several functions (RecordMouse.m [Supplemental Coding File 4], InsideROI.m [Supplemental Coding File 5], RandomizeTrials.m [Supplemental Coding File 6], RandomizeBlocks.m [Supplemental Coding File 7], GenerateResponsePage.m [Supplemental Coding File 8], GenerateTextures.m [Supplemental Coding File 9], ActorMachine.m [Supplemental Coding File 10], MatchIDtoClass.m [Supplemental Coding File 11], and RandomizeWordOrder.m [Supplemental Coding File 12]) to perform the experiment.
NOTE: Please refer to the related scripts for detailed explanations.
- Randomization of the trial and block orders
- Define and create two functions to randomize the trial orders (RandomizeTrials.m) and block orders (RandomizeBlocks.m) that take the randomization parameters (such as the participant ID) as inputs and return an array of pseudorandomized sequences.
- See the scripts RandomizeBlocks.m (lines 2-24) and RandomizeTrials.m (lines 3-26) for details on how the randomized sequences are generated.
- Tracking of the response (RecordMouse, InsideRoi)
- Create a function that tracks and records the mouse trajectory of the participants and the elapsed time during the experiment (see RecordMouse.m).
- Create a helper function to check whether the clicked coordinates lie inside the acceptable regions or not (see script InsideRoi.m).
- Generation of textures for instructions and feedbacks (GenerateTextures.m, GenerateResponsePage.m)
- Prepare the instructions related to the experiment and the feedback related to the trials as images.
- Save the content of these images to a .mat file (see ExperimentImages.mat file [Supplemental Coding File 13]).
- Load the .mat file into the workspace (see GenerateTextures.m line 25) after creating an on-screen window.
- Create a separate texture and its identifier for each image (see GenerateTextures.m lines 27-165).
- Define a function to draw the related response page textures for each experiment script (see GenerateResponsePage.m).
- Connecting the Actor PC to Experimenter PC over TCP/IP
- Create a TCP server socket in the script (see ExperimentScript2.m line 174) running on the Experimenter PC.
- Create a corresponding TCP client socket in the script (see ActorMachine.m line 16) running on the Actor PC.
- Send information about the upcoming block/trial to the actors from the script (see lines 207, 229, and 278 in ExperimentScript2.m or see lines 136, 141, 153, 159, and 297 in ExperimentScript3.m) running on the Experimenter PC.
- Display the received information from the Experimenter PC on the onscreen window of the Actor PC (see lines 31-47 in ActorMachine.m).
- Connecting the microcontroller to the Experimenter PC
- Connect the microcontroller to a specific USB port (e.g., PORT 9) to control the state (either ON or OFF) of the installed LEDs backstage.
- Establish a serial communication between the microcontroller device and the Experimenter PC (see line 185 in ExperimentScript2.m script).
- Send a logic high signal (1) to the microcontroller from the script running on the Experimenter PC (see line 290 in ExperimentScript2.m or see line 311 in ExperimentScript3.m scripts) to turn on the LEDs when the actions are being displayed via the USB cable.
- Send a logic low signal (0) to the microcontroller from the script running on the Experimenter PC (see line 292 in ExperimentScript2.m or see line 314 in ExperimentScript3.m scripts) to turn off the LEDs when the participant is expected to give a response.
4. The flow of a sample experiment
- Pre-experiment steps
- Make sure all the devices in the lab (Experimenter PC, Camera PC, Actor PC, and Participant Display) are powered by a UPS.
- Link the lightning microcontroller to the Experimenter PC through a USB cable, so it will automatically turn on as the Experimenter PC turns on.)
- Turn on the Experimenter PC, and check whether it is connected to 5 GHz Wi-Fi.
- Choose the sound device (the speakers in the Table of Materials) as the sound output device of the Experimenter PC.
- Turn on the participant display, and set the volume settings to 80%.
- Set the screen settings of the Experimenter PC for multiple monitors. Extend the display of the Experiment PC to the participant display. The display of the Experimenter PC will be 1, and the Participant Display will be 2.
- Turn on the Actor PC, and check whether it is connected to 5 GHz Wi-Fi.
- Connect the security camera to the Actor PC through a USB cable, so it will automatically be powered on as the Actor PC is turned on.
- Turn on the Camera PC, and open the camera application on the desktop. Make sure each actor, their movements, and their entry and exits to the cabinet are visible from the camera.
- Make sure all the computers, displays, and devices (the response device [wireless mouse of the participant], speakers, keyboard, and mouse of the Experimenter PC and Actor PC and the lightning microcontroller) work properly.
- Welcome the participant to another room; after giving brief information about the study, provide the consent form, and let the participant sign it.
- Ask the participant to draw a number from a bag, and tell them that the number will be their participant ID throughout the study.
- Let the participant fill out the online demographics form with their anonymous participant ID.
NOTE: It is crucial that the participants do not see the actors before the experiment. So, this paperwork is completed in another room rather than the main experiment room so that the actors can take breaks between participants.
- The experiment steps
- Open the experiment software on the Experimenter PC, and open the ExperimentScript1.m script and run it.
- Fill in the participant ID and age; then, the script will start the first part of the experiment (the first visible stimulus will be a cross at the center of the Participant Display.)
- Open the experiment software on the Actor PC, and open the ActorMachine.m script.
- Place the Camera PC near the Experimenter PC, and make sure the footage coming from the security camera is not visible to the participant.
- Welcome the participant to the main experiment room, and let them have a seat in front of the participant display.
- Tell the participant to arrange themselves such that the cross is in the middle and straight ahead.
- Give instructions about the parts of the experiment briefly by referring to the explanations and durations written on the whiteboard.
- Turn off all the lights in the experiment room.
- Experiment part 1:
- Tell the participant that they will complete lexical/conceptual training in the first part of the experiment. Warn them about being careful to follow the instructions so that they can pass the training.
- Tell the participant that the experiment can be started when they are ready.
- Press the ESC button when the participant says that they are ready for the first part.
NOTE: From now on, the participant will progress through the experiment by reading the instructions on the Participant Display and selecting one of the choices. They will receive feedback regarding their right and wrong answers so that they can progress well in the training. The matching will continue until the participants reach the minimum threshold (80%) within 10 block repetitions. - When the participant completes the training part, press the ESC button, and tell the participant that the experimenter is taking control of the mouse to start the second part of the experiment.
- Experiment part 2:
- Open the ExperimentScript2.m script, and wait for the prompt Waiting for the Actor PC.
- Ring the bell when the prompt is seen so that one of the actors can run the script on the Actor PC to enable the connection with the Experimenter PC.
- Wait for the prompt Experiment Part 2 is ready.
- Tell the participant that now that the screen will be transparent while they watch some short actions through it.
- Warn them to watch each action carefully, and inform them that they should say what the action is out loud.
- Tell the participant that the experiment can be started when they are ready.
- Press the ESC button when the participant says that they are ready for the first part.
NOTE: The participant progresses through the instructions and watches the first action. Actor1 performs the actions when the LED lights are turned on, and they check the next action from the prompt on the Actor PC when the lights are turned off. When each action ends, a dialog box will emerge on the Experimenter PC screen. - Type what the participant says about the action in the dialog box, and type 1 or 0 in the second dialog box depending on the right or wrong identification of the action, respectively.
NOTE: These steps will be repeated eight times for the first actor, and the background music will start to play when it is time for the actors to change places. - Watch the backstage from the security camera footage on the Camera PC.
- Press the ESC button to start the identification for Actor2 when the actor waves their hands toward the security camera with the I am ready gesture.
- Repeat step 4.4.7 and step 4.4.8 together with the participant until the same eight actions are also identified while they are being performed by Actor2.
- When the participant sees the Identification is complete warning and exits the part by clicking on the arrow, press the ESC button, and tell the participant that the experimenter is taking control of the mouse to start the third part of the experiment.
- Experiment part 3:
- Open the ExperimentScript3.m script.
- Tell the participant that they will watch the actions of both actors, and then they will click on the option which they think is suitable.
NOTE: The participants will evaluate the actions of the actors in four blocks. In two of the blocks, Actor1 will perform the actions, and in the other two, Actor2 will perform the same actions. In two of the blocks, the participants will evaluate the actions by attributing High or Low Agency capacities, and in the other two, they will attribute High or Low Experience capacities. - Press the ESC button when the participant says that they are ready for the third part.
NOTE: The participant progresses through the instructions, and they start with the first block. The actors perform the actions in the light, and while the participants give their responses, the screen becomes opaque, and the lights are turned off so that the actors can see which action is coming next. When each block ends, the actors will change places following the prompts on the Actor PC. - Check whether everything goes well backstage and whether the right actor is conducting the right action during the blocks.
- Press the ESC button to start the next block when the right actor waves their hands with the I am ready gesture after the replacement of the actors.
- Repeat step 4.5.4 and step 4.5.5 in cooperation with the participant and actor until the four blocks are complete.
- When the participant sees the The experiment is over, thank you prompt, press the ESC button.
- Thank the participant, and after debriefing and taking signatures, send the participant out.
Figure 5 shows a sample trial from the participant's view. Figure 5A shows the participant looking at the cursor at the center of the screen in its opaque usage. Figure 5B shows the participant watching the live-action stimuli through the screen. Figure 5C shows the evaluation screen presented to the participant after the stimuli, in which they need to drag the mouse to one of the two alternatives at each top corner of the screen.
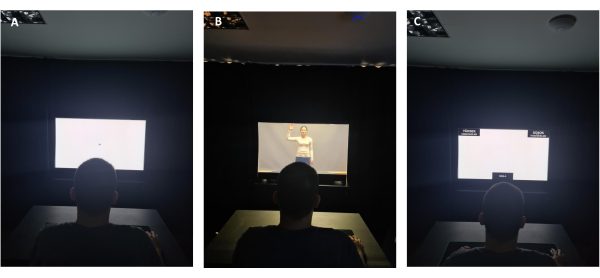
Figure 5: OLED screen from the participant's viewpoint. (A) Opaque use of the OLED digital screen from the participant's viewpoint during a fixation screen. (B) Transparent use of the OLED digital screen from the participant's viewpoint during the presentation of a live action. (C) Opaque use of the OLED digital screen from the participant's viewpoint during the response period. Please click here to view a larger version of this figure.
5. Data pre-processing and analysis
- Segmenting data into conditions
- Read all the participant data files into the workspace of the software environment.
- Define the conditions to group the data (two action classes [Action Class1 and Action Class2] x two actors [Actor1 and Actor2] x two dimensions [Agency and Experience] x two levels [High and Low]).
- Segment the data into four main groups: Agency High, Agency Low, Experience High, and Experience Low.
- Divide these main groups into four subgroups (two actors x two action classes).
- Loop through each data file to group the trials that belong to one of the four previously defined subgroups.
- Store the relevant trial information (response time, cursor movement, and time points at which the cursor position is sampled) in separate data structures for each subgroup.
- Exit the loop when all the trials are grouped.
- Visualization of the trajectories
- After segmenting the data, do the following steps to visualize the mouse trajectories.
- To apply time interpolation to the response trajectories, for each trial, select 101 (x,y) pairs from the trajectory array so that each subgroup of data has trials with an equal number of time steps.
NOTE: While anchoring the number of pairs to 101, make sure to follow the convention32to conduct correct time normalization. Hence, achieve time normalization using the following equation, where n is the number of samples in a trajectory array:

- Compute the summation of (x,y) pairs at each of the 101 time points, and then divide the obtained result by the total number of trials of that subgroup to obtain the means for each sub-group (e.g., Experience Low Actor1 or Experience Low Actor2).
- Apply a scaling operation to the row values to visualize the mean trajectories.
NOTE: The 2D coordinate plane assumes that both axes increase from the zero point that is located at the bottom-left corner of the window (assuming the coordinates are positive integers), whereas the pixel format takes the upper-left corner of the window as the reference (e.g., zero point). Thus, apply a scaling operation for the y-coordinates (corresponding to the row values in pixel format) of the sampled locations by extracting the sampled y-coordinate of each trial from the value of the total number of rows. - Plot the related subgroups in the same figure for comparison.
NOTE: Each trajectory begins at the center of the rectangle located at the bottom center, labeled START, and ends inside the rectangles located in the upper-left or upper-right corners.
6. Conditions that may lead to system failure and precautions
NOTE: In the event of system failure, it is crucial to have a physical sign (ringing a bell) to let the actor know about the failure and warn them to stay in a place that is invisible to the participant.
- Failures due to network connection
- If one of the computers is connected to a different network, the TCP/IP connection request will fail, and the system will show an error. To prevent this, make sure that the Experimenter PC and Actor PC are on the same band of the same wireless network.
- To ensure that both PCs remain on the same network, erase previously connected wireless networks from both PCs.
- Set static IP addresses for the devices on the selected network since the IP addresses on a network may change without notice.
- Any momentary disconnection (e.g., due to a power outage, Internet outage, etc.) to the network may cause the script to fail. In these circumstances, the system needs to be restarted from the beginning to re-establish the TCP/IP connection.
NOTE: The requirement of static IPs for devices can be fulfilled by the Internet service provider. Certain ports might be disabled by the operating system or the hardware on a given device; hence, the ports that are to be used in the experiment must be opened and must not have an active connection until the experiment script launches.
- Failures due to software crashes
- The software environment may crash due to failed connections (e.g., serial port connection, TCP/IP connection, display connection, etc.), and this may lead to a loss of data. To overcome this, divide the main experiment script into multiple scripts. For example, if there is a block that needs to be completed before the actors start performing actions, there is no need to create a server on the Experimenter PC during this block. The server can be created when the block that involves actions, and, thus, requires communication between the Experimenter PC and Actor PC, is about to start.
Results
Loading...
$$\rightleftharpoonup{xx}$$
$$\longleftharp{xx}$$,
$$\longrightharp{xx}$$,
Response time (RT) comparisons
The current study is an ongoing project, so, as representative results, data from the main part of the experiment (Experiment Part 3) are presented. These data are from 40 participants, including 23 females and 17 males, with ages ranging from 18-28 years (M = 22.75, SD = 3.12).
Investigating the extent of the normality of the distribution of the dependent variables was necessary in order to choose the appropriate statistical method for the analyses. So, the Shapiro-Wilk test was performed to understand whether the three dependent variables, namely the response time (RT), maximum deviation (MD), and area under the curve (AUC), were distributed normally. The scores showed that the data for the response time, W = 0.56, p < 0.001, maximum deviation, W = 0.56, p < 0.001, and area under the curve, W = 0.71, p < 0.001, were all significantly non-normal.
The homogeneity of variances of the dependent variables was also checked by applying the Levene's test for the levels of the independent variables, namely Actor Type (Actor1 and Actor2), and Action Class (Action Class1 and Action Class2). For the scores on the response time, the variances were similar for Actor1 and Actor2, F(1, 1260) = 0.32, p = 0.571, but the variances for Action Class1 and Action Class2 were significantly different, F(1, 1260) = 8.82, p = 0.003. For the scores on the maximum deviation, the variances were similar for Actor1 and Actor2, F(1, 1260) = 3.71, p = 0.542, but the variances for Action Class1 and Action Class2 were significantly different, F(1, 1260) = 7.51, p = 0.006. For the scores on the area under the curve, the variances were similar for Action Class1 and Action Class2, F(1, 1260) = 3.40, p = 0.065, but the variances for Actor1 and Actor2 were significantly different, F(1, 1260) = 4.32, p = 0.037.
Since the data in this study did not meet the normal distribution and homogeneity of variance assumptions of the regular ANOVA (analysis of variance) and we had four independent groups on a continuous outcome, the non-parametric equivalent of an ANOVA, the Kruskal-Wallis test, was applied. The four independent groups were derived from the two categorical response variables (High or Low) within the two pre-forced block dimensions (Agency and Experience). Since we were interested in how the dependent variables differed between the participant responses across the dimensions, the data were divided into four subgroups according to responses in the Agency dimension, including Agency-High and Agency-Low, and in the Experience dimension, including Experience-High and Experience-Low. Below, the results of the Kruskal-Wallis tests for the three independent variables are presented. In all cases, the significance threshold was set at p < 0.05.
Response time results
Figure 6 presents the response times of the participants according to their responses of High or Low in the four block dimensions. The response times of the participants are presented for each level of the two independent variables: Actor Type and Action Class. A1 and A2 represent Actor 1 and Actor 2, respectively, while AC1 and AC2 represent Action Class 1 and Action Class 2, respectively.
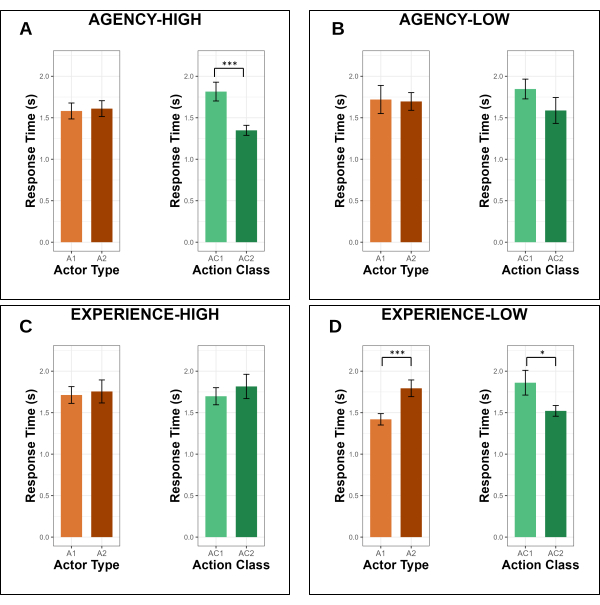
Figure 6: Participants' response times in the task across the actor type and action class. Each panel shows the time the participants spent responding toward one of the levels (High or Low) of the particular dimension (Agency and Experience). The asterisks show significant differences between the levels of actor type or action class (p < .05). Please click here to view a larger version of this figure.
The response times were not significantly affected by the actor type for the Agency-High, H(1) = 1.03, p = 0.308, Agency-Low, H(1) = 2.84, p = 0.091, and Experience-High, H(1) = 0.001, p = 0.968 answers, but they were significantly affected by the actor type for the Experience-Low answers, H(1) = 8.54, p = 0.003. A Wilcoxon signed-rank test was computed to investigate the effect of actor type on the Experience-Low answers. The median response time for Actor1 (Mdn = 1.14) was significantly shorter than the median response time for Actor2 (Mdn = 1.31), W = 8727, p = 0.001.
The response times were not significantly affected by the action class for Agency-Low, H(1) = 1.99, p = 0.158, and Experience-High, H(1) = 0.17, p = 0.675 answers, but they were significantly affected by the action class for the Agency-High, H(1) = 10.56, p = 0.001, and Experience-Low, H(1) = 5.13, p = 0.023, answers. The results of the Wilcoxon signed-rank test demonstrated that for the Agency-High responses, the median response time for Action Class1 (Mdn = 1.30 ) was significantly longer than the median response time for Action Class2 (Mdn = 1.17 ), W = 17433, p = 0.0005; additionally, for the Experience-Low responses, the median response time for Action Class1 (Mdn = 1.44) was significantly longer than the median response time for Action Class2 (Mdn = 1.21), W = 10002, p = 0.011.
Mouse tracking results
The mouse movements of the participants while they were deciding their final response were also recorded. The time and location information were collected to calculate the participants' average motor trajectories. The recording started when the participants saw the verbal stimuli on the screen and ended when they gave a response by clicking on one of the options (High or Low) in the upper-right or upper-left corners of the screen.
Figure 7 presents the maximum deviations of the mouse movements of the participants according to their responses of High or Low in four block dimensions. The maximum deviations of the participants from the idealized straight line of the selected response toward the unselected alternative response are presented for each level of the two independent variables, Actor Type and Action Class. A1 and A2 represent Actor 1 and Actor 2, respectively, while AC1 and AC2 represent Action Class 1 and Action Class 2, respectively.
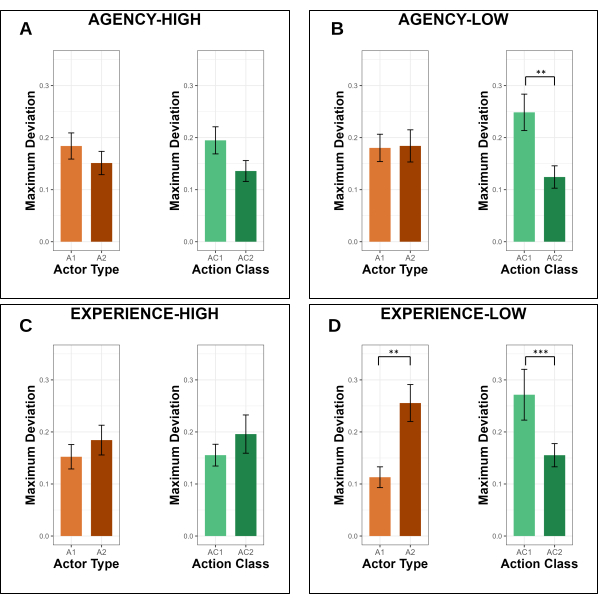
Figure 7: The maximum deviation of the mouse trajectories of the participants across actor type and action class. Each panel shows the maximum deviation of the participants from the idealized straight line of the selected response toward the unselected alternative response while responding toward one of the levels (High or Low) for the particular dimension (Agency and Experience). The asterisks show significant differences between the levels of actor type or action class (p < .05). Please click here to view a larger version of this figure.
The maximum deviations were not significantly affected by the actor type for Agency-High, H(1) = 1.42, p = 0.232, Agency-Low, H(1) = 0.19, p = 0.655, and Experience-High, H(1) = 0.12, p = 0.720, answers, but they were significantly affected by the actor type for the Experience-Low answers, H(1) = 7.07, p = 0.007. A Wilcoxon signed-rank test was performed to investigate the effect of actor type on the Experience-Low answers. The median maximum deviation for Actor1 (Mdn = 0.03) was significantly shorter than the median maximum deviation for Actor2 (Mdn = 0.05), W = 8922, p = 0.003.
The maximum deviations were not significantly affected by the action class for Agency-High, H(1) = 0.37, p = 0.539, and Experience-High, H(1) = 1.84, p = 0.174, answers, but they were significantly affected by the action class for the Agency-Low, H(1) = 8.34, p = 0.003, and Experience-Low, H(1) = 11.53, p = 0.0006, answers. The results of the Wilcoxon signed-rank test demonstrated that for the Agency-Low responses, the median maximum deviation for Action Class1 (Mdn = 0.06) was significantly longer than the median maximum deviation for Action Class2 (Mdn = 0.02), W = 12516, p = 0.0019. Additionally, for the Experience-Low responses, the median maximum deviation for Action Class1 (Mdn = 0.09) was significantly longer than the median maximum deviation for Action Class2 (Mdn = 0.03), W = 10733, p = 0.0003.
Figure 8 presents the areas under the curve of the participants' mouse trajectories according to their responses of High or Low in four block dimensions. The areas under the curve of the participant responses in reference to the idealized straight line of the selected response are presented for each level of the two independent variables, Actor Type and Action Class. A1 and A2 represent Actor 1 and Actor 2, respectively while AC1 and AC2 represent Action Class 1 and Action Class 2, respectively.
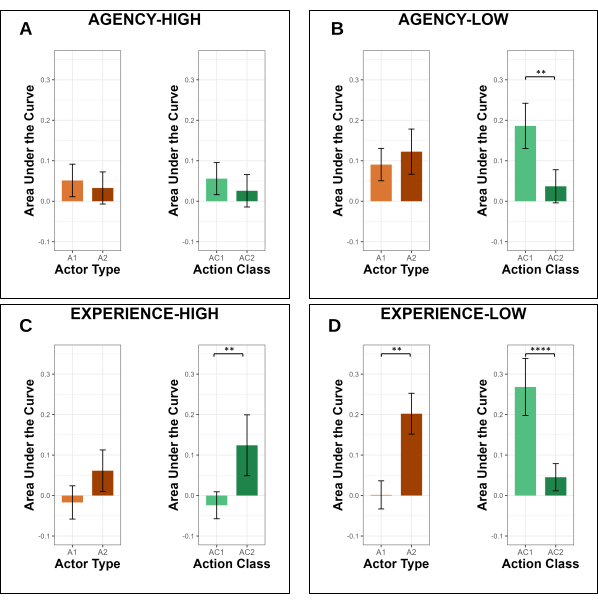
Figure 8: The areas under the curve with respect to the idealized trajectory of the mouse movements of the participants. Each panel shows the area under the curve while the participants are responding toward one of the levels (High or Low) in the particular dimension (Agency or Experience). The asterisks show significant differences between the levels of actor type or action class (p < .05). Please click here to view a larger version of this figure.
The areas under the curves were not significantly affected by the actor type for Agency-High, H(1) = 0.001, p = 0.968, Agency-Low, H(1) = 0.047, p = 0.827, and Experience-High, H(1) = 0.96, p = 0.324, answers, but they were significantly affected by the actor type for the Experience-Low answers, H(1) = 8.51, p = 0.003. A Wilcoxon signed-rank test was computed to investigate the effect of actor type on the Experience-Low answers. The median area under the curve for Actor1 (Mdn = −0.03) was significantly snaller than the median area under the curve for Actor2 (Mdn = 0.02), W = 8731, p = 0.0017.
The areas under the curves were not significantly affected by the action class for Agency-High answers, H(1) = 0.01, p = 0.913, but they were significantly affected by the action class for the Agency-Low, H(1) = 7.54, p = 0.006, Experience-High, H(1)= 5.87, p = 0.015, and Experience-Low, H(1) = 15.05, p = 0.0001, answers. The results of the Wilcoxon signed-rank test demonstrated that for the Agency-Low responses, the median area under the curve for Action Class1 (Mdn = 0.03) was significantly greater than the median area under the curve for Action Class2 (Mdn = −0.03), W = 12419, p = 0.003, and for the Experience-High responses, the median area under the curve for Action Class1 (Mdn = −0.06) was significantly smaller than the median maximum deviation for Action Class2 (Mdn = −0.02), W = 9827, p = 0.007. For the Experience-Low responses, the median area under the curve for Action Class1 (Mdn = 0.05) was significantly greater than the median area under the curve for Action Class2 (Mdn = −0.03), W = 11049, p < 0.0001.
Summary and evaluation of the representative results
Since this is an ongoing study, a representative portion of the data we will have at the end of the large-scale data collection has been presented. However, even these sample data support the effectiveness of the method proposed in the present study. We could obtain the participants' response times and mouse trajectories while they gave their responses after watching real-time actions. We could complete all these steps through the same screen so that participants did not change a modality between watching the real actors and giving the mouse responses, thus allowing us to extend the procedures in the experiments to real-life scenarios.
Table 1 summarizes the results of how the dependent measures, including the response times, MD, and AUC of the mouse trajectories, were affected by the actor type and action class, which were the main independent variables of the study.
| Response Time (RT) | Maximum Deviation (MD) | Area Under the Curve (AUC) | ||||
| Actor Type | Action Class | Actor Type | Action Class | Actor Type | Action Class | |
| Agency High | ns | AC1 > AC2*** | ns | ns | ns | ns |
| Agency Low | ns | ns | ns | AC1 > AC2** | ns | AC1 > AC2** |
| Experience High | ns | ns | ns | ns | ns | AC1 > AC2** |
| Experience Low | A2 > A1*** | AC1 > AC2* | A2 > A1** | AC1 > AC2*** | A2 > A1** | AC1 > AC2**** |
Table 1: Summary of the results. The table shows how the dependent measures (the response times, MD, and AUC of the mouse trajectories) were affected by the main independent variables (actor type and action class) of the study. *, **, and *** represent the significance levels p ≤ 0.05, p ≤ 0.01, and p ≤ 0.001, respectively.
The actor type had a significant effect on the response times of the participants; while they were assigning Low capacity in the Experience dimension, they spent more time doing this for Actor2 compared to Actor1 in the same condition (see Figure 6D). We also observed this longer response time in the measurements of the mouse movements based on the MD and AUC (see Figure 9 for the trajectories). The MDs of the mouse trajectories toward Low responses (see Figure 7D) were significantly higher, and the AUCs of the mouse trajectories (see Figure 8D) were significantly larger when the participants were evaluating Actor2 compared to Actor 1 (comparing the blue lines in Figure 9A,B).
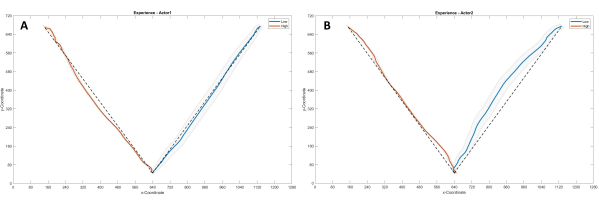
Figure 9: The average mouse trajectories of the participants when evaluating the actions performed by Actor1 and Actor2 in the Experience dimension. The orange lines show the average mouse trajectories toward High responses; the blue lines show the average mouse trajectories toward Low responses. The black dashed straight lines represent the idealized response trajectories, while the grey shaded areas represent the root mean squared standard deviations. Please click here to view a larger version of this figure.
The response times of the participants, while they were responding High to the actions belonging to Action Class1 in the Agency dimension (see Figure 6A), were significantly higher than for the actions belonging to Action Class2; however, these longer response times were not observed in the MD (see Figure 7A) and AUC measurements (see Figure 8A). While responding Low to Action Class1 in the Experience dimension, the participants spent significantly more time than they spent for Action Class2 (see Figure 6D), and this was also apparent in the MD (see Figure 7D) and AUC (see Figure 8D) scores. Figure 10 demonstrates that the MDs of the mouse trajectories toward Low responses (see Figure 7D) were significantly higher, and the AUCs of the mouse trajectories (see Figure 8D) were significantly larger while the participants were evaluating actions belonging to Action Class1 compared to Action Class2 (comparing the blue lines in Figure 10A,B).
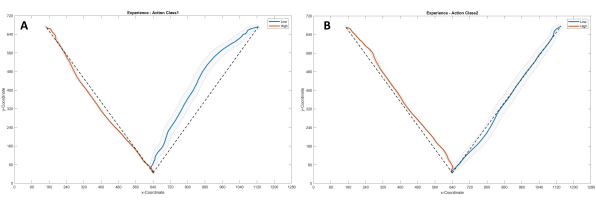
Figure 10: The average mouse trajectories of the participants when evaluating the actors performing the actions belonging to Action Class1 and Action Class2 in the Experience dimension. The orange lines show the average mouse trajectories toward High responses; the blue lines show the average mouse trajectories toward Low responses. The black dashed straight lines represent the idealized response trajectories, while the grey shaded areas represent the root mean squared standard deviations. Please click here to view a larger version of this figure.
Although no significant effects of the action class on the response time measurements for the other block-response combinations were observed, a significant effect of the action class was observed in the MD (see Figure 7B) and AUC (see Figure 8B) scores of Low answers in the Agency dimension. Figure 11 demonstrates that participants hesitated toward the High alternative and moved toward the Low response more when they were evaluating actions from Action Class1 compared to the ones from Action Class2 (comparing the blue lines in Figures 11A,B). Finally, although there was no significant effect of action class on the RT and MD scores for the High responses on the Experience dimension, a significant effect was observed for the AUCs (see Figure 8C) of the trajectories (see Figure 10); specifically, participants hesitated more while evaluating Action Class2 compared to Action Class1 (comparing the orange lines in Figure 10A,B).
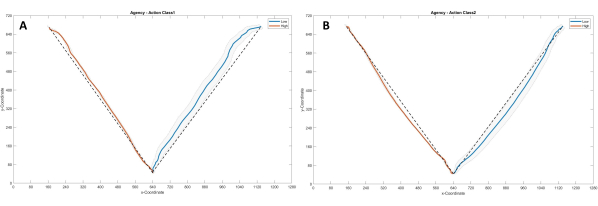
Figure 11: The average mouse trajectories of the participants when evaluating the actors performing the actions belonging to Action Class1 and Action Class2 in the Agency dimension. The orange lines show the average mouse trajectories toward High responses; the blue lines show the average mouse trajectories toward Low responses. The black dashed straight lines represent the idealized response trajectories, while the grey shaded areas represent the root mean squared standard deviations. Please click here to view a larger version of this figure.
The results so far support our hypotheses, which suggested that there would be an effect of the actor type and action class and that the dependent measurements for High and Low responses for the same actor and action class would differ across the block dimensions of Agency and Experience. Since this is an ongoing study, it is outside of the scope of this paper to discuss the possible reasons for the findings. However, as an early remark, we could emphasize that although some results for the response time and the measurements coming from the computer mouse-tracking complemented each other, in some block-response conditions, we observed that participants hesitated toward the other alternative even when they were fast in their evaluations.
If a special OLED screen were not included in the setup, the response times of the participants could still be collected with some other tools such as buttons to press. However, the participants' mouse movements could not be tracked without providing an additional screen and having the participants watch that screen and the real actors back and forth, which would, in turn, delay their responses. So, although response times are useful indicators of the difficulty of the decision-making process, the mouse trajectories of the participants reveal more about the real-time dynamics of their decision processes before their final responses32,34.
Supplemental Coding File 1: ExperimentScript1.m Please click here to download this File.
Supplemental Coding File 2: ExperimentScript2.m Please click here to download this File.
Supplemental Coding File 3: ExperimentScript3.m Please click here to download this File.
Supplemental Coding File 4: RecordMouse.m Please click here to download this File.
Supplemental Coding File 5: InsideROI.m Please click here to download this File.
Supplemental Coding File 6: RandomizeTrials.m Please click here to download this File.
Supplemental Coding File 7: RandomizeBlocks.m Please click here to download this File.
Supplemental Coding File 8: GenerateResponsePage.m Please click here to download this File.
Supplemental Coding File 9: GenerateTextures.m Please click here to download this File.
Supplemental Coding File 10: ActorMachine.m Please click here to download this File.
Supplemental Coding File 11: MatchIDtoClass.m Please click here to download this File.
Supplemental Coding File 12: RandomizeWordOrder.m Please click here to download this File.
Supplemental Coding File 13: ExperimentImages.mat file Please click here to download this File.
Discussion
Loading...
$$\rightleftharpoonup{xx}$$
$$\longleftharp{xx}$$,
$$\longrightharp{xx}$$,
The overarching goal of the present study is to contribute to our understanding of how human high-level visual perception and cognition work in real-life situations. This study focused on action perception and suggested a naturalistic yet controllable experimental paradigm that enables researchers to test how individuals perceive and evaluate others' actions by presenting real actors in a laboratory setting.
The significance of this proposed methodology compared to existing methodologies is three-fold. (1) The naturalness of the stimuli is maximized by presenting live actions to the participants. (2) The real-world stimuli (i.e., actors), other verbal stimuli (e.g., words or instructions), and the actors and actions response screen are presented by using the same modality (i.e., the digital OLED screen) so that the participants will not lose their focus while they change the modality, as in the cases of shutter glass usage, for instance35. (3) Time-sensitive data, such as data on response duration and mouse trajectories, that need strict time control are recorded by using a natural task of today's world, mouse usage.
Certain critical steps in the protocol are important for this paradigm to work seamlessly and allow researchers to achieve their goals while providing a decent experience for participants. These steps are equally important for creating such a system, so we present them individually without ordering them according to their criticality levels.
The first critical step concerns the manipulation of the lighting of the room and changing the color of the background used for the participant display screen. This step allows for a smooth transition between the real-time action performance and the response screen following each action trial. When all the lights in the room are turned off and the screen background is adjusted to white, 100% opacity is achieved so that the study instructions and verbal stimuli can be displayed without any distractions that may come from movements in the background. To make the display transparent and present the verbal stimuli immediately after the action stimuli, the LED lights on the ceilings are turned on while keeping the front lights turned off to have a see-through display. The lighting circuit is essential for appropriate light manipulation in the room. When the fluorescent lights at the front (Participant Area) and back (Actor Area) of the lab are on, the footage of the actor seems a bit tilted, and the participant sees the reflection of themselves and the room. When the front lights in the participant area are off, and the LED lights in the actor area are on, the participant can clearly watch the actors without any distractions. Figure 1 and Figure 3 show how light manipulations work in the experiment.
The second critical step in the protocol is the control of time. The actions last 6 s, and the lighting on the back of the screen is automated with respect to the durations of the actions so that we do not have any delay or acceleration across trials. However, the duration between the blocks is manually controlled (i.e., when we need an actor change), so we can start the next block after checking if everything is going as planned backstage. This period is also suitable for requests from participants or actors, such as the need for water or a change in the temperature in the room.
The third critical step concerns the use of the security camera and the bell. The security camera allows for communication between the experiment conductor and the actors. The experimenter continuously checks what is happening backstage, such as whether the actor is ready or if the right actor is on the stage. The actors wave their hands when they are ready to perform the actions and make a cross sign when there is a problem. The experimenter can even notice if there is a problem with the appearance of an actor, such as forgetting an earring on one ear. The bell allows the experimenter to warn the actors about a likely problem. When they hear the bell, the actors first check whether something about them is wrong, and if it is the case, they correct the issue and tell the experimenter that they are ready. If there is a problem on the experimenter's side, the actors listen to the experimenter explaining the issue to the participant. They wait silently until the experimenter arrives backstage to solve the problem, such as reconnecting after losing the Internet connection.
The fourth step concerns the usage of a heavy, blackout curtain to split the room, since such a material prevents the light from leaking into the front part of the room. This curtain also prevents sound to some extent so that the participants do not hear the small movements of the actors and the quiet conversations between the experimenter and the actors in case of a problem.
The fifth step is the inclusion of the Actor PC and establishing the TCP/IP as the network protocol, since this guarantees that the messages are delivered to the other end, unlike with UDP. In this way, the actors can be informed about the next action they will perform, and the participants do not realize this from their point of view. Moreover, since all the devices are on the same network, any possible additional latency caused by the TCP/IP becomes negligible.
The sixth essential step in the protocol is the inclusion of background music between the blocks. We arranged the music and the blocks so that when the participant responds to the last trial in a block, the music starts to play loudly (at 80% maximum volume) so that the actors know that it is time for a change, and the participants know that they can drink water or rest their eyes. Playing music enables a smooth transition between actors without hearing their movements or other sounds, providing a sense similar to watching a play at the theater.
We believe that the naturalistic setup presented in this paper is a great tool to investigate whether the mechanisms that underlie the visual perception of others' actions that have been revealed by traditional lab experiments approximate natural behavior in the real world. Observing real actors and their live actions will obviously provide a rich source of 3D visual and multisensory information and afford actability due to the physical and social presence of the actor. Therefore, we hypothesize that the perception of live actions may elicit faster and enhanced behavioral and neural responses in the well-known action perception network previously revealed by traditional lab experiments using static images and videos. Additionally, the perception of live actions may drive additional neural circuits that process 3D depth cues36, and vestibular information to coordinate the body in the space while preparing to act in the world37. One limitation of the present study is that the responses from the real actors in the naturalistic setup were not compared with the responses one would obtain for simplistic stimuli such as static images or videos. In future studies, we will work toward this aim by systematically comparing behavioral and neural responses during action perception in traditional lab settings with those in the naturalistic setup.
We also note some limitations of the paradigm proposed in the present study on several fronts. The first is that, like most naturalistic studies, this method requires financial and time resources. Such a study will be higher in terms of the budget than studies using prerecorded dynamic stimuli presented on a regular display, since the present study includes special equipment to display the real actions, and real actors take part in the study for each data collection session. Additionally, the data collection process for the present study could take longer since the real actors perform the actions repeatedly; there is a physical limit for them, unlike for studies using images or videos presented on computer screens. Another related limitation could be the difficulty of making sure that actors perform each action in the same manner across the blocks and participants; however, with sufficient training, actors can become confident in each action, since they are 6 s long. Future work could record live actions and then use computer vision to quantify the variability across different trials of the experiments.
Second, the screen brightness level, when used opaquely, and the rapid changes in the lightning between the opaque and transparent displays can cause a problem for participants with visual problems or disorders such as epilepsy. This potential limitation was addressed by asking participants if they have such a disorder or concern about such a scenario and recruiting those who reported that they would not be bothered by such a scenario. Additionally, none of the participants complained about the music we played in the background during the actor and block changes, but some participants might be disturbed by such noise. A remedy for this could be the usage of noise-canceling headphones. However, they may also prevent any intervention of the experimenter during the study or affect the naturalness of the experimental setup.
Other possible modifications could be applied to the current paradigm; for example, if the experiment design requires participants to interact with the actors orally, both sides can use lapel microphones. All network connections could be wired or wireless as long as TCP/IP connections can be established. Ways of presenting the actions in some context could be investigated and applied to see whether this would help increase the naturality of the paradigm.
The present setup could be an ideal platform for cognitive neuroscience and cognitive psychology studies that require precise timing and strictly controlled stimuli under pre-defined conditions. This includes studies that employ techniques such as eye-tracking, scalp or intracranial EEG, fNIRS, and even MEG, either with traditional setups or in more mobile setups, which are more feasible today38. Researchers from these fields can customize the external properties of the setup, such as the lighting of the room or the number of actors, as well as the objects to be presented. Another possibility is that researchers could manipulate the display properties of the digital screen to provide a more opaque or transparent display according to the needs of their study. Other possible research areas in which the proposed methodology can be used could be human-robot interaction research, where real-time interactions between humans and robots are needed in realistic scenarios.
In conclusion, given the necessity to move to more naturalistic studies that are more like real-world situations in cognitive neuroscience13,14,15,16,17,18,19,20,21,38, significant technological developments in naturalistic brain-body imaging (e.g. simultaneous use of EEG, motion capture, EMG, and eye-tracking), and the use of deep learning as a fundamental framework for human information processing39,40, we believe that it is the right time to start studying the perception of live actions, as well as its neural underpinnings.
Disclosures
Loading...
$$\rightleftharpoonup{xx}$$
$$\longleftharp{xx}$$,
$$\longrightharp{xx}$$,
The authors declare that they have no relevant or material financial interests related to the research described in this article.
Acknowledgements
Loading...
$$\rightleftharpoonup{xx}$$
$$\longleftharp{xx}$$,
$$\longrightharp{xx}$$,
This work was supported by grants to Burcu A. Urgen from The Scientific and Technological Research Council of Türkiye (Project number: 120K913) and Bilkent University. We thank our pilot participant Sena Er Elmas for bringing the idea of adding background noise between the actor changes, Süleyman Akı for setting up the light circuit, and Tuvana Karaduman for the idea of using a security camera backstage and her contribution as one of the actors in the study.
Materials
| Name | Company | Catalog Number | Comments |
|---|---|---|---|
| Adjustable Height Table | Custom-made | N/A | Width: 60 cm, Height: 62 cm, Depth: 40 cm |
| Ardunio UNO | Smart Projects | A000066 | Microcontroller used for switching the state of the LEDs from the script running on the operator PC |
| Black Pants | No brand | N/A | Relaxed-fit pants of actors with no apparent brand name or logo. |
| Case | Xigmatek | EN43224 | XIGMATEK HELIOS RAINBOW LED USB 3.0 MidT ATX GAMING CASE |
| CPU | AMD | YD1600BBAFBOX | AMD Ryzen 5 1600 Soket AM4 3.2 GHz - 3.6 GHz 16 MB 65 W 12 nm Processor |
| Curtains | Custom-made | N/A | Width: Part 1: 110 cm width from the wall (left) side, Part 2: 123 cm width above OLED display, Part 3: 170 cm from OLED display to right side, Cabin depth: 100 cm, Inside cabin depth: 100 cm, all heights 230 cm except for Part 2 (75 cm height) |
| Experimenter Adjustable/Swivel Chair | No brand | N/A | Any brand |
| Experimenter Table | Custom | N/A | Width: 160 cm, Height: 75 cm, Depth: 80 cm |
| GPU | MSI | GT 1030 2GHD4 LP OC | MSI GEFORCE GT 1030 2GHD4 LP OC 2GB DDR4 64bit NVIDIA GPU |
| Grey-color blackout curtain | Custom-made | N/A | Width: 330 cm, Height: 230 cm, used for covering the background |
| Hard Disk | Kioxia | LTC10Z240GG8 | Kioxia 240 GB Exceria Sata 3.0 SSD (555 MB Read/540 MB Write) |
| Hard Disk | Toshiba | HDWK105UZSVA | Toshiba 2,5'' 500 GB L200 SATA 3.0 8 MB Cache 5400 Rpm 7 mm Harddisk |
| High-Power MOSFET Module | N/A | N/A | Heating Controller MKS MOSFET Module |
| Laptop | Apple | S/N: C02P916ZG3QT | MacBook Pro 11.1 Intel Core i7 (Used as the actor PC) |
| Laptop | Asus | UX410U | Used for monitoring the security camera in real-time. |
| LED lights | No brand | N/A | |
| LED Strip Power Supply | No brand | N/A | AC to DC voltage converter used for supplying DC voltage to the lighting circuit |
| MATLAB | The MathWorks Inc., Natick, MA, USA | Version: R2022a | Used for programming the experiment. Required Toolboxes: MATLAB Support Package for Arduino Hardware (version 22.1.2) Instrument Control Toolbox (version 4.6) Psychtoolbox (version 3) |
| Monitor | Philips | UHB2051005145 | Model ID: 242V8A/00, PHILIPS 23.8" 242V8A 4ms 75 Hz Freesync DP-HDMI+VGA IPS Gaming Monitor |
| Motherboard | MSI | B450M-A PRO MAX | MSI B450M-A PRO MAX Amd B450 Socket AM4 DDR4 3466(OC) M.2 Motherboard |
| Mouse Pad for participant | Monster | 78185721101502042 / 8699266781857 | Pusat Gaming Mouse Pad XL |
| Night lamp | Aukes | ES620-0.5W 6500K-IP 20 | Used for helping the actors see around when the lights are off in the backstage. |
| Participant Adjustable/Swivel Chair | No brand | N/A | |
| Participant Table | IKEA | Sandsberg 294.203.93 | Width: 110 cm, Height: 75 cm, Depth: 67 cm |
| Power Extension Cable | Viko | 9011760Y | 250 V (6 inlets) Black |
| Power Extension Cable | Viko | 9011730Y | 250 V (3 inlets) Black |
| Power Extension Cable | Viko | 9011330Y | 250 V (3 inlets) White |
| Power Extension Cable | s-link | Model No: SPG3-J-10 | AC - 250 V 3 meter (5 inlets) |
| Power Supply | THERMALTAKE | PS-LTP-0550NHSANE-1 | THERMALTAKE LITEPOWER RGB 550W APFC 12 cm FAN PSU |
| Professional Gaming Mouse | Rampage | 8680096 | Model No: SMX-R50 |
| RAM | GSKILL | F4-3000C16S-8GVRB | GSKILL 8GB (1x8GB) RipjawsV Red DDR4 3000 MHz CL16 1.35 V Single Ram |
| Reception bell | No brand | N/A | Used for helping the communication between the experimenter and the actors. |
| Security Camera | Brion Vega | 2-20204210 | Model:BV6000 |
| Speakers | Logitech | P/N: 880-000-405 PID: WD528XM | Used for playing the background music. |
| Survey Software | Qualtrics | N/A | |
| Switching Module | No brand | N/A | F5305S PMOS Switch Module |
| Table under the OLED display | Custom-made | N/A | Width: 123 cm, Height: 75 cm, Depth: 50 cm |
| Transparent OLED Display | Planar | PN: 998-1483-01 S/N:195210075 | A 55-inch transparent display that showcases dynamic information, enabled the opaque and transparent usage during the experiment. |
| UPS | EAG | K200610100087 | EAG 110 |
| UPS | EAG | 210312030507 | EAG 103 |
| USB 2.0 Cable Type A/B for Arduino UNO (Blue) | Smart Projects | M000006 | Used to connect the microcontroller to the experimenter PC. |
| USB to RS232 Converter | s-link | 8680096082559 | Model: SW-U610 |
| White Long-Sleeved Blouse (2) | H&M (cotton) | N/A | Relaxed-fit blouses with a round neckline and without ant apparent brand name or logo. |
| Wireless Keyboard | Logitech | P/N: 820-003488 S/N: 1719CE0856D8 | Model: K360 |
| Wireless Mouse | Logitech | S/N: 2147LZ96BGQ9 | Model: M190 (Used as the response device) |
References
Loading...
$$\rightleftharpoonup{xx}$$
$$\longleftharp{xx}$$,
$$\longrightharp{xx}$$,
- Brain areas active during visual perception of biological motion. Neuron. 35 (6), 1167-1175 (2002).">Grossman, E. D., Blake, R. Brain areas active during visual perception of biological motion. Neuron. 35 (6), 1167-1175 (2002).
- Superior temporal and premotor brain areas necessary for biological motion perception. Brain. 130 (9), 2452-2461 (2007).">Saygin, A. P. Superior temporal and premotor brain areas necessary for biological motion perception. Brain. 130 (9), 2452-2461 (2007).
- The neural basis of visual body perception. Nature Reviews Neuroscience. 8 (8), 636-648 (2007).">Peelen, M. V., Downing, P. E. The neural basis of visual body perception. Nature Reviews Neuroscience. 8 (8), 636-648 (2007).
- ALE meta-analysis of action observation and imitation in the human brain. Neuroimage. 50 (3), 1148-1167 (2010).">Caspers, S., Zilles, K., Laird, A. R., Eickhoff, S. B. ALE meta-analysis of action observation and imitation in the human brain. Neuroimage. 50 (3), 1148-1167 (2010).
- Action observation circuits in the macaque monkey cortex. Journal of Neuroscience. 31 (10), 3743-3756 (2011).">Nelissen, K., et al. Action observation circuits in the macaque monkey cortex. Journal of Neuroscience. 31 (10), 3743-3756 (2011).
- Crossmodal and action-specific: Neuroimaging the human mirror neuron system. Trends in Cognitive Sciences. 17 (7), 311-318 (2013).">Oosterhof, N. N., Tipper, S. P., Downing, P. E. Crossmodal and action-specific: Neuroimaging the human mirror neuron system. Trends in Cognitive Sciences. 17 (7), 311-318 (2013).
- The lateral occipitotemporal cortex in action. Trends in Cognitive Sciences. 19 (5), 268-277 (2015).">Lingnau, A., Downing, P. E. The lateral occipitotemporal cortex in action. Trends in Cognitive Sciences. 19 (5), 268-277 (2015).
- Neural and computational mechanisms of action processing: Interaction between visual and motor representations. Neuron. 88 (1), 167-180 (2015).">Giese, M. A., Rizzolatti, G. Neural and computational mechanisms of action processing: Interaction between visual and motor representations. Neuron. 88 (1), 167-180 (2015).
- The representational space of observed actions. eLife. 8, e47686(2019).">Tucciarelli, R., Wurm, M., Baccolo, E., Lingnau, A. The representational space of observed actions. eLife. 8, e47686(2019).
- Sociality and interaction envelope organize visual action representations. Nature Communications. 11 (1), 3002(2020).">Tarhan, L., Konkle, T. Sociality and interaction envelope organize visual action representations. Nature Communications. 11 (1), 3002(2020).
- Predictive processing account of action perception: Evidence from effective connectivity in the action observation network. Cortex. 128, 132-142 (2020).">Urgen, B. A., Saygin, A. P. Predictive processing account of action perception: Evidence from effective connectivity in the action observation network. Cortex. 128, 132-142 (2020).
- The Oxford Handbook of 4E Cognition. , Oxford University Press. Oxford, UK. (2018).">Newen, A., De Bruin, L., Gallagher, S. The Oxford Handbook of 4E Cognition. , Oxford University Press. Oxford, UK. (2018).
- The treachery of images: How realism influences brain and behavior. Trends in Cognitive Sciences. 25 (6), 506-519 (2021).">Snow, J. C., Culham, J. C. The treachery of images: How realism influences brain and behavior. Trends in Cognitive Sciences. 25 (6), 506-519 (2021).
- Are we ready for real-world neuroscience. Journal of Cognitive Neuroscience. 31 (3), 327-338 (2019).">Matusz, P. J., Dikker, S., Huth, A. G., Perrodin, C. Are we ready for real-world neuroscience. Journal of Cognitive Neuroscience. 31 (3), 327-338 (2019).
- The need for a cognitive neuroscience of naturalistic social cognition. Annals of the New York Academy of Sciences. 1167 (1), 16-30 (2009).">Zaki, J., Ochsner, K. The need for a cognitive neuroscience of naturalistic social cognition. Annals of the New York Academy of Sciences. 1167 (1), 16-30 (2009).
- Future trends in Neuroimaging: Neural processes as expressed within real-life contexts. NeuroImage. 62 (2), 1272-1278 (2012).">Hasson, U., Honey, C. J. Future trends in Neuroimaging: Neural processes as expressed within real-life contexts. NeuroImage. 62 (2), 1272-1278 (2012).
- Social attention with real versus reel stimuli: toward an empirical approach to concerns about ecological validity. Frontiers in Human Neuroscience. 6, 143(2012).">Risko, E. F., Laidlaw, K. E., Freeth, M., Foulsham, T., Kingstone, A. Social attention with real versus reel stimuli: toward an empirical approach to concerns about ecological validity. Frontiers in Human Neuroscience. 6, 143(2012).
- Virtual reality for enhanced ecological validity and experimental control in the clinical, affective and social neurosciences. Frontiers in Human Neuroscience. 9, 660(2015).">Parsons, T. D. Virtual reality for enhanced ecological validity and experimental control in the clinical, affective and social neurosciences. Frontiers in Human Neuroscience. 9, 660(2015).
- Neural correlates of naturalistic social cognition: brain-behavior relationships in healthy adults. Social Cognitive and Affective Neuroscience. 11 (11), 1741-1751 (2016).">Deuse, L., et al. Neural correlates of naturalistic social cognition: brain-behavior relationships in healthy adults. Social Cognitive and Affective Neuroscience. 11 (11), 1741-1751 (2016).
- Differences in behavior and brain activity during hypothetical and real choices. Trends in Cognitive Sciences. 21 (1), 46-56 (2017).">Camerer, C., Mobbs, D. Differences in behavior and brain activity during hypothetical and real choices. Trends in Cognitive Sciences. 21 (1), 46-56 (2017).
- Keep it real: Rethinking the primacy of experimental control in cognitive neuroscience. NeuroImage. 222, 117254(2020).">Nastase, S. A., Goldstein, A., Hasson, U. Keep it real: Rethinking the primacy of experimental control in cognitive neuroscience. NeuroImage. 222, 117254(2020).
- Ecological validity and "ecological validity". Perspectives on Psychological Science. 16 (2), 466-471 (2021).">Kihlstrom, J. F. Ecological validity and "ecological validity". Perspectives on Psychological Science. 16 (2), 466-471 (2021).
- Perception and the Representative Design of Psychological Experiments. , University of California Press. Oakland, California. (1956).">Brunswik, E. Perception and the Representative Design of Psychological Experiments. , University of California Press. Oakland, California. (1956).
- The Handbook of Social Psychology. Gilbert, D. T., Fiske, S. T., Lindzay, G. , McGraw-Hill. New York, NY. 1-79 (1968).">Aronson, E., Carlsmith, J. M. Experimentation in social psychology. The Handbook of Social Psychology. Gilbert, D. T., Fiske, S. T., Lindzay, G. , McGraw-Hill. New York, NY. 1-79 (1968).
- https://www.albany.edu/cpr/brunswik/notes/essay1.html (1998).">Hammond, K. Ecological validity: Then and now. University of Colorado. , Available from: https://www.albany.edu/cpr/brunswik/notes/essay1.html (1998).
- Levels of naturalism in social neuroscience research. IScience. 24 (7), 102702(2021).">Fan, S., Dal Monte, O., Chang, S. W. Levels of naturalism in social neuroscience research. IScience. 24 (7), 102702(2021).
- From observed action identity to social affordances. Trends in Cognitive Sciences. 25 (6), 493-505 (2021).">Orban, G. A., Lanzilotto, M., Bonini, L. From observed action identity to social affordances. Trends in Cognitive Sciences. 25 (6), 493-505 (2021).
- Dimensions of mind perception. Science. 315 (5812), 619(2007).">Gray, H. M., Gray, K., Wegner, D. M. Dimensions of mind perception. Science. 315 (5812), 619(2007).
- Mind the machines: Applying implicit measures of mind perception to social robotics. 2022 17th ACM/IEEE International Conference on Human-Robot Interaction (HRI. , 236-245 (2022).">Li, Z., Terfurth, L., Woller, J. P., Wiese, E. Mind the machines: Applying implicit measures of mind perception to social robotics. 2022 17th ACM/IEEE International Conference on Human-Robot Interaction (HRI. , 236-245 (2022).
- The single category implicit association test as a measure of implicit social cognition. Journal of Personality and Social Psychology. 91 (1), 16(2006).">Karpinski, A., Steinman, R. B. The single category implicit association test as a measure of implicit social cognition. Journal of Personality and Social Psychology. 91 (1), 16(2006).
- Measuring individual differences in implicit cognition: the implicit association test. Journal of Personality and Social Psychology. 74 (6), 1464(1998).">Greenwald, A. G., McGhee, D. E., Schwartz, J. L. Measuring individual differences in implicit cognition: the implicit association test. Journal of Personality and Social Psychology. 74 (6), 1464(1998).
- MouseTracker: Software for studying real-time mental processing using a computer mouse-tracking method. Behavior Research Methods. 42 (1), 226-241 (2010).">Freeman, J. B., Ambady, N. MouseTracker: Software for studying real-time mental processing using a computer mouse-tracking method. Behavior Research Methods. 42 (1), 226-241 (2010).
- Studying mind perception in social robotics implicitly: The need for validation and norming. Proceedings of the 2023 ACM/IEEE International Conference on Human-Robot Interaction. , 202-210 (2023).">Pekçetin, T. N., Barinal, B., Tunç, J., Acarturk, C., Urgen, B. A. Studying mind perception in social robotics implicitly: The need for validation and norming. Proceedings of the 2023 ACM/IEEE International Conference on Human-Robot Interaction. , 202-210 (2023).
- Beyond reaction times: Incorporating mouse-tracking measures into the implicit association test to examine its underlying process. Social Cognition. 30 (3), 289-306 (2012).">Yu, Z., Wang, F., Wang, D., Bastin, M. Beyond reaction times: Incorporating mouse-tracking measures into the implicit association test to examine its underlying process. Social Cognition. 30 (3), 289-306 (2012).
- Methods for presenting real-world objects under controlled laboratory conditions. Journal of Visualized Experiments. (148), e59762(2019).">Romero, C. A., Snow, J. C. Methods for presenting real-world objects under controlled laboratory conditions. Journal of Visualized Experiments. (148), e59762(2019).
- Seeing biological actions in 3 D: An f MRI study. Human Brain Mapping. 37 (1), 203-219 (2016).">Jastorff, J., Abdollahi, R. O., Fasano, F., Orban, G. A. Seeing biological actions in 3 D: An f MRI study. Human Brain Mapping. 37 (1), 203-219 (2016).
- Stereoscopically observing manipulative actions. Cerebral Cortex. 26 (8), 3591-3610 (2016).">Ferri, S., Pauwels, K., Rizzolatti, G., Orban, G. A. Stereoscopically observing manipulative actions. Cerebral Cortex. 26 (8), 3591-3610 (2016).
- Mobile cognition: Imaging the human brain in the 'real world. Nature Reviews Neuroscience. 24 (6), 347-362 (2023).">Stangl, M., Maoz, S. L., Suthana, N. Mobile cognition: Imaging the human brain in the 'real world. Nature Reviews Neuroscience. 24 (6), 347-362 (2023).
- Deep neural networks: a new framework for modeling biological vision and brain information processing. Annual Review of Vision Science. 1, 417-446 (2015).">Kriegeskorte, N. Deep neural networks: a new framework for modeling biological vision and brain information processing. Annual Review of Vision Science. 1, 417-446 (2015).
- Toward an integration of deep learning and neuroscience. Frontiers in Computational Neuroscience. 10, 94(2016).">Marblestone, A. H., Wayne, G., Kording, K. P. Toward an integration of deep learning and neuroscience. Frontiers in Computational Neuroscience. 10, 94(2016).
Reprints and Permissions
Request permission to reuse the text or figures of this JoVE article
Request Permission