Leishmania Translational Extract (LTE) is a eukaryotic cell-free protein expression system derived from the single-celled parasite, Leishmania tarentolae. This optimized protocol makes LTE simple and cost-effective to manufacture. It is suitable for various applications focused on the multiparallel expression and study of complex eukaryotic proteins and their interactions.
A subscription to JoVE is required to view this content. Sign in or start your free trial.
Method Article
Production and Optimization of LTE, a Leishmania tarentolae Derived Cell-Free Protein Expression System for Recombinant Protein Production
In This Article
Summary
Abstract
This protocol outlines the production and optimization of a eukaryotic Cell-Free Protein Expression System (CFPS) derived from the unicellular flagellate Leishmania tarentolae, referred to as Leishmania Translational Extract or LTE. Although this organism originally evolved as a parasite of geckos, it can be cultivated easily and inexpensively in flasks or bioreactors. Unlike Leishmania major, it is non-pathogenic to humans and does not require special laboratory precautions. Another advantage of using Leishmania for CFPS is that the addition of a single antisense oligonucleotide to the CFPS, targeting a conserved splice leader sequence on the 5'-end of all protein-coding RNAs, can suppress endogenous protein expression. We provide procedures for cell disruption and lysate processing, which have been simplified and improved compared to previous versions. These procedures start with simple flask cultures. Additionally, we explain how to introduce genetic information using vectors containing species-independent translation initiation sites (SITS) and how to perform straightforward batch optimization and quality control to ensure consistent protein expression quality.
Introduction
In the 1960s, cell-free protein expression systems played a pivotal role in uncovering the genetic code1. However, prokaryotic cell-free protein expression systems, mainly based on E. coli, currently dominate both laboratory and commercial applications. While E. coli-based systems offer advantages such as cost-effectiveness, scalability, and high expression yields, they face challenges when producing multi-domain proteins in their active forms and facilitating the assembly of protein complexes2,3. In the present day, commonly used forms of eukaryotic Cell-Free Protein Synthesis (CFPS) include wheat germ extract (WGE), rabbit reticulocyte lysate (RRL), and insect cell lysate (ICL)4,5,6. This work introduces an alternative eukaryotic cell-free system that is both straightforward and scalable, based on the unicellular flagellate parasite Leishmania tarentolae.
Leishmania tarentolae can be cultivated easily in flasks using cost-effective media and can also be scaled up in bioreactors to achieve higher cell density. The presence of endogenous mRNAs in cell lysate, which might otherwise compete with introduced messages, can be neutralized using antisense oligonucleotides targeting the conserved Leishmania mRNA splice leader sequence7. Unlike its close relative Leishmania major, which causes human disease, L. tarentolae infects the moorish gecko (Tarentolae mauritanica), making it suitable for cultivation in PC2 laboratory environments without the need for special precautions. It has previously been used as a transgenic organism for in vivo protein expression8.
To facilitate template priming in cell-free systems, universal sequences have been designed based on polymeric RNA structures that enhance translational initiation9. These species-independent translation sequences (SITS) are applicable to both prokaryotic and eukaryotic cell-free systems and are suitable for introducing genetic information into LTE. While this protocol does not provide a detailed explanation of vector construction for LTE cell-free protein expression, optimization and quality control require suitable vectors containing fluorophore fusions of the desired proteins of interest downstream of the SITS site. For this purpose, appropriate LTE vectors have been deposited with the Addgene gene repository, such as the pCellFree_G03 vector, which encodes an N-terminal eGFP fusion to the desired protein of interest using Gateway cloning sites.
LTE has proven its value in a wide range of applications requiring protein expression, including the analysis of protein self-assembly10,16, production of human integral membrane proteins17, research on antiviral drug candidates18, the development of biotechnologically useful enzymes19, prototyping protein biosensors20,21, and the study of biologics from hookworms22. LTE has also been instrumental in mapping Protein-Protein interaction networks in the fields of virology and cellular structures21,32. LTE has been benchmarked to perform similarly to other eukaryotic cell-free systems in expressing full-length, monodispersed, and non-aggregated proteins33, all while offering more cost-effective and scalable production.
This protocol provides techniques for cultivating and disrupting the host organism, preparing lysate, and supplementing a feeding solution (FS) for coupled transcription/translation protein expression. Additionally, it includes a protocol for optimizing production batches. In the initial version of the Leishmania cell-free system, undesired batch-to-batch variation was observed in expression levels, the fraction of full-length proteins, and the presence of protein aggregates, leading to the disposal of batches34. Subsequent protocol improvements were made to address this issue25. The current protocol builds upon these improvements, allowing individual batches to be optimized for peak protein expression and size. It achieves this by closely controlling cell-disrupter loading (measured as optical density at 600 nm; OD600nm) and normalizing the resulting lysate output using absorbance at 280 nm (Abs280nm). Furthermore, it incorporates a method for partially supplementing the lysate with rNTP and magnesium during manufacturing, with subsequent optimization of these feed solution components during test expressions. Although this optimization is presented as an option in the protocol, it is strongly recommended by the authors.
Access restricted. Please log in or start a trial to view this content.
Protocol
This protocol includes detailed media recipes and steps that involve culturing, centrifuging, measuring GFP fluorescence using a multimode platereader, measuring culture OD600nm, and assessing lysate Abs280nm. It also covers the setup and imaging of SDS-PAGE protein gels. The materials required or suggested for this protocol are listed in the Materials spreadsheet. It's important to note that typical laboratory resources such as media components, centrifuges, tubes, spectrophotometers, and gel electrophoresis setups can likely be used interchangeably unless specified otherwise. Figure 1 provides a summary of the LTE manufacturing process.
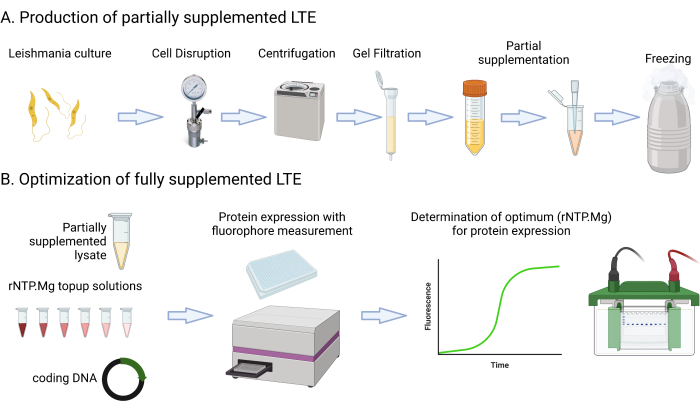
Figure 1: Overview of LTE manufacturing protocol. This cartoon provides a concise summary of the LTE manufacturing protocol. Please click here to view a larger version of this figure.
1. Growth of Leishmania tarentolae cultures
- Prepare at least 3 L of TBGG growth media (Bactotryptone 12 g/L, Yeast extract 24 g/L, glycerol 8 mL/L, glucose 1 g/L, KH2PO4 2.3 g/L, K2HPO4 2.5 g/L, see Table of Materials). Sterilize the media using a 0.22 µm filter under vacuum or a similar setup.
- Store the media at room temperature (RT), with the final additions (Hemin, Antibiotics) added just before inoculation with L. tarentolae. Hemin (0.25% v/v in 50% triethanolamine) is added at 0.2% v/v, Penicillin (10,000 units/mL) plus Streptomycin (10,000 µg/mL) mix at 0.5% v/v.
NOTE: The starting point of this protocol is a maintained 2 x 10 mL culture of wild type L. tarentolae. Maintenance cultures are grown at 27 °C in standard 50 mL tissue culture flasks with low shaking (75 rpm). Such 10 mL cultures can be maintained indefinitely with ~1/20 dilutions in sterile (TBGG + hemin, penicillin, streptomycin) every 2-3 days. A standard biosafety cabinet in a PC2 laboratory is recommended; however, bacterial contaminations tend to be prevented by the added antibiotics, while fungal contaminations are generally outgrown by L. tarentolae. - Over two days, expand the L. tarentolae maintenance cultures to 200 mL (day 1) and then 2 L (day 2) via 1:10 dilutions with an increasing volume of TBGG + hemin/antibiotics each day. Perform both dilutions in autoclave-sterilized baffled 5 L glass flasks (filled to a maximum of 1 L). The second dilution must occur in the afternoon between 3-6 pm, with the intention of starting lysate production the next day between 8-11 am.
NOTE: This protocol uses the minimum starting volume for LTE production (2 x 1 L cultures). It is also possible to expand the culture up to 10 L for LTE production by incorporating an additional expansion step (e.g., Day 1: 100 mL; Day 2: 1 L; Day 3: 10 L). Although this protocol uses baffled flasks (see Table of Materials) to grow L. tarentolae, optionally, conventional bioreactors designed for bacterial growth with Rushton impellers can be used, provided the stirring rate is kept below 100 rpm. Improved aeration and pH control in bioreactors generally extend the log-phase growth of the L. tarentolae cultures, allowing for a higher harvest OD600nm of 10 to be used in step 1.4. - Record the OD600nm of the culture in triplicate via a 1:10 dilution in TBGG directly in the spectrophotometer cuvette. A suitable starting range for making lysate is OD600nm = 4.0-8.0.
- Provide additional incubation time if OD600nm < 4.0. A culture with OD600nm > 8 is usable and will result in a greater volume of cell-free expression lysate, but with lower quality due to the onset of the late-log growth phase. Place culture flasks on ice, awaiting subsequent steps.
NOTE: Accurate measurement of the final culture OD600nm is critical, as it is used to calculate the final volume for concentrated cells prior to disruption. This calculation replaces a pellet weighing method used in earlier versions of LTE manufacture to calibrate cell concentration prior to disruption34, in order to simplify the protocol. Ensure to dilute in TBGG for OD600nm measurement, as otherwise, osmotic shock changes the cell shape, causing measurement error. Pipette mix the 1:10 dilution for OD600nm measurement (directly in the cuvette) seconds before taking the spectrophotometric read, as L. tarentolae cells rapidly settle out with a distinctive cloudy appearance. If the final volume of the expression culture is considered approximate, weighing flasks at harvest (with suitable empty flask tare) to get a better estimated volume (at 1 g = 1 mL) is also recommended. The maximum OD600nm possible from L. tarentolae growth in baffled flasks is 15-20, although this is inappropriate for lysate manufacture due to reaching the stationary phase.
2. Concentration of L. tarentolae cultures
- The Leishmania cells must be washed and concentrated approximately 60x prior to disruption. Calculate the target volume for cell concentration based on OD600nm = 300 for the final concentrate. The equation is V = harvest volume (mL) x (harvest OD600nm/300). For example, using a 2 L culture with a harvest OD600 = 5, the target volume is 33 mL.
NOTE: The OD600nm target of 300 can be modified; previous LTE production has used values in the range of 150-350. Higher concentrations of cells going into disruption will tend to yield final cell-free expression reactions with higher protein yields, but with an increased tendency for vulnerable proteins to aggregate. OD600nm = 300 represents a suitable default target for LTE production. - Transfer the harvested cultures to suitable centrifuge bottles and spin them at 2500 x g for 10 min at 4 °C. Carefully decant the supernatant into the culture waste.
NOTE: It is important to minimize the loss of cells into the discarded supernatant, as it affects the calculation of disruption loading. In previous LTE production protocols, the concentration of L. tarentolae cells for disruption was calibrated by spinning down the cell concentrate in a test microcentrifuge tube and measuring the pellet weight versus the total weight34. This simplified protocol instead uses a theoretical OD600nm target for the concentrate, based on the measured harvest OD600nm, and assumes low cell loss during cell concentration and washing. - Wash the cell pellet in SEB buffer (45 mM HEPES-KOH pH 7.6, 250 mM sucrose, 100 mM KOAc, 3 mM Mg(OAc)2, kept on ice) three times, each time centrifuging at 2500 x g for 10 min at 4 °C. For the first wash, resuspend each 1 L of pelleted culture in 100 mL of SEB buffer, then combine them into a single centrifuge flask. For the second wash, also use 100 mL of SEB for each 1 L of the original culture.
NOTE: For the final pellet resuspension, add SEB buffer to 50% of the final target resuspension volume (step 2.1). This allows the pooled concentrate to be carefully topped up to exactly the final target volume in step 2.4. Each resuspension must be as gentle as possible to avoid premature lysis of L. tarentolae, for example, by gently swirling the added SEB around the decanted pellet or pipetting SEB over the pellet adhering to the centrifuge tube wall. It may be more convenient to transfer supernatants to smaller centrifuge tubes for the final step. - Pour the resuspended concentrate into a suitable washed glass volumetric cylinder, then top up the volume to the target volume (step 2.1) using additional cold SEB and gently mix.
3. Lysis of L. tarentolae concentrate
- Transfer the cell concentrate into the nitrogen cavitation device (see Table of Materials) pre-cooled to 4 °C, pressurize it to 70 bars of nitrogen, and incubate for 45 min on ice.
NOTE: While nitrogen cavitation disrupters are not common laboratory items, they are recommended for LTE production. Alternative methods such as cellular freeze-thaw and French-press type disrupters have been tried; however, protein expression activity was <50% compared to using the nitrogen cavitation method. The nitrogen cavitation device must be thoroughly cleaned before use and between runs, similar to all reused vessels that come into contact with the cell lysate from this step onward (such as the receiver flask). A suitable cleaning regimen involves washing with laboratory detergents followed by thorough rinsing with deionized water. - Open the vent on the nitrogen cavitation device and expel the resulting lysate into a suitably robust container, such as a vacuum receiver flask on ice. Tilt the receiver flask to ensure all of the resulting lysate settles and can be pipetted into a fresh centrifuge tube or a similar vessel.
CAUTION: Nitrogen cavitation disrupters rely on the abrupt transition of the cell concentrate from 70 bars of nitrogen to ambient pressure, achieved through a strong flow of first liquid and then nitrogen through the device's exit valve. Venting must be done with appropriate personal protective equipment (PPE) in a chemical safety hood. There is a risk of breaking the destination vessel and losing the lysate, which is why we use a sturdy vacuum receiver instead of a generic flask. If the device's exit valve is a tube, avoid placing the tube directly inside the receiver to prevent excessive pressure buildup at the venting point.
4. Centrifugation of cell lysate
- Transfer the lysate to suitable g force rated centrifuge tubes and centrifuge at 10,000 x g for 15 min at 4 °C. Remove the supernatant to fresh, similar centrifuge tubes.
- Centrifuge the lysate at 30,000 x g for 15 min at 4 °C, and then remove the final supernatant to a fresh centrifuge tube or a similar container placed on ice. Estimate the total volume.
5. Gel filtration of cell lysate
NOTE: Gel filtration is used to remove sucrose included in the SEB buffer. While sucrose assists in stabilizing cellular machinery during cell disruption, it decreases yield if retained in protein expression reactions.
- Set up a sufficient number of PD-10 gravity-fed gel filtration columns (see Table of Materials) in a rack format that allows them to drip into a collection tray or a similar container beneath, ensuring they can filter the entire lysate volume at 2.5 mL per column. Pre-equilibrate the columns by passing 10 mL of 4 °C EB buffer (45 mM HEPES-KOH pH 7.6, 100 mM KOAc, 3 mM Mg(OAc)2) through them beforehand.
NOTE: All steps from this point benefit from being conducted in a 4 °C cold room. However, it is also suitable to keep all lysates and reagents on a benchtop ice tray. One exception is the gel filtration step, in which the authors place a rack of columns inside a 4 °C fridge while rebuffering. In the original versions of this protocol, new gel filtration columns were 'blocked' by initially buffering the lysate and discarding the first output. Although this is not considered necessary, columns must be flushed with EB buffer and stored at 4 °C between lysate batches. The first output lysate may have lower protein expression activity than subsequent outputs due to some background retention of lysate components on the new column. - Add 2.5 mL of lysate to each column and wait until it passes into the column. Add an additional 0.5 mL of EB to settle the lysate into the column while discarding the eluate.
- Elute the gel-filtered lysate by adding an additional 2.5 mL of EB to each column, collecting the output by placing a fresh, clean tray or another receptacle beneath the columns.
6. Supplementation of cell lysate
- Use the nanodrop spectrophotometer (see Table of Materials) to measure Abs280nm of the gel-filtered lysate. If it exceeds 60, dilute it to reach Abs280nm = 60 using additional 4 °C EB buffer.
NOTE: While controlling cell density input into disruption using OD600nm approximately determines lysate output strength, normalizing the Abs280nm after lysate disruption and processing further improves the batch consistency of lysate performance. Lysate Abs280nm can be adjusted up and down, with consequences for protein expression yield and aggregation (see Discussion section). If the unsupplemented lysate indicates an Abs280nm < 60, it may be necessary to include more Leishmania biomass in the disruption step, i.e., increase the cell disrupter loading to OD600nm > 300 in step 2.1. - Add 5x Feeding Solution (5x FS, Table 1) to the lysate in a 2:5 ratio and vortex mix thoroughly. Aliquot it into suitable containers (e.g., 1.5 mL microfuge tubes), and snap-freeze it in liquid nitrogen. If one is following the optional steps 7.1-7.3 for LTE expression optimization below, use the reduced rNTP.Mg 5x FS from Table 1 instead of the default 5x FS. Include 5 x 100 µL aliquots for freezing for use in the optimization experiments.
NOTE: Freezing with the default 5x FS in a 2:5 ratio creates expression-ready supplemented LTE, used at 7 µL/10 µL expression (hence, the 5x FS becomes 1x FS in the final reaction). However, the authors recommend following the further optional steps where 0.6x the default amount of rNTPs and magnesium is provided in the 5x FS. This is followed by an optimization step where an equimolar mix of the two (referred to as rNTP.Mg) is added to top up test reactions to an optimized value. The partial 5x FS also contains an oligonucleotide that shuts down endogenous mRNA expression (see Introduction section). The sequence of the oligonucleotide is CAATAAAGTACAGAAACTGATACTTATATAGCGTT.
7. QC and optimization of final supplemented LTE
NOTE: The minimum necessary steps to determine the appropriate 'top-up' addition of rNTP.Mg to the reduced rNTP and magnesium-supplemented lysate involve expressing eGFP or a similar fluorophore (e.g., sfGFP) without a fusion partner. Increasing concentrations of rNTP.Mg are added to the reactions to determine the point at which expression level (measured as eGFP RFU via a multimode plate reader) is optimized. Premature terminations of eGFP, which are not fluorescent, become evident by decreasing eGFP RFU at too high rNTP.Mg concentrations. However, short-product malfunctions of LTE occur more frequently in larger expressed proteins (>50 kDa). Hence, it is possible to perform this optimization using a larger template than eGFP, especially if one is available in a suitable expression vector, providing a fluorophore fusion that is desired to be produced by LTE for a particular application or study (see Representative Results section).
- Thaw a 100 µL aliquot and set up six 10 µL expression reactions, each composed of 7 µL partially supplemented lysate from step 6.2, 1 µL of top-up solution as per Table 2, and 2 µL of ultrapure water containing sufficient DNA control template to achieve a final concentration of 50 ng/µL in the reaction.
- Incubate the reactions for 2 h at 25 °C and monitor the increase in GFP fluorescence using a multimode plate reader.
NOTE: Suitable configuration values for GFP are excitation at 485 nm (bandwidth 5 nm), emission at 516 nm (bandwidth 5 nm), with a reading interval of 1 min for 2 h. - Rank the final expression values to determine the rNTP.Mg concentration corresponding to the highest eGFP RFU. If kinetic data is available, an excess of rNTP.Mg will also be indicated by a biphasic increase in eGFP RFU during the 2 h expression period (see Representative Results section).
- Once the optimized top-up rNTP.Mg concentration is determined, add it to all further protein expressions using the batch of LTE that was partially supplemented in the previous steps.
NOTE: If aliquoting in step 6.2 is done carefully with fixed volumes, the top-up can be retrospectively added to each aliquot without thawing, e.g., with the aliquots placed on dry ice. These aliquots are now fully supplemented, as the correct rNTP.Mg top-up will be mixed through each when they are thawed and mixed for use.
Access restricted. Please log in or start a trial to view this content.
Results
The purpose of cell-free protein expression is to produce full-length proteins in a folded, active form suitable for a wide range of applications. LTE (Leishmania tarentolae extract) has previously been compared to other prokaryotic and eukaryotic cell-free expression systems, demonstrating a high capacity to avoid truncation and aggregation when operating optimally, particularly in comparison to E. coli-based cell-free expression33. However, this was previously accompanied by si...
Access restricted. Please log in or start a trial to view this content.
Discussion
Protocols for creating LTE have been published over the past decade7 and have undergone periodic updates25,34. However, newcomers to the technique often encounter a steep learning curve, resulting in delays in achieving high-quality and high-yield protein expression. Similar challenges have been reported by other research groups working with LTE35, particularly concerning significant batch-to-batch variations. The v...
Access restricted. Please log in or start a trial to view this content.
Disclosures
No competing financial interests are present.
Acknowledgements
The authors wish to acknowledge the many Alexandrov lab members who have contributed to the development of the LTE systems over the last 10 years, in particular Sergey Mureev who pioneered the system and developed the SITS ribosome entry site. Figure 1 was created by Biorender.com and reproduced under licence.
Access restricted. Please log in or start a trial to view this content.
Materials
| Name | Company | Catalog Number | Comments |
|---|---|---|---|
| PD-10 SuperDex 25 Columns | Cytiva | 17085101 | Gel filtration columns |
| Nitrogen Cavitation cell disrupter | Parr Industries | 4635 or 4639 | Cell Disrupter |
| Bovine derived Hemin | Sigma-Aldrich | H5533 | Culture additive |
| Penicillin/Streptomycin 10000U/ml | Thermo-Fisher | 15140122 | Antibiotic mix |
| Optiplate 384 | Perkin-Elmer | 6007290 | Multiwell plate for 10ul expressions |
| Oligonucleotide | IDT synthesis | Oligo with sequence CAATAAAGTACAGAAACTGATAC TTATATAGCGTT | |
| Creatine Phosphokinase | Sigma-Aldrich | 9001-15-4 | Enzyme |
| Tecan Spark | Tecan | or similar Multimode Platereader | |
| Chemidoc MP Imager | Biorad | or similar SDS-PAGE gel Imager | |
| 4-12% Bis-Tris Gels | Invitrogen | NW04125 | SDS-PAGE gels |
| Biophotometer | Eppendorf | or similar Cuvette Specrophotometer | |
| Nanodrop One | Thermofisher | Nanodrop spectrophotometer | |
| Avanti JXN-26 centrifuge | Beckman Coulter | or similar centrifuge, with rotors/tubes rated 10K and 50K g | |
| 5424R microcentrifuge | Eppendorf | or similar microcentrifuge, with 1.5ml microcentrifuge tubes | |
| Flask Incubator Inova S44i | Eppendorf | or similar flask incubator shaker suitable for 5L Flasks | |
| 5L glass culture flasks | Baffled glass flasks for culture growth | ||
| Bactotryptone | BD | 211705 | Growth medium |
| Yeast Extract | Merck | VM930053 | Growth medium |
| Glycerol | Any analytical grade | ||
| Glucose | Any analytical grade | ||
| KH2PO4 | Any analytical grade | ||
| K2HPO4 | Any analytical grade | ||
| UltraPure water | Invitrogen | 10977-015 | Or output from any MilliQ-type water dispenser |
References
- Nirenberg, M. W., Matthaei, J. H. The dependence of cell-free protein synthesis in E.coli upon naturally occurring or synthetic polyribonucleotides. Proc Natl Acad Sci USA. 47 (10), 1588-1602 (1961).
- Caschera, F., Noireaux, V. Synthesis of 2.3 mg/ml of protein with an all Escherichia coli cell-free transcription-translation system. Biochimie. 99, 162-168 (2014).
- Kelwick, R., Webb, A. J., MacDonald, J. T., Freemont, P. S. Development of a Bacillus subtilis cell-free transcription-translation system for prototyping regulatory elements. Metab Eng. 38, 370-381 (2016).
- Ezure, T., et al. Cell-free protein synthesis system prepared from insect cells by freeze-thawing. Biotechnol Prog. 22 (6), 1570-1577 (2006).
- Harbers, M. Wheat germ systems for cell-free protein expression. FEBS Letters. 588 (17), 2762-2773 (2014).
- Kobs, G. Selecting the cell-free protein expression system that meets your experimental goals. Promega Corporation. 21, 6-9 (2008).
- Kovtun, O., et al. Leishmania cell-free protein expression system. Methods. 55 (1), 58-64 (2011).
- Basile, G., Peticca, M. Recombinant protein expression in Leishmania tarentolae. Mol Biotechnol. 43 (3), 273-278 (2009).
- Mureev, S., Kovtun, O., Nguyen, U. T., Alexandrov, K. Species-independent translational leaders facilitate cell-free expression. Nat Biotechnol. 27 (8), 747-752 (2009).
- Gambin, Y., et al. Single-molecule fluorescence reveals the oligomerization and folding steps driving the prion-like behavior of ASC. J Mol Biol. 430 (4), 491-508 (2018).
- Sierecki, E., et al. Rapid mapping of interactions between human SNX-BAR proteins measured in vitro by AlphaScreen and single-molecule spectroscopy. Mol Cell Proteomics. 13 (9), 2233-2245 (2014).
- Sierecki, E., et al. Nanomolar oligomerization and selective co-aggregation of alpha-synuclein pathogenic mutants revealed by single-molecule fluorescence. Sci Rep. 6, 37630(2016).
- Leitao, A., Bhumkar, A., Hunter, D. J. B., Gambin, Y., Sierecki, E. Unveiling a selective mechanism for the inhibition of alpha-synuclein aggregation by beta-synuclein. Int J Mol Sci. 19 (2), 334(2018).
- Gambin, Y., et al. Single-molecule analysis reveals self assembly and nanoscale segregation of two distinct cavin subcomplexes on caveolae. Elife. 3, e01434(2013).
- Ve, T., et al. Structural basis of TIR-domain-assembly formation in MAL- and MyD88-dependent TLR4 signaling. Nat Struct Mol Biol. 24 (9), 743-751 (2017).
- Guo, Z., et al. Subunit organisation of in vitro reconstituted HOPS and CORVET multisubunit membrane tethering complexes. PLoS One. 8 (12), e81534(2013).
- Ruehrer, S., Michel, H. Exploiting Leishmania tarentolae cell-free extracts for the synthesis of human solute carriers. Mol Membr Biol. 30 (4), 288-302 (2013).
- Varasteh Moradi, S., et al. Mapping Interactions among cell-free expressed Zika virus proteins. J Proteome Res. 19 (4), 1522-1532 (2020).
- Gagoski, D., et al. Cell-free pipeline for discovery of thermotolerant xylanases and endo-1,4-beta-glucanases. J Biotechnol. 259, 191-198 (2017).
- Ergun Ayva, C., et al. Exploring performance parameters of artificial allosteric protein switches. J Mol Biol. 434 (17), 167678(2022).
- Lau, D., et al. Fluorescence biosensor for real-time interaction dynamics of host proteins with HIV-1 capsid tubes. ACS Appl Mater Interfaces. 11 (38), 34586-34594 (2019).
- Ryan, S. M., et al. Novel antiinflammatory biologics shaped by parasite-host coevolution. Proc Natl Acad Sci USA. 119 (36), e2202795119(2022).
- McMahon, K. A., et al. Identification of intracellular cavin target proteins reveals cavin-PP1alpha interactions regulate apoptosis. Nat Commun. 10 (1), 3279(2019).
- Sierecki, E., et al. A cell-free approach to accelerate the study of protein-protein interactions in vitro. Interface Focus. 3 (5), 20230018(2013).
- Johnston, W. A., Moradi, S. V., Alexandrov, K. Adaption of the Leishmania cell-free expression system to high-throughput analysis of protein interactions. Methods Mol Biol. 2025, 403-421 (2019).
- Jung, W., et al. Cell-free formation and interactome analysis of caveolae. J Cell Biol. 217 (6), 2141-2165 (2018).
- Fontaine, F. R., et al. Functional domain analysis of SOX18 transcription factor using a single-chain variable fragment-based approach. MAbs. 10 (4), 596-606 (2018).
- Overman, J., et al. Pharmacological targeting of the transcription factor SOX18 delays breast cancer in mice. Elife. 6, e21221(2017).
- Kubala, M. H., et al. Mammalian farnesyltransferase alpha subunit regulates vacuolar protein sorting-associated protein 4A (Vps4A)--dependent intracellular trafficking through recycling endosomes. Biochem Biophys Res Commun. 468 (4), 580-586 (2015).
- Han, S. P., et al. Cortactin scaffolds Arp2/3 and WAVE2 at the epithelial zonula adherens. J Biol Chem. 289 (11), 7764-7775 (2014).
- Das Gupta, K., et al. Class IIa histone deacetylases drive toll-like receptor-inducible glycolysis and macrophage inflammatory responses via pyruvate kinase M2. Cell Rep. 30 (8), 2712-2728.e8 (2020).
- Leitão, A. D. G., et al. Selectivity of protein interactions along the aggregation pathway of α-synuclein. BioRxiv. , (2021).
- Gagoski, D., et al. Performance benchmarking of four cell-free protein expression systems. Biotechnol Bioeng. 113 (2), 292-300 (2016).
- Johnston, W. A., Alexandrov, K. Production of eukaryotic cell-free lysate from Leishmania tarentolae. Methods Mol Biol. 1118, 1-15 (2014).
- Hunter, D. J. B., Bhumkar, A., Giles, N., Sierecki, E., Gambin, Y. Unexpected instabilities explain batch-to-batch variability in cell-free protein expression systems. Biotechnol Bioeng. 115 (8), 1904-1914 (2018).
Access restricted. Please log in or start a trial to view this content.
Reprints and Permissions
