CD8 T cell bioenergetics can be interrogated using the Mito Stress Test. This methodology can be used to study acute and chronic metabolic programming. This protocol describes approaches to examine the relationships between T cell receptor biology and bioenergetic analysis.
Method Article
Measuring Mitochondrial Function of Naïve and Effector CD8 T Cells
In This Article
Summary
Abstract
Understanding how immunometabolism impacts the function, differentiation, and fate of lymphocytes has garnered significant interest and attention. Lymphocyte biology has been explored using bioenergetic analysis and has now become a critically import tool in the field. Thus, we sought to optimize a bioenergetic analysis assay that can be adapted with pretreatments and acute injection for receptor stimulations. Here, we evaluated CD8 T cell ex vivo metabolism using the Cell Mito Stress Test to assess rates of oxygen consumption and extracellular acidification in naïve and effector CD8 T cells. Antigen-specific effector CD8 T cells were derived via ex vivo stimulation, and naïve CD8 T cells harvested from splenocytes and isolated with magnetic bead column separation.
Pretreatments are performed in microplates and we detail how to prepare sensor cartridges. We show how injection ports can loaded with drugs to indirectly measure metabolic capacities and with metabolic modulators, this protocol can be used to study specific enzyme activity. T-cell receptor stimulations can be studied in real time with acute injection and stimulation with anti-CD3/CD28 using the injection ports. Instrument analyzers are used for measurements and data collection and data visualization is done with software programs to interpret cellular metabolism. This strategy produces an extensive amount of data on immune cell biology and mitochondrial bioenergetics allowing researchers to customize the protocol in numerous ways to explore CD8 T cell metabolism.
Introduction
The fate and functionality of immune cells are significantly impacted by metabolism, oxidative consumption, and anaerobic respiration1,2,3,4. Recently, there has been growing interest in targeting metabolic modulation as a strategy to re-program or revigorate CD8 T cell fate and effector function and improve viral clearance or enhance endogenous anti-tumor immunity5,6,7,8,9. Notably, antigen receptor signaling through the T cell receptor (TCR) is a key requirement for CD8 T cell differentiation resulting in downstream signaling and activation10,11,12 (Figure 1). Prolonged exposure to immunological insults causes persistent antigen-specific stimulation on the TCR eventually leading to chronically inflamed states, T cell fatigue, a remodeling of the immune microenvironment, and immune escape11,13,14,15,16,17,18,19.
The metabolism of exhausted CD8 T cells is fundamentally distinct from that of functional effector CD8 T cells2,3,14,15,18,20. T cell differentiation, interferon γ (IFNγ) secretion, and recall capacity are, in part, determined by mitochondrial function and β-oxidation break-down products. IFNγ+ CD8 T cells are critical components of both anti-tumor and anti-viral immune responses21,22,23. Specific metabolic flux via glycolysis and the electron transport chain is important for CD8 T cell activation, cytokine secretion, and memory responses4,11,13,15,18,24,25,26,27,28. Optimal responses, including T cell activation and effector differentiation, require a coordinated and specific mitochondrial response, while mitochondrial defects and excessive reactive oxygen species (ROS) characterize exhausted or dysfunctional T cells9,29. Recently, persistent TCR stimulation of CD8 T cells in vitro promotes CD8 T cell exhaustive differentiation in part by inducing oxidative stress and reprogramming oxidative metabolism and metabolic capacities required for T cell proliferation1,2,13,20,24,29. Altogether, metabolic control axes are critical components in directing CD8 T cell differentiation and their progression to effector, memory, or exhausted/dysfunctional phenotypes.
Metabolic compounds also direct immune cell responses by functioning as autocrine or paracrine signaling molecules9,30,31,32,33,34,35. Sphingosine-1-phosphate (S1P) and lysophosphatidic acid (LPA) are bioactive and inflammatory lipids that signal via G-protein coupled receptors (GPCRs) to modulate lymphocyte egress and cytotoxicity by CD8 T cells36. LPA signaling via GPCR LPA receptors on CD8 T cells reprograms metabolism to increase lipolysis, fatty acid oxidation, and proton leak9. Altogether, the bioenergetics and metabolism of CD8 T cells are largely driven by substrate availability, environmental cues, and energetic requirements.
Methodologies to interrogate CD8 T cell metabolism have become ever more important. The Cell Mito Stress Test provides a comprehensive evaluation of bioenergetics and is now recognized as a hallmark technique in the field of immunometabolism and CD8 T cell energetics9,37. Adherent cells were historically used for the Mito Stress Test assay38; however, there is increasing interest in applying this protocol for cells grown in suspension and specifically using immune cells for the Cell Mito Stress Test assay. Here, we present a detailed protocol to measure the metabolic activity of CD8 T cells based on our recent publication9. We provide a detailed explanation of the expansion of CD8 T cells, naïve CD8 T cell isolation, assay preparation, and treatment with protocols for both pretreatments and acute injections in the Cell Mito Stress Test assay. Importantly, we compare and contrast multiple methods for TCR stimulation and CD8 T cell activation, including polyclonal and antigen-specific TCR stimulation.
This protocol details antigen-specific stimulation using OT-I transgenic mice (a classical transgenic mouse model) for which all mouse T cells express the same Vα2 and Vβ5 genes39. The OT-I mouse CD8 T cells all harbor the same TCR that is specific against ovalbumin octapeptide (OVA257-264 also written as the amino acid sequence SIINFEKL or N4 a widely studied epitope that, upon presentation by major histocompatibility complex (MHC) class I, activates cytotoxic CD8 T cells39 (Figure 1A). Overall, the OT-I transgenic mouse model is widely used by immunologists to study TCR signaling and antigen-specific T cell effector function. As opposed to monoclonal activation with the OT-I mouse model, polyclonal CD8 T cells may be generated with anti-CD3/CD28 antibodies against TCR CD3 subunits and CD28 co-stimulatory molecule40 (Figure 1B). Anti-CD3/CD28 antibodies bypass the antigen-specific component of TCR signaling to activate a polyclonal population of T cells40. Ultimately, the results described in this report compare multiple methods for using the Cell Mito Stress Test to quantify dynamic metabolic flux in CD8 T cells.
Protocol
Mice were kept in a pathogen-free environment and maintained according to the Institutional Animal Care and Use Committee standards and regulations.
1. Generation and expansion of CD8 T cells via antigen-specific stimulation
- On the first day, harvest splenocytes derived from OT-I mice; then, prepare and activate them in vitro with the SIINFEKL (4) peptide.
- Clean the hood space, prepare reagents, and gather the mouse medium. Warm the mouse media in a water or bead incubator.
- In a 6-well plate, put 7 mL of mouse medium into one well and then another 3 mL of mouse medium into a different well. Afterward, insert a strainer into the well containing 7 mL of media.
- Bring a mouse into the laboratory from the vivarium in a transfer cage. Transfer the mouse to an empty new cage and and position the CO2 adaptor on the top. Euthanize the mouse with CO2 up to a flow level of 2.75.
- Carefully watch the mouse and observe for any signs of distress. After the last breath, watch for signs of breathing and life for at least 1 min. Turn off the CO2 and perform cervical dislocation as the secondary method of euthanasia. Then, clean the benchtop, cage, and rest of the work area and carry the mouse to the dissection hood.
- Dissect the spleen out of the mouse.
- Use 70% ethanol to sterilize the dissection equipment and placing the mouse left side down, spray the left side of the mouse to disinfect.
- Using clean instruments, dissect to remove the skin and identify the peritoneum. Make a small incision through the peritoneum to find the spleen and then excise the spleen. Put the spleen in the 6-well plate on top of the strainer.
- Clean the area, put the mouse carcass in a disposal bag, and then place the bag in a freezer for disposal.
- Ensure the entire area is clean and move the 6-well plate into the tissue culture hood for the next steps.
- In the tissue culture hood, homogenize the spleen and resuspend the cells into a single-cell suspension without clumps.
- Push the spleen through the strainer into the well with 7 mL of media with the plunger of a 5 mL syringe.
- Rinse the strainer and any residual tissue using 3 mL of medium in the additional well.
- Transfer the cell suspension with a serological pipet into a new 10 mL conical tube.
- Centrifuge for 5 min at 500 × g and aspirate the supernatant using a glass pipet.
- Lyse red blood cells.
- Begin the process for a red blood cell lysis using 1 mL of ACK lysis buffer by resuspending the cells in ACK lysis buffer and incubating at room temperature for 1-5 min.
NOTE: Incubation time should be optimized to the specific batch of ACK lysis buffer to achieve maximum red cell lysis with minimum splenocyte death. - Add 10 mL of medium to the conical tube for neutralization and centrifuge for 5 min at 500 × g.
- Resuspend the cells in 50 mL of medium and transfer them to a T75 flask.
- Begin the process for a red blood cell lysis using 1 mL of ACK lysis buffer by resuspending the cells in ACK lysis buffer and incubating at room temperature for 1-5 min.
- Stimulate the cells with SIINFEKL (N4) peptide.
- Bring the SIINFEKL peptide into the tissue culture hood. Store the SIINFEKL peptide at -20 °C.
- Add SIINFEKL directly to the media to achieve a final concentration of 2 µg/mL. Add 50 µL of SIINFEKL (2 mg/mL) to 50 mL of medium to achieve a final concentration of 2 µg/mL.
- Incubate the cells at 37 °C for 72 h.
- Sanitize the tissue culture hood using 70% ethanol.
- Clean the hood space, prepare reagents, and gather the mouse medium. Warm the mouse media in a water or bead incubator.
- On the fourth day, wash the cells to remove the peptide. Using freshly prepared media supplemented with IL-2, resuspend cells and then return the flask to the incubator.
- Collect the cells from the T75 tissue culture flask in a 50 mL conical tube. Centrifuge and pellet OT-I CD8 T cells and then remove any excess media with aspiration. Add 50 mL of new mouse media containing 1,000 U/mL of IL-2 and transfer resuspend the cells to a new T75 flask.
- For storage, keep aliquots of the IL-2 stock in a freezer at -80 °C. Storage at -80 °C will minimize peptide degradation.
- Prepare expanded antigen-specific cytotoxic CD8 T cells for the mitochondrial function assay
- On the seventh day, the mitochondrial function assay is performed. Prepare the antigen-specific OT-I CD8 T cell for the assay.
- Collect live CD8 T cells.
- Transfer the cells from the T-75 tissue culture flask into a new 50 mL conical tube. Then, centrifuge the conical tube for 5 min at 500 × g.
- In a new 50 mL conical tube, pipet 20 mL of a density gradient medium (density = 1.077 g/mL) while the cells are spinning.
- Once the centrifugation is complete, take the conical tube and using 10 mL of medium, resuspend the cells. Then, pipetting very slowly, layer the resuspended cells on top of the density gradient. Without disturbing the gradient, centrifuge the conical tube at 1,300 × g for 20 min at room temperature with the setting set to maximum acceleration and minimum deceleration with no brake.
- When the centrifugation is complete, use a P1000 pipet to gather the middle layer of T cells. Visualize the cellular layer and ensure the pipet remains above and does not disturb the layer. Transfer collected cells into a fresh 50 mL conical tube containing 30 mL of complete mouse medium. Then, centrifuge the 50 mL conical tube at 500 × g for 5 min. When the centrifugation completes, aspirate the excess supernatant from the OT-I CD8 T cells. With 20 mL of fresh mouse medium, resuspend the cells.
- Using a hemocytometer, count the total number of viable cells. Stain a small aliquot of cells with trypan blue in a 1:4 dilution to identify dead cells.
NOTE: Approximately 40-60 × 106 cells can be expected from one OT-I mouse. - With an additional centrifugation step, wash the remaining cells with an additional 20 mL of fresh mouse medium. Then using a microplate, pipet cells 200,000 cells/well in complete mouse medium.
2. Generation and expansion of poly-specific CD8 T cells via anti-CD3/anti-CD28 stimulation
- On Day 0, coat a 24-well plate in CD3. Add 1 mL of anti-CD3-biotin at a concentration of 5 µg/mL, diluted in PBS, to each well of a 24-well plate. Place the plate in a humidified, 5% CO2 incubator overnight.
- The next day, harvest a mouse and collect splenocytes. Activate splenocytes in vitro with anti-CD3/anti-CD28 by following steps 1.1.1-1.1.5.3.
- Using the magnetic bead separation protocol, isolate CD8 T cells.
NOTE: Ensure that cells are kept cold. Under pre-cooled conditions, work quickly.- Using 40 µL of MACS buffer resuspend the cells with 10,000,000 cells per 40 µL of MACS buffer. To the solution, thoroughly mix 10 µL of biotin antibody cocktail into the cell solution and then incubate for 5 min at 4 °C.
- While waiting for the cell to incubate in the refrigerator, prepare a column for positive selection. Use 3 mL of buffer to wash the column and then discard the waste flowthrough.
- After 5 min, collect the cell-antibody solution from the refrigerator and add 30 µL of MACS buffer per 10,000,000 cells, 20 µL of anti-biotin, and then incubate at 4 °C for an additional 10 minutes.
- Prepare a new collection tube under a positive selection column using a fresh 15 mL conical tube. Once the 10 min incubation is complete, transfer the cell suspension to the positive selection column. In a fresh 15 mL conical tube, collect the flowthrough. Using 3 mL of MACS buffer, wash the column to collect residual cells.
NOTE: Ensure that the cell suspension is in a minimum volume of 0.5 mL. - Replate the positively selected CD8 T cells in the 24-well plate for anti-CD3/anti-CD28 stimulation.
- Centrifuge the flowthrough at 500 × g for 5 min at 4 °C. Aspirate the excess supernatant and pipet the cells to resuspend them in solution. Using a hemacytometer and trypan blue, count the cells.
NOTE: Please expect ~8-10 × 106 live cells to be counted per mouse spleen. - After counting the cells, resuspend the CD8 T cells at 500,000 cells per mL. Then, carefully aspirate 1 mL of PBS from the 24-well plate, replate the counted cells in the 24-well plate, and add 106 cells per well.
- To stimulate the cells, pipet anti-CD28 into the 24-well plate so that the final concentration of anti-CD28 is 2 µg/mL. To mix the cells, carefully tap the plate. Keep the cells at 37 °C for the next 72 h.
- Centrifuge the flowthrough at 500 × g for 5 min at 4 °C. Aspirate the excess supernatant and pipet the cells to resuspend them in solution. Using a hemacytometer and trypan blue, count the cells.
- Using 70% ethanol, clean the tissue culture hood.
- On Day 4 (72 h later), remove the cells from the anti-CD3/anti-CD28 stimulation. Wash the cells by centrifuging polyclonal CD8 T cells. Remove the excess supernatant by aspiration and then resuspend the cells with fresh mouse medium with 1,000 units/mL of IL-2 with 10 mL of media. Transfer the resuspended cells into a new 6-well plate and place it in the incubator.
NOTE: 1.2.2. For storage, aliquots of the IL-2 stock can be stored in a freezer at -80 °C. Storage at -80 °C will minimize peptide degradation. - Prepare the expanded polyclonal effector CD8 T cells for the mitochondrial function assay.
- On the seventh day, ready and process the polyclonal CD8 T cells for the assay.
- Collect live CD8 T cells.
- Transfer the cells from the 6-well plate to a clean conical tube using a pipette, then centrifuge the cells for 5 min at 500 × g.
- Follow steps 1.3.3.2-1.3.4.
NOTE: Approximately 10-30 million live CD8 T cells can be expected from a single C57BL/6 mouse. - Save an aliquot of cells for flow cytometry to assess CD8 purity. For flow cytometry, stain the cells on ice for 20 min with a viability dye of choice9.
3. Harvest Naïve CD8 T cells
- On the seventh day, harvest splenocytes from a mouse by following steps 1.1.1-1.1.5.3.
- Carry out CD8 T cell isolation using the magnetic bead-based protocol described in steps 2.3-2.3.5.1.
- Plate CD8 T cells in the microplate at 200,000 cells/per well in complete medium.
4. Perform the mitochondrial function assay
- Prepare materials the day before running the mitochondrial function assay.
- Hydrate the sensor cartridge.
- Pipet 200 µL of distilled water into each well of the utility plate. Place the sensor cartridge on top of the utility plate. Check that the ends of the sensor cartridge are submerged to ensure proper hydration. Put both the sensor cartridge and utility plate in a non-CO2 incubator at 37 °C for a minimum of 10 h.
- Prepare a 50 mL conical tube with 50 mL of Calbrant and place it in a non-CO2 incubator and incubate overnight.
- The day before the assay, prepare the complete fresh medium in preparation for the assay. In a total of 50 mL prepare a solution of 1 mM pyruvate, 2 mM glutamine, and 10 mM glucose in assay medium.
- Hydrate the sensor cartridge.
- Perform the mitochondrial function assay on the next day.
- Remove distilled water from the utility plate by flicking it off. Rehydrate with 200 µL of Calibrant. Use the Calibrant that was stored in the non-CO2 incubator overnight. After replacing the sensor cartridge on top of the utility plate. Put the utility plate with the sensor cartridge back in the non-CO2 incubator.
NOTE: To flick the plate, rapidly and swiftly invert the plate in one fluid motion over the sink so that the distilled water quickly falls out of the plate.
- Remove distilled water from the utility plate by flicking it off. Rehydrate with 200 µL of Calibrant. Use the Calibrant that was stored in the non-CO2 incubator overnight. After replacing the sensor cartridge on top of the utility plate. Put the utility plate with the sensor cartridge back in the non-CO2 incubator.
- Prepare CD8 T cells as described above in sections 1-3.
- Using a multichannel pipet, plate 200,000 cells per well by resuspending 10 × 106 cells in 4.5 mL of complete medium and plating 90 µL per well. Then, add another 90 µL of designated media per well during the pretreatment.
NOTE: If there are no pretreatments, plate the cells in 180 µL per well with a final concentration of 200,000 cells per well. From this point forward in the protocol, keep the plate at ambient room temperature or in the non-CO2 incubator. The plate should not be placed in a 5% CO2 incubator. Note that the microplate's final volume will be 180 µL.
- Using a multichannel pipet, plate 200,000 cells per well by resuspending 10 × 106 cells in 4.5 mL of complete medium and plating 90 µL per well. Then, add another 90 µL of designated media per well during the pretreatment.
- Prepare pretreatments (including lipid or another metabolite supplementation).
- Prepare lipid pretreatment by spinning down lyophilized lipid from the freezer using a quick spin mini centrifuge. Determine the desired concentrations for pretreatment and prepare the lipid pretreatment to these concentrations. Sonicate the diluted lipid for 30 min immediately prior to use.
- Prepare lipid cocktails.
- Determine the desired lipid concentration to be used in the mitochondrial function assay.
- Prepare the lipids at a concentration that is 2x the desired concentration. Then, add the lipid solution to the existing volume in the microplate to achieve a 1:2 dilution. Complete this by adding 90 µL of the lipid solution directly to the preexisting 90 µL. The final volume will be 180 µL (1:2 dilution) per well.
NOTE: Table 1 details an example diagram of a possible plate setup and design. We suggest conducting the assay with 5-6 technical replicates, incorporating both naïve and antigen-specific effector CD8 T cells with and without lipid additives. Notably, this protocol is designed to avoid centrifugation to minimize cellular disruption. Since the mitochondrial function assay is highly sensitive to cell numbers, reducing cell loss is critical. Instead of centrifugation, cells are handled by flicking to preserve their integrity. - Pipet 180 µL of complete medium into each corner of the plate. Place the microplate with CD8 T cells into a non-CO2 incubator.
NOTE: The incubation time will vary depending on the desired length of pretreatment. To minimize cell death, we recommended a maximum of 4 h pretreatments for CD8 T cells. Overextending pretreatment time may cause excessive cell death, affecting the accuracy of the results.
- Prepare poisons and solutions for acute injections.
- Using stock solutions, prepare a diluted form of oligomycin. Create a dilution of oligomycin in 3 mL of complete medium. In 15 mL conical tubes, cautiously prepare poisons and acute injections. Since the poisons are light-sensitive, prepare these solutions using tubes wrapped in tin foil to protect from light exposure.
- In one 15 mL conical tube wrapped in tin foil, dilute oligomycin in 3 mL of complete medium so that the final concentration is 2.5 µM post injection.
- In a second 15 mL conical tube wrapped in tin foil, dilute FCCP in 3 mL of complete medium so that the final concentration is 2.0 µM post injection.
- In a third 15 mL conical tube wrapped in tin foil, create solutions of rotenone and antimycin A in 3 mL of complete medium to achieve concentrations of 0.5 µM for both toxins after injection.
- If the assay is being performed with additional metabolic modulators, drugs, or stimulations, dilute these agents in complete medium. If planning to use etomoxir or other metabolic modulators and drugs, first perform an assay to test the titration curve and determine the optimal concentration for use. If conducting a TCR stimulation via acute injection, the assay can be performed using either anti-CD3/anti-CD28 magnetic beads or a combination of plate-bound anti-CD3-biotin with anti-CD28 streptavidin.
NOTE: For additional descriptions, refer to section 5 which describes the protocol for TCR stimulation with acute anti-CD3/CD28 injection.
- Remove the sensor cartridge from the non-CO2 incubator. Using the plate adaptors, pipet the poisons into the sensor cartridge. Place the plate adaptors so that each chamber can be specially loaded with poisons or other acute injections.
NOTE: Use caution when pipetting the poisons.- Load poisons into the ports of the sensor cartridge. If no additional injections are being performed, ports A-C will be loaded with poisons. Pipet 20 µL of oligomycin into port A, 22 µL of FCCP into port B, 25 µL of rotenone into port C, and 25 µL of antimycin A into port C.
- Using stock solutions, prepare a diluted form of oligomycin. Create a dilution of oligomycin in 3 mL of complete medium. In 15 mL conical tubes, cautiously prepare poisons and acute injections. Since the poisons are light-sensitive, prepare these solutions using tubes wrapped in tin foil to protect from light exposure.
- One hour prior to starting the assay on the instrument, put the microplate in the non-CO2 incubator.
- Prior to starting the instrument, open the software and calibrate the instrument. Perform this task 30 min prior to loading the microplate into the instrument to ensure ample time for calibration.
- On the software system, label the wells and review the injection scheme.
- During calibration, load the sensor cartridge into the instrument. The software will prompt you to complete the initialization and quality check. The calibration will assess pH and O2 on each well which will either pass or fail. The instrument will report the results on the screen with a check mark or an 'X'.
5. Perform a modified version of the mitochondrial function assay with TCR stimulation in a separate experiment with an acute anti-CD3/CD28 injection
NOTE: The mitochondrial function assay can be performed with an acute TCR simulation via two different approaches by either 1) using biotinylated anti-CD3 + anti-CD28 + streptavidin described in step 5.2 or 2) anti-CD3/CD28 magnetic beads described in step 5.3 These separate experiments both function to stimulate the TCR via an acute injection during the assay.
- If performing additional injections, prepare the assay as described in the prior section 4. Modify the injection schemes using the additional chamber for the injection. In this protocol, anti-CD3/anti-CD28 are loaded into port A of the sensor cartridge. Then, load the other ports similarly, with oligomycin into port B, FCCP into port C, and rotenone and antimycin A into port D.
- Prepare and load biotinylated anti-CD3 + anti-CD28 + streptavidin components.
- Pipet 20 µL of biotinylated anti-CD3 at 10 µg/mL into the designated wells in the sensor cartridge.
- Pipet 20 µL of anti-CD28 at 2 µg/mL + streptavidin at 20 µg/mL into the designated wells in the sensor cartridge.
- Pipet 20 µL of biotinylated anti-CD3 at 10 µg/mL + anti-CD28 at 2 µg/mL + streptavidin at 20 µg/mL into the designated wells in the sensor cartridge.
- Ensure that the control wells are prepared. Ensure there are designated wells injected with media only, biotinylated anti-CD3 alone, anti-CD28 + streptavidin, and biotinylated anti-CD3 + anti-CD28 + streptavidin.
- Using a 1:1 bead-to-cell ratio, prepare and load anti-CD3/CD28 magnetic beads.
- In a plate with 200,000 cells per well, pipet 5 µL of magnetic beads to the designated wells in the sensor cartridge.
- Prepare the designated control wells with media only for injection.
- Adjust the volume of the poisons so that the final post-injection concentrations post are: 2.5 µM for oligomycin, 2.0 µM for FCCP, and 0.5 µM for rotenone and antimycin A.
- Ensure that the injection scheme is modified to reflect the updated time points prior to loading the microplate on the instrument.
- Program the software to run the acute TCR stimulation for a total of 140 min. Within this timeframe, modify the scheme so that there are x10 time point measurements prior to oligomycin injection.
Results
The glycolytic and oxidative metabolic capacities can be measured using a mitochondrial functional assay which evaluates capacities by targeting components of the electron transport chain at particular time points (Figure 2A). Different injection schemes can be loaded onto the sensor cartridge ports to modify the traditional assay and assess acute TCR stimulation (Figure 2B,C). Cell number and drug concentration for various cell types should be optimized prior to interpreting results. Here, this report describes conditions that have been optimized for CD8 T cells (Figure 3A,B) with inhibitors of the electron transport chain optimized to measure capacities in both naïve and effector cells (Figure 4A,B). Importantly, this assay can be modified to study TCR stimulation on effector CD8 T cells generated from antigen-specific stimulation or anti-CD3/CD28 stimulation. We further examine CD8 T cell response to bioactive lipid signaling, especially with, lysophosphatidic acid or LPA. We determined that metabolic trends in response to LPA signaling (at either 30 min, 2 h, or 4 h prior to loading the microplate into the analyzer instrument) were similar in both CD8 T cells activated with either antigen-specific or polyclonal TCR stimulation (Figure 5A-D). The type of TCR stimulation and mechanism of activation did result in subtle differences wherein metabolically energetic cells were initially generated with antigen-specific activation (Figure 5E-L).
Acute injection of anti-CD3/CD28 onto effector CD8 T cells can acutely stimulate the TCR with real-time measurements. Biotinylated anti-CD3, anti-CD28, and streptavidin can be used in aggregate to stimulate the TCR in an acute injection model. As a separate method, acute injections can be performed with magnetic beads conjugated to anti-CD3 and anti-CD28 in this bioenergetic assay to stimulate TCR in real time. We adapted the model to inject either media, biotinylated anti-CD3, anti-CD28 + streptavidin, or an aggregate of biotinylated anti-CD3 + anti-CD28 + streptavidin onto effector OT-I CD8 T cells in mid-time during the assay (Figure 6A,B). We observed stimulation with anti-CD3/CD28, which resulted in an increase in both OCR and ECAR. The OCR and ECAR signals were also elevated, but not to the same level as anti-CD3/CD28, with biotinylated anti-CD3 signal alone. Importantly, we find similar metabolic trends that are comparable to anti-CD3/CD28 magnetic bead acute injection (Figure 6C-F). In sum, these results show with multiple approaches and methodologies that the mitochondrial function assay is robust and reproducible for studying lymphocyte immunometabolism and specifically, CD8 T cells.
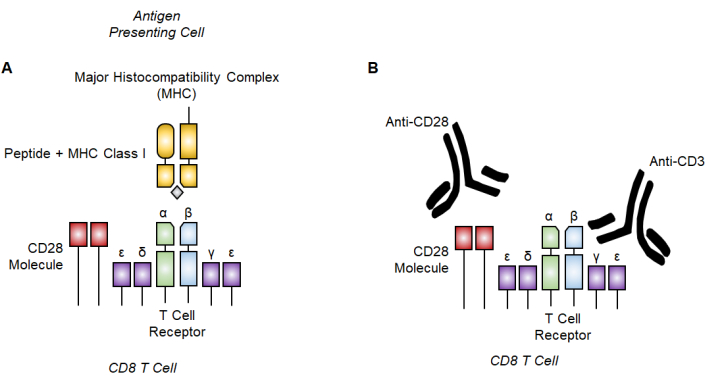
Figure 1: T cell receptor activation with antigen-specific and polyclonal stimulation. (A) Schematic of antigen-specific signaling with major histocompatibility complex (MHC) class I with peptide bound to the T cell receptor. (B) Depiction of CD8 T cell polyclonal activation by binding the CD3 subunits and the CD28 costimulatory molecule with anti-CD3/28 antibodies. Please click here to view a larger version of this figure.

Figure 2: Drug targeting of the electron transport chain in the mitochondrial function assay. (A) Schematic of electron transport chain inhibitors (red) used here. (B,C) For the mitochondrial function test, injection strategies on the sensor cartridge are as follows: (B) traditional injection approach where oligomycin is loaded into port A, FCCP into port B, and rotenone and antimycin A into port C. (C) The acute injection method involves placing acute injection (anti-CD3/CD28) in port A, oligomycin in port B, FCCP in port C, and rotenone and antimycin A in port D. Abbreviation: FCCP = 4-(trifluoromethoxy) phenyl) carbonohydrazonoyl dicyanide. Please click here to view a larger version of this figure.
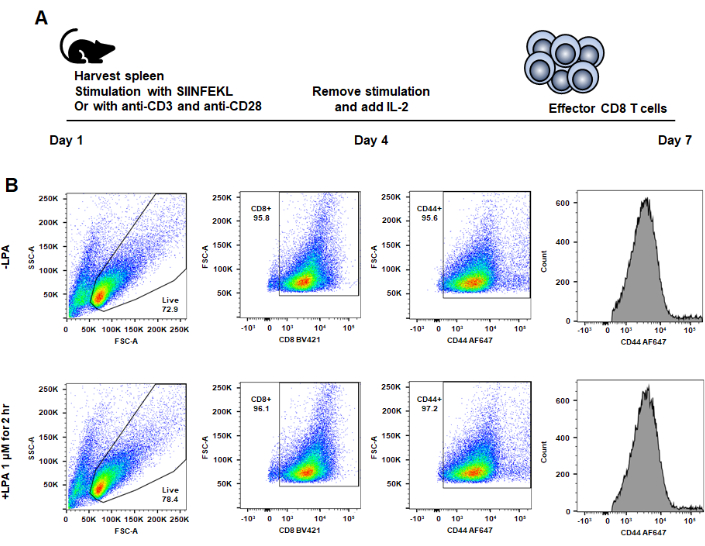
Figure 3: Surface expression of CD8 and CD44, viability, and metabolic differences in CD8 T cells generated from anti-CD3 and anti-CD28 stimulation after LPA treatment. (A) Effector CD8 T cells are generated ex vivo by stimulating mouse-derived CD8 T cells with SIINFEKL (N4) and splenocytes as antigen-presenting cells or anti-CD3 and anti-CD28 on plates. On Day 4, IL-2 replaces the initial stimuli, supporting differentiation and proliferation. Homogenous Day 7 effector CD8 T cells are then analyzed via flow cytometry after in vitro culture. (B) T cells are identified by gating on lymphocyte status and then CD8+/CD44+ expression. A representative image shows CD8 and CD44 is unaffect with LPA treatment. This figure was modified from Turner et al.9. Please click here to view a larger version of this figure.
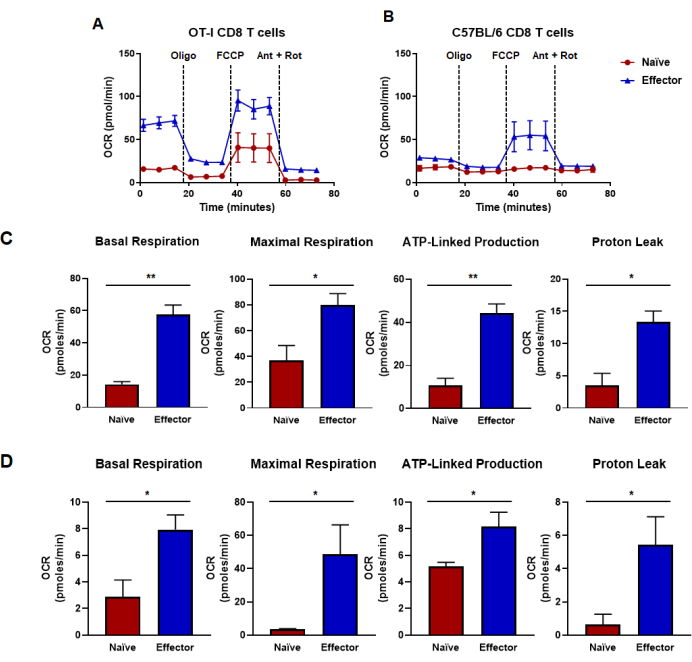
Figure 4: Oxidative capacities determined from oxygen consumption rate. (A,B) Oxygen consumption rates for naïve and effector CD8 T cells generated by (A) OT-I CD8 T cell antigen-specific stimulation and expansion or (B) anti-CD3/CD28 polyclonal stimulation and expansion of CD8 T cells from wild-type C57B/6 mice. Oligomycin, FCCP, antimycin A, and rotenone were injected at intervals of 18 min with 25 mM glucose media. Results are shown as representative data and were obtained using n = 6 technical replicates. (C,D) Capacity metrics derived from metabolic flux assays performed in panels (A,B) and display calculated basal respiration, maximal respiration, ATP-linked production, and proton leak. (C) Metabolic capacities were determined from OT-I CD8 T cells and correspond to data shown in panel (A). (D) Metabolic capacities determined from C57BL/6 CD8 T cells and correspond to data shown in panel (B). Unpaired Student's t-test analysis was done for the entire figure where *p < 0.05, **p < 0.005, ***p < 0.0005, and ****p < 0.0001. Abbreviations: OCR = Oxygen consumption rate; Oligo = oligomycin; FCCP = 4-(trifluoromethoxy) phenyl) carbonohydrazonoyl dicyanide; ant = antimycin A; rot = rotenone. Please click here to view a larger version of this figure.
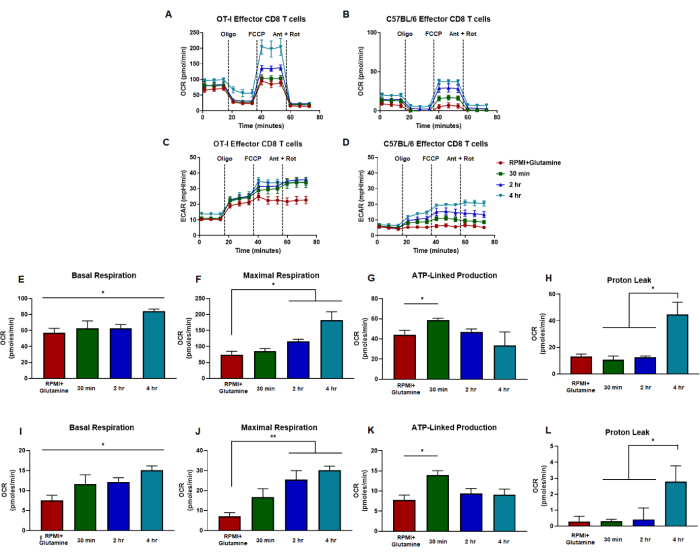
Figure 5: Similar trends in effector CD8 T cell responses to LPA receptor signaling independent of antigen-specific or polyclonal activation. (A,B) CD8 T cell oxygen consumption rate is measured from cells generated by (A) OT-I CD8 T cell antigen-specific stimulation and expansion or (B) anti-CD3/CD28 polyclonal stimulation and expansion of CD8 T cells from wild-type C57B/6 mice. (C,D) Effector CD8 T cell extracellular acidification rate measurements are shown for cells generated by (C) OT-I CD8 T cell antigen-specific stimulation and expansion or (D) anti-CD3/CD28 polyclonal stimulation and expansion of CD8 T cells from wild-type C57B/6 mice. Metabolic capacities of CD8 T cells were measured in media supplemented with glutamine (red) or 1 µM LPA for 30 min (green), 2 h (blue), or 4 h (green). Oligomycin, FCCP, antimycin A, and rotenone were injected at intervals of 18 min with 25 mM glucose media. Results are shown as representative data and were obtained using n = 6 technical replicates. (E-H) Capacity metrics derived from metabolic flux assays performed in panels (A,C) and display calculated basal respiration, maximal respiration, ATP-linked production, and proton leak. (I-L) Capacity calculations from panels (B,D) showing basal respiration, maximal respiration, ATP-linked production, and proton leak. The entire figure was analyzed statistically using the one-way ANOVA where *p < 0.05. Abbreviations: OCR = Oxygen consumption rate; ECAR = extracellular acidification rate; Oligo = oligomycin; FCCP = 4-(trifluoromethoxy) phenyl) carbonohydrazonoyl dicyanide; ant = antimycin A; rot = rotenone. Please click here to view a larger version of this figure.
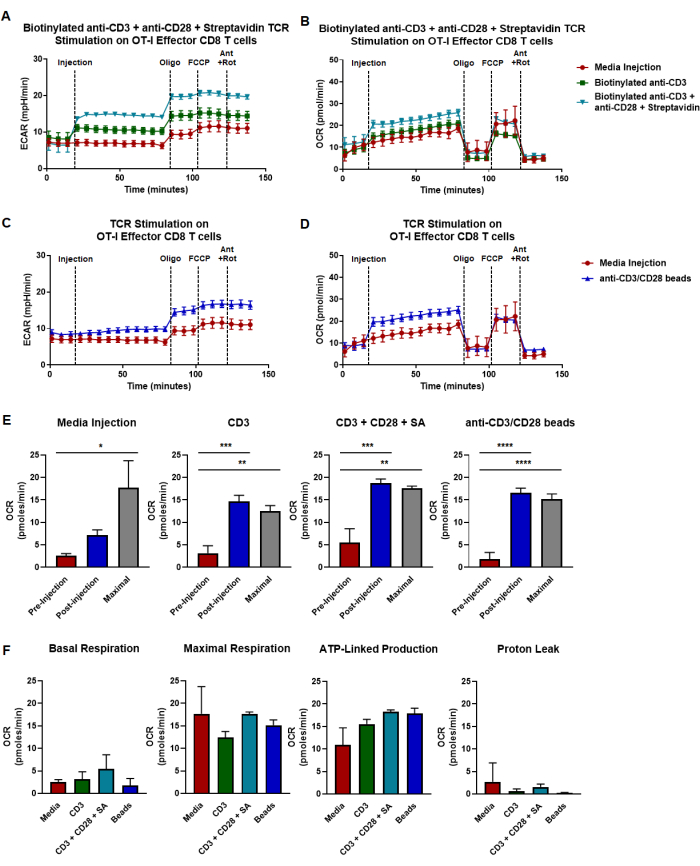
Figure 6: Strategies for T cell receptor stimulation in real time with acute injection of anti-CD3/CD28. (A,B) Acute injection strategy involving biotinylated anti-CD3, streptavidin, and anti-CD28 for mitochondrial function evaluation. Panels display metabolic capacities of antigen stimulated OT-I effector CD8 T cells, specifically showing (A) extracellular acidification rate and (B) oxygen consumption rate. Injections use media only (red), biotinylated anti-CD3 (green), anti-CD28 + streptavidin (blue), or a combination of biotinylated anti-CD3 + anti-CD28 + streptavidin (teal). (C,D) Acute injection of magnetic beads conjugated with anti-CD3/CD28 to assess mitochondrial activity. Panels display metabolic capacities of antigen stimulated OT-I effector CD8 T cells, specifically showing (C) extracellular acidification rate and (D) oxygen consumption rate. Injections use media only (red) or anti-CD3/CD28 bead injection (teal). Assays were performed with injections of oligomycin, FCCP, antimycin A, and rotenone at 18 min intervals in media supplemented with 25 mM glucose. Results are shown as representative data and were obtained using n = 6 technical replicates. (E) Capacity calculations from panels (A-D) showing basal metabolism at pre-injection (red), respiration at post-injection (blue), and maximal respiratory capacity (grey). Conditions are separated based on intra-assay injection. (F) Capacity calculations showing basal respiration, maximal respiration, ATP-linked production, and proton leak. Statistics for this entire figure were performed using the one-way ANOVA where *p < 0.05, **p < 0.005, ***p < 0.0005, and ****p < 0.0001. Abbreviations: OCR = Oxygen consumption rate; ECAR = extracellular acidification rate; Oligo = oligomycin; FCCP = 4-(trifluoromethoxy) phenyl) carbonohydrazonoyl dicyanide; ant = antimycin A; rot = rotenone. Please click here to view a larger version of this figure.
Discussion
In this article, we outline a protocol to assess mitochondrial function of naïve and effector CD8 T cells. We detail and compare methods to prepare both antigen-specific and polyclonal CD8 T cells using OT-I and C57BL/6 mice. Our results demonstrate that there are similar trends in metabolism despite the method of activation and pretreatment in CD8 T cells. The data reveal that antigen-specific activation leads to more metabolically active OT-I CD8 T cells compared to their C57BL/6 wild-type counterparts stimulated with anti-CD3 and anti-CD28. The protocol described here shows that the mitochondrial functional assay, the Mito Stress Test, is a very sensitive and consistently repeatable assay that produces reliable results across multiple various conditions and cell types. Our findings and detailed protocol contribute to the growing recognition of this assay as a foundational methodology for analyzing CD8 T cell metabolism and bioenergetics.
As immunotherapy and various cellular treatments continue to advance, the significance of applying T cell-targeted therapies is also growing41. Response to immunotherapy and anti-tumor immune responses rely on T cell-mediated metabolism, calcium signaling, and oxidative flux triggered from upstream TCR activation42. Both metabolic efficiency and flexibility are required for optimal CD8 T cell responses5,6,7,15,17,26,43 whereas increased proton leak and subsequent oxidative damage impair T cell responses and promote dysfunction9,44. Both T cell proliferation and cytokine production can be rescued by mitigating mitochondrial oxidative stress5,13,20,24,25,29. Within our experiments, we have used naïve CD8 T cells that are cultured in IL-2, which sustains viability; however, these CD8 T cells are arguably no longer equivalent to bona fide naïve CD8 T cells. Thus, we chose to use naïve CD8 T cells directly from the mouse for better quality data and cells that are less likely to be affected by cytokines. Altogether, it is crucial to optimize techniques for examining metabolism across T cell subsets.
CD8 T cell fate is in part directed by metabolic programming which impacts adaptive immune responses2,4,45. Naïve CD8 T cells exit quiescent states upon TCR stimulation25,46,47,48,49,50. Nevertheless, continuous TCR stimulation leads to CD8 T cell exhaustion, resulting in a notably less energetic phenotype compared to functional CD8 T cells3,20,51,52. However, this impact on metabolism can be ameliorated and potentially revitalize exhausted CD8 T cells2,3,20,46,51,52. While the exact mechanism(s) governing CD8 T cell fate and exhaustive differentiation remain poorly understood, dysfunctional and/or exhausted CD8 T cells characteristically have defective mitochondria and overproduction of ROS which are key factors in regulating CD8 T cell effector function9,15,53. CD8 T cell metabolism, phenotypes, and exhaustive differentiation have been studied using the Mito Stress Test. Historically, persistent TCR stimulation resulting in a progressive loss of effector functions defines CD8 T cell exhaustion11,13,16,17. However, there have been recent efforts to better characterize exhausted CD8 T cells and show chromatin and transcriptional landscapes also define exhaustion and are closely related to metabolic flux18,27,28. Altogether, persistent TCR stimulation and subsequent phenotypes and metabolic sequelae can be studied with the Mito Stress Test to potentially identify metabolic vulnerabilities and fate-determining events.
Stimulation of TCR initiates downstream calcium signaling necessary for granule exocytosis and directed T cell killing24,33. Notably, preceding events, such as inflammasome activation and IFNγ production, rely on a persistent and sustained ATP54. During calcium signaling, there is a reported dysregulation in mitochondrial efficiency, known as the "mitochondrial flash" phenomenon55,56,57,58. Mitochondrial flash represents a process where actively respiring mitochondria briefly experience uncoupled respiration resulting in reduced ATP and increased burst of increased ROS55,56. There has been limited research on mitochondrial flash and its relevance in CD8 T cells remains widely unexplored. Importantly, the methodologies outlined in this study can be utilized to investigate these phenomena, exhaustive differentiation in CD8 T cells, and other immune cell profiles.
In summary, these methodologies and tools offer a more comprehensive approach to studying both acute and chronic metabolism. The Mito Stress Test can be applied to examine metabolic programming and how it regulates effector dysfunction and exhaustive differentiation in CD8 T cells. Metabolic reprogramming in lymphocytes may be a factor in understanding the mechanisms underlying immune tolerance, CD8 T cell dysfunction, and exhausted immune responses. Additionally, metabolism and/or lipid mediators play key roles in CD8 T cells' cytotoxicity and exhaustion9 and thus could be targeted as a novel approach to prevent exhaustion or potentially reverse exhaustive differentiation to reduce antitumor immunity. Altogether, the Cell Mito Stress Test assay stands as a robust tool that should be utilized to address these unresolved questions on immunometabolism.
Disclosures
The authors have no competing interests to disclose.
Acknowledgements
The Hertz Foundation, the Amy Davis Foundation, the Moore Family Foundation, and the Heidi Horner Foundation have provided invaluable support, for which we are grateful. This work was also supported in part by NIH grants to RMT (AI052157, AI136534), while JAT was supported by the Hertz Graduate Fellowship.
Materials
| Name | Company | Catalog Number | Comments |
|---|---|---|---|
| Antimycin A | Sigma-Aldrich | A8674 | |
| Anti-CD28 | Biolegend | 102116 | |
| Anti-CD3/CD28 Dynabeads | ThermoFisher | 11456D | |
| Biotinylated anti-CD3 | Biolegend | 317320 | |
| Bovine Serum Albumin | Sigma-Aldrich | 108321-42-2 | |
| CD8a+ T cell isolation kit | Miltenyi Biotec | 130-104-075 | |
| Cell Strainers (100 µm) | CELL TREAT | 229485 | |
| Ethylenediaminetetraacetic acid | Sigma-Aldrich | E8008 | |
| Ficoll | Sigma-Aldrich | 26873-85-8 | density gradient medium |
| FCCP ((4-(trifluoromethoxy) phenyl) carbonohydrazonoyl dicyanide) | Sigma-Aldrich | C2920 | |
| Glucose | Sigma-Aldrich | G-6152 | |
| Glutamine | Sigma-Aldrich | G7513 | |
| LS Columns | Miltenyi Biotec | 130-042-401 | Positive selection columns |
| Magnetic cell separation column | Miltenyi Biotec | 130-042-301 | |
| Microplate | Agilent | 102601-100 | |
| Oligomycin | Sigma-Aldrich | 75351 | |
| Pyruvate | Sigma-Aldrich | 113-24-6 | |
| Recobinant IL-2 | PeproTech | 200-02 | |
| Rotenone | Sigma-Aldrich | R8875 | |
| Seahorse media | Agilent | 103576-100 | |
| Sensor cartridge | Agilent | 102601-100 | |
| Streptavidin | Sigma-Aldrich | A9275 | |
| Sterile 6 well plate | CELL TREAT | 230601 | |
| Sterile 24 well plate | CELL TREAT | 229524 | |
| XF Calibrant | Agilent | 102601-100 |
References
- Patsoukis, N., et al. PD-1 alters T-cell metabolic reprogramming by inhibiting glycolysis and promoting lipolysis and fatty acid oxidation. Nat Commun. 6, 6692(2015).
- Scharping, N. E., et al. Mitochondrial stress induced by continuous stimulation under hypoxia rapidly drives T cell exhaustion. Nat Immunol. 22, 205-215 (2021).
- Schurich, A., et al. Distinct Metabolic Requirements of Exhausted and Functional Virus-Specific CD8 T Cells in the Same Host. Cell Rep. 16 (5), 1243-1252 (2016).
- Zhang, L., Romero, P. Metabolic control of CD8(+) T cell fate decisions and antitumor immunity. Trends Mol Med. 24 (1), 30-48 (2018).
- Batabyal, R., et al. Metabolic dysfunction and immunometabolism in COVID-19 pathophysiology and therapeutics. Int J Obes (Lond). 45 (6), 1163-1169 (2021).
- Chavakis, T. Immunometabolism: Where immunology and metabolism meet. J Innate Immun. 14, 1-3 (2022).
- Frezza, C., Mauro, C. Editorial: The metabolic challenges of immune cells in health and disease. Front Immunol. 6, 293(2015).
- Wang, X., Ping, F. F., Bakht, S., Ling, J., Hassan, W. Immunometabolism features of metabolic deregulation and cancer. J Cell Mol Med. 23 (2), 694-701 (2019).
- Turner, J. A., et al. Lysophosphatidic acid modulates CD8 T cell immunosurveillance, metabolism, and anti-tumor immunity. Nat Commun. 14, 3214(2023).
- Coussens, L. M., Werb, Z. Inflammation and cancer. Nature. 420, 860-867 (2002).
- Jiang, Y., Li, Y., Zhu, B. T-cell exhaustion in the tumor microenvironment. Cell Death Dis. 6 (6), e1792(2015).
- Krangel, M. S. Mechanics of T cell receptor gene rearrangement. Curr Opin Immunol. 21 (2), 133-139 (2009).
- Barber, D. L., et al. Restoring function in exhausted CD8 T cells during chronic viral infection. Nature. 439, 682-687 (2006).
- Beltra, J. C., et al. Developmental relationships of four exhausted CD8(+) T cell subsets reveals underlying transcriptional and epigenetic landscape control mechanisms. Immunity. 52 (5), 825-841 (2020).
- Bengsch, B., et al. Bioenergetic insufficiencies due to metabolic alterations regulated by the inhibitory receptor PD-1 are an early driver of CD8(+) T cell exhaustion. Immunity. 45 (2), 358-373 (2016).
- Blank, C. U., et al. Defining 'T cell exhaustion'. Nat Rev Immunol. 19, 665-674 (2019).
- Dolina, J. S., Van Braeckel-Budimir, N., Thomas, G. D., Salek-Ardakani, S. CD8(+) T cell exhaustion in cancer. Front Immunol. 12, 715234(2021).
- Mognol, G. P., et al. Exhaustion-associated regulatory regions in CD8(+) tumor-infiltrating T cells. Proc Natl Acad Sci U S A. 114 (13), E2776-E2785 (2017).
- Wang, D., et al. A comprehensive profile of TCF1(+) progenitor and TCF1(-) terminally exhausted PD-1(+)CD8(+) T cells in head and neck squamous cell carcinoma: implications for prognosis and immunotherapy. Int J Oral Sci. 14 (1), 8(2022).
- Vardhana, S. A., et al. Impaired mitochondrial oxidative phosphorylation limits the self-renewal of T cells exposed to persistent antigen. Nat Immunol. 21, 1022-1033 (2020).
- Kang, S., Brown, H. M., Hwang, S. Direct antiviral mechanisms of interferon-gamma. Immune Netw. 18 (5), e33(2018).
- Samuel, C. E. Antiviral actions of interferons. Clin Microbiol Rev. 14, 778-809 (2001).
- Schellekens, H., Weimar, W., Cantell, K., Stitz, L. Antiviral effect of interferon in vivo may be mediated by the host. Nature. 278, 742(1979).
- Radoja, S., et al. CD8(+) tumor-infiltrating T cells are deficient in perforin-mediated cytolytic activity due to defective microtubule-organizing center mobilization and lytic granule exocytosis. J Immunol. 167 (9), 5042-5051 (2001).
- van der Windt, G. J., et al. Mitochondrial respiratory capacity is a critical regulator of CD8+ T cell memory development. Immunity. 36 (1), 68-78 (2012).
- Balmer, M. L., et al. Memory CD8(+) T cells require increased concentrations of acetate induced by stress for optimal function. Immunity. 44 (6), 1312-1324 (2016).
- Pereira, R. M., Hogan, P. G., Rao, A., Martinez, G. J. Transcriptional and epigenetic regulation of T cell hyporesponsiveness. J Leukoc Biol. 102, 601-615 (2017).
- Sen, D. R., et al. The epigenetic landscape of T cell exhaustion. Science. 354, 1165-1169 (2016).
- Quintana, A., et al. T cell activation requires mitochondrial translocation to the immunological synapse. Proc Natl Acad Sci U S A. 104 (36), 14418-14423 (2007).
- Brindley, D. N. Lysophosphatidic acid signaling in cancer. Cancers (Basel). 12 (12), 3791(2020).
- Chae, C. S., et al. Tumor-derived lysophosphatidic acid blunts protective type I interferon responses in ovarian cancer. Cancer Discov. 12, 1904-1921 (2022).
- Kremer, K. N., et al. LPA suppresses T cell function by altering the cytoskeleton and disrupting immune synapse formation. Proc Natl Acad Sci U S A. 119 (15), e2118816119(2022).
- Mathew, D., et al. LPA5 is an inhibitory receptor that suppresses CD8 T-cell cytotoxic function via disruption of early TCR signaling. Front Immunol. 10, 1159(2019).
- Mathew, D., Torres, R. M. Lysophosphatidic acid is an inflammatory lipid exploited by cancers for immune evasion via mechanisms similar and distinct from CTLA-4 and PD-1. Front Immunol. 11, 531910(2020).
- Oda, S. K., et al. Lysophosphatidic acid inhibits CD8 T cell activation and control of tumor progression. Cancer Immunol Res. 1 (4), 245-255 (2013).
- Lidgerwood, G. E., Pitson, S. M., Bonder, C., Pebay, A. Roles of lysophosphatidic acid and sphingosine-1-phosphate in stem cell biology. Prog Lipid Res. 72, 42-54 (2018).
- Torres, R. M., Turner, J. A., D'Antonio, M., Pelanda, R., Kremer, K. N. Regulation of CD8 T-cell signaling, metabolism, and cytotoxic activity by extracellular lysophosphatidic acid. Immunol Rev. 317 (1), 203-222 (2023).
- Turner, J. A., et al. BRAF modulates lipid use and accumulation. Cancers (Basel). 14 (9), 2110(2022).
- Hogquist, K. A., et al. T cell receptor antagonist peptides induce positive selection. Cell. 76, 17-27 (1994).
- Li, Y., Kurlander, R. J. Comparison of anti-CD3 and anti-CD28-coated beads with soluble anti-CD3 for expanding human T cells: differing impact on CD8 T cell phenotype and responsiveness to restimulation. J Transl Med. 8, 104(2010).
- Ralli, M., et al. Immunotherapy in the treatment of metastatic melanoma: current knowledge and future directions. J Immunol Res. 2020, 9235638(2020).
- Philip, M., Schietinger, A. CD8(+) T cell differentiation and dysfunction in cancer. Nat Rev Immunol. 22, 209-223 (2022).
- Bajrai, L. H., et al. Understanding the role of potential pathways and its components including hypoxia and immune system in case of oral cancer. Sci Rep. 11, 19576(2021).
- Nicholls, D. G. Mitochondrial proton leaks and uncoupling proteins. Biochim Biophys Acta Bioenerg. 1862, 148428(2021).
- Tyrakis, P. A., et al. S-2-hydroxyglutarate regulates CD8(+) T-lymphocyte fate. Nature. 540, 236-241 (2016).
- Guo, Y., et al. Metabolic reprogramming of terminally exhausted CD8(+) T cells by IL-10 enhances anti-tumor immunity. Nat Immunol. 22, 746-756 (2021).
- Notarangelo, G., et al. Oncometabolite d-2HG alters T cell metabolism to impair CD8(+) T cell function. Science. 377 (6614), 1519-1529 (2022).
- Yang, K., et al. T cell exit from quiescence and differentiation into Th2 cells depend on Raptor-mTORC1-mediated metabolic reprogramming. Immunity. 39 (6), 1043-1056 (2013).
- Ricciardi, S., et al. The translational machinery of human CD4(+) T cells is poised for activation and controls the switch from quiescence to metabolic remodeling. Cell Metab. 28 (6), 895-906.e5 (2018).
- Moller, S. H., Hsueh, P. C., Yu, Y. R., Zhang, L., Ho, P. C. Metabolic programs tailor T cell immunity in viral infection, cancer, and aging. Cell Metab. 34 (3), 378-395 (2022).
- Alrubayyi, A., et al. Functional restoration of exhausted CD8 T cells in chronic HIV-1 infection by targeting mitochondrial dysfunction. Front Immunol. 13, 908697(2022).
- Vignali, P. D. A., et al. Hypoxia drives CD39-dependent suppressor function in exhausted T cells to limit antitumor immunity. Nat Immunol. 24, 267-279 (2023).
- Ogando, J., et al. PD-1 signaling affects cristae morphology and leads to mitochondrial dysfunction in human CD8(+) T lymphocytes. J Immunother Cancer. 7 (1), 151(2019).
- Billingham, L. K., et al. Mitochondrial electron transport chain is necessary for NLRP3 inflammasome activation. Nat Immunol. 23, 692-704 (2022).
- Eberhardt, D. R., et al. EFHD1 ablation inhibits cardiac mitoflash activation and protects cardiomyocytes from ischemia. J Mol Cell Cardiol. 167, 1-14 (2022).
- Hou, T., et al. Identification of EFHD1 as a novel Ca(2+) sensor for mitoflash activation. Cell Calcium. 59 (5), 262-270 (2016).
- Mun, S. A., et al. Structural and biochemical characterization of EFhd1/Swiprosin-2, an actin-binding protein in mitochondria. Front Cell Dev Biol. 8, 628222(2020).
- Stein, M., et al. A defined metabolic state in pre B cells governs B-cell development and is counterbalanced by Swiprosin-2/EFhd1. Cell Death Differ. 24 (7), 1239-1252 (2017).
Reprints and Permissions
