This protocol describes the intrafemoral injection of a few hematopoietic or leukemic stem cells, including gene-edited cells, in murine xenograft models, which will not only enable the quick and safe transplantation of cells but also serial analyses of the bone marrow.
Method Article
Simplified Intrafemoral Injections Using Live Mice Allow for Continuous Bone Marrow Analysis
In This Article
Summary
Abstract
Despite the complexity of hematopoietic cell transplantation in humans, researchers commonly perform intravenous or intrafemoral (IF) injections in mice. In murine models, this technique has been adapted to enhance the seeding efficiency of transplanted hematopoietic stem and progenitor cells (HSPCs). This paper describes a detailed step-by-step technical procedure of IF injection and the following bone marrow (BM) aspiration in mice that allows for serial characterization of cells present in the BM. This method enables the transplantation of valuable samples with low cell numbers that are particularly difficult to engraft by intravenous injection. This procedure facilitates the creation of xenografts that are critical for pathological analysis. While it is easier to access peripheral blood (PB), the cellular composition of PB does not reflect the BM, which is the niche for HSPCs. Therefore, procedures providing access to the BM compartment are essential for studying hematopoiesis. IF injection and serial BM aspiration, as described here, allow for the prospective retrieval and characterization of cells enriched in the BM, such as HSPCs, without sacrificing the mice.
Introduction
The blood system is maintained throughout life by hematopoietic stem cells (HSCs), which reside in bone marrow (BM)1,2. To study dynamic changes in the BM environment, it is important to understand the biology of both normal and malignant hematopoiesis3,4. Transplantation of HSCs directly into human BM yields higher engraftment than peripheral blood (PB) infusion, but high procedural complexity and increased risk of infection preclude this method from being part of standard practice5. In mice, procedures that facilitate BM access without sacrificing the animals provide a resource to serially monitor hematopoiesis. The described procedure aims to produce mice with high engraftment of transplanted cells and allow for serial sampling of the BM of live mice. This paper will focus on producing xenograft models using immunodeficient mice engrafted with human cells, which are more challenging to produce than mouse-mouse allotransplantation models. Compared to conventional transplantation of hematopoietic stem and progenitor cells (HSPCs) through the tail or retroorbital vein, the advantages of this procedure are high cellular engraftment with a low amount of starting material.
Although intrafemoral (IF) cellular injection into the BM cavity of mice is commonly used to study human HSPCs in vivo6,7,8, a formal step-by-step procedure illustrating/filming this technique has not been previously published. This protocol enables high engraftment from a low number of transplanted cells and a mechanism to sample the BM serially. Furthermore, it is possible to utilize this method to analyze the effects of injecting drugs directly into the BM cavity on the treatment of blood diseases. The procedure described here helps obtain access to BM where hematopoietic cells reside without sacrificing the mice.
This protocol is similar to the technique used for BM aspirations9. The key difference is that this paper and the accompanying video protocol detail a safe procedure for injecting cells into the marrow, whereas previous papers transplanted cells via the vein and then performed serial BM aspiration. This protocol enables successful engraftment with small numbers of a cell line (Figure 1), normal cord blood (CB)-derived HSPCs (CD34+) (Figure 2) and HSCs (CD34+CD38-CD45RA-CD90+) (Figure 3), normal BM-derived HSPCs (CD34+CD38-) (Figure 4), patient-derived leukemic stem cells (CD34+CD38-) (Figure 5), CRISPR/Cas9 gene-edited normal CB-derived HSPCs (CD34+) (Figure 6), and acute myeloid leukemia (AML)-iPSCs (Figure 7). Especially for the normal cord blood-derived HSCs, we could successfully make engraftment with only 10 cells. This method is especially valuable for experiments performed with rare or difficult-to-generate cell populations such as unmodified or gene-edited primary human acute myeloid leukemia or CB cells. Furthermore, this procedure describes an efficient method for the serial analysis of engrafted cells, which can be immediately used in downstream experiments. To avoid wasting valuable samples and ensure IF injection, we have also briefly described Akaluc-based procedure10 practices here to help solidify this technique.
Protocol
Six- to ten-week-old male or female NOD.Cg-Prkdcscid Il2rgtm1Wjl/SzJ (NSG) mice were used in this protocol, but it can be applied to all types of mice. The irradiation depends on the experimental content and the type of mice, whether or not to irradiate the mice depends on the research objectives. All animal procedures described here were conducted in accordance with the Guidelines for the Care and Use of Laboratory Animals and were approved by Stanford University's Administrative Panel on Lab Animal Care (APLAC #22264). All normal blood cell populations were sorted out fresh. Human AML samples were obtained from patients at the Stanford Medical Center with informed consent, according to institutional review board (IRB)-approved protocols (Stanford IRB, 33818).
1. Intrafemoral injection of cell lines, hematopoietic stem and progenitor cells (HSPCs), or leukemic stem cells (LSCs)
NOTE: To easily analyze the injected cells with an imaging device, an Akaluc/tdTomato-positive K562 cell line was generated, and AkaLumine-HCl/Akaluc was used as a substrate10. If imaging equipment is not available, cells can be labeled with a fluorescent dye by lentivirus or PiggyBac and analyzed by flow cytometry. Regardless of the details of cell preparation, having a way to prove that the cells administered into the bone marrow have reliably entered the BM is important for improving this technique (Figure 1).
- Prepare cell suspensions (up to 3 × 10⁶ blood cells) with 20 µL of fluorescence-activated cell sorting (FACS) buffer (phosphate-buffered saline (PBS) + 2% fetal bovine serum (FBS) + 2 mM EDTA) or Thaw medium (IMDM + 20% FBS + Pen/Strep) in PCR or 1.5 mL tubes and keep on ice before injection.
NOTE: Avoid making air bubbles while suspending the cells with the needle. Bubbles should be removed as much as possible right before the injection, as injecting air bubbles can cause sudden death of mice. - Condition 6-10-week-old adult mice with 200 cGy (225 kV, 13.3 mA, total 2 Gy [Dose control mode]) up to 48 h prior to injection of the cells.
- First, anesthetize the mice with isoflurane inhalation in an induction chamber and maintain at 2% isoflurane in 100% oxygen at a flow rate of 1-2 L/min via a nose cone to reach a steady state of anesthesia. Check the depth of anesthesia with a toe pinch reflex and slow, steady breathing, and maintain this state throughout the isoflurane procedure.
NOTE: Monitor the depth of the anesthesia every 3-5 min throughout the procedure to ensure there is no change in heart and respiratory rates with surgical manipulation and/or ear, toe, and tail pinch. The color of mucous membranes and skin can be used as an indicator of oxygenation, as they will be pinkish if the mice are in good condition. Exercise caution when opaque drapes are placed over the mouse, as it is not always possible to see what is happening with the mouse. - Prior to the procedure, administer mice with 10 mg/kg carprofen subcutaneously to minimize pain and warm 0.5-1.0 mL of 0.9% saline for supportive care.
- Apply ophthalmic ointment to the eyes of the mouse to avoid corneal drying.
- Keep the mouse on a heat pad or other thermostatically controlled surface to prevent hypothermia during the procedure.
NOTE: After the procedure, a temperature-adjustable heating pad is used. The body temperature of the mouse is typically 37-39 °C, and the pad should ideally be slightly lower than this. In practice, the temperature is often set at 32-36 °C. - Disinfect the entire leg containing the femur to be injected with three sets of alternating scrubs (alternating with either a povidone-iodine or a chlorhexidine scrub and 70% ethanol-soaked gauze sponges).
NOTE: 1) If the operator is left-handed, the left femur of the mouse might be easier to inject than the right femur. 2) In this study, the fur was not removed for injections to avoid unnecessary skin damage, and the needle entry site can be easily located without cutting the fur off. However, in mice with dark fur, it may be challenging to locate the puncture site, in which case, consider cutting off the fur as it is quick and easy to start the injection. - Pinch the femur gently with the thumb and index fingers to stabilize the leg. Push the tibia with either the ring or the fifth finger to keep the tibia bent from the femur. Positioning is important for successful injection (Supplementary Figure S1-S5).
NOTE: Use forceps to pinch the bone to prevent injury to the fingers; however, it might be difficult to feel the shaft of the femur and will add time to the procedure. - Insert an empty sterile 27 G needle (1/2 inch) with an attached syringe just under the patellar tendon so that the needle is lodged securely between the two condyles of the femur. Use the edge of the needle and peck the patellar tendon on top of the femur lightly a couple of times to find the best place to insert the needle (Supplementary Figure S1-S5).
NOTE: A knowledge of the anatomy of the mouse knee area is necessary before performing this procedure. Beginners should take the time to understand the anatomy of the area and practice the procedure on an euthanized mouse before attempting it on a live mouse. - Swivel the needle outward and upward to ensure it is parallel with the shaft of the femur.
NOTE: This maneuver provides a reliable path to the marrow cavity, facilitates retrieval of marrow contents from the femoral shaft, and minimizes discomfort to the animal from the procedure. - Turn the needle in circles while slowly advancing into the femoral marrow cavity. Insert the needle until there is a noticeable reduction in resistance. Confirm the correct positioning of the needle by gently moving the syringe laterally. If it is possible to touch the edge of the needle with the fingers coming outside the bone, go back to step 1.9 and find another angle and place to drill the needle down.
- Ensure that the needle's entry angle is perpendicular to the bone end-face.
NOTE: Theoretically, the needle must be injected parallel to the femur and must be at a 90° angle to the bone ends. If there is resistance from the interior surface, the needle has been correctly placed in the femoral cavity. To make sure the needle is parallel to the bone, place a light on the side of the bone and observe the shadow of the bone parallel to the shaft of the needle. The decrease in resistance upon entry into the bone marrow cavity depends on the age of the mouse: the younger the mouse, the easier it is to recognize the decrease in resistance.
- Ensure that the needle's entry angle is perpendicular to the bone end-face.
- Create negative pressure by gently pulling the needle plunger back while moving the needle back and forth within the BM cavity. If the needle is in the BM cavity, some blood/marrow will come out in the syringe.
- If the blood/marrow is not seen, change to a new needle and try to find the same route.
NOTE: The reason for changing to a new needle is that once the bone clogs the needle, it becomes difficult to check for the backflow of the blood/marrow. Minimizing the number of injection routes into the BM cavity is crucial, as cells injected into the bone marrow have the potential to leak out of the femur through previous entry points. If multiple injection routes are necessary, leaking risk can be reduced by injecting cells gradually rather than a quick bolus.
- If the blood/marrow is not seen, change to a new needle and try to find the same route.
- Remove the needle slowly and insert the cell-containing syringe through the same route. Try to insert the needle until it stops (at the edge of the BM cavity) and pull back a little bit (1-2 mm) from there to inject the cells easily. Prior to depressing the plunger and releasing the cells, aspirate slightly and check for blood/marrow to ensure the correct placement of the needle. Check the backflow of the blood/marrow first and then push the syringe slowly to inject the cells.
NOTES: It is very important to remember the route and angle of the first injection when switching to a new needle. If the same route cannot be found, try again with the original needle used to make the first route. A new needle may be used at this time, but if the original needle is used, the jammed bone should be pushed out once before use. Do not use the needle with the cells to find a new route to inject; otherwise, pieces of bone stuck in the needle may prevent cell dispersal. Although the BM cavity is very small, the injection volume should be less than 30 µL, considering the dead cavity.- Ensure that the speed of injection is slow to prevent air in the syringe from entering the bone marrow and to prevent cells from leaking from the puncture site. If resistance is felt while pushing the syringe, move the needle up and down to find a less resistant area in the cavity.
- Once the cells are successfully injected into the femur, remove the needle and syringe from the mouse while maintaining pressure on the syringe.
NOTE: Try again with the other femur if the injection cannot be completed. The procedure is very stressful for the mouse, even under anesthesia. Always monitor the vital signs (heart and breathing rate) of the mouse and try to finish the procedure as soon as possible. - Remove the mouse from the nose cone and place it on a clean paper towel to prevent aspiration of bedding. During the recovery, keep the mouse on a heating pad or other thermostatically controlled surface. Monitor all mice to verify recovery from anesthesia prior to placing them back on the mouse rack.
NOTE: There should be no complication or distress post aspiration if done properly. The procedure will be completed when anesthetized mice have recovered and are able to ambulate and reach food and water. - Observe the mice for signs of distress or infection post-procedure over the next 24 h. Signs of distress or infection include constant bleeding, anemia, and lethargy. If any of these signs are seen post-procedure, euthanize the animal(s) by CO2 inhalation or cervical dislocation according to the animal handling protocol.
2. Aspiration of bone marrow cells from the femur for the FACS analysis
NOTE: The procedure for aspirating the BM cells from the mice is very similar to the methods described in section 1 and can be learned from some previous literature9,11,12. The following is an overview of some differences between the BM injection and aspiration protocols.
- Prepare 500 µL of PBS + 10 mM EDTA (cell suspension medium: CSM) per sample for suspending the BM aspiration.
- Wet a 0.5 mL 27 G syringe with CSM before aspirating the BM. Fill the syringe with 200-500 µL of CSM and immediately expel it. Repeat this procedure 2-3x.
- Aspirate the BM gently by withdrawing the plunger on the syringe yielding 20-50 µL of mouse BM. Then, fully remove the needle from the femur and suspend the aspirated sample in CSM (500 µL in a 1.5 mL tube) for the following staining step. Remove the mouse from the nose cone and place it on a clean paper towel to prevent aspiration of bedding during recovery. Monitor all mice to verify recovery from anesthesia prior to placing them back on the mouse rack.
NOTE: BM aspiration/sampling can be repeated, but the repeat procedure on the same day must be performed on the opposite femur to prevent repeated trauma to the same leg. Although there is little information on the frequency of BM aspiration, we believe that femoral BM aspiration is generally repeated every 4 weeks and can be performed at least 3-4x in total without any issues (e.g., infection) based on our experience. However, it should be kept in mind that the bone marrow on the contralateral side of the transplanted bone marrow generally has lower cellular engraftment. - Pellet cells from the bone marrow aspirate by a 5 min spin at 300 × g, 4 °C.
- Aspirate the supernatant, add 0.5-1 mL of ACK lysis buffer (150 mM NH4Cl, 10 mM KHCO3, 0.1 mM EDTA) to each tube, and vortex to resuspend the cells. Place on ice for 5-10 min.
- Filter each tube through nylon mesh into a new tube.
- Rinse the tube with 1 mL of FACS buffer and add it through the nylon mesh into a new tube as well.
- Pellet cells by a 5 min spin at 300 × g, 4 °C.
- Aspirate the supernatant and add the staining solution containing the desired antibodies13. Place on ice for 20 min.
- Wash the cells and analyze them as per the experimental setup.
- Wash cells with FACS buffer (PBS, 2% FBS, 2 mM EDTA) and stain them with antibodies for 30 min on ice in a total volume of 50 µL. Wash and stain the cells with propidium iodide (PI) at a final concentration of 1 µg/mL immediately before the analysis or sorting. Perform post sort analyses to verify the purity of the sorted cell populations.
NOTE: All antibodies used for flow cytometry are detailed in the Table of Materials. - Use the following FACS gating strategies (Figure 2-7) to analyze the engrafted cells from the mouse bone marrow.
- Distinguish populations of cells by their forward (size) and side scatter (granularity) properties.
- Perform doublet discrimination by plotting FSC-H vs FSC-W, following SSC-H vs SSC-W.
- Exclude dead cells.
- Distinguish populations of cells by human CD45 and mouse CD45. These antibody staining combinations enable the detection of human CD3, CD19, and CD33 as well within the human CD45 fraction.
NOTE: Before staining the samples, remember to use mouse and human Fc blocks to prevent non-specific antibody binding. We usually stain with the Fc blocks (mouse + human) for 10 min on ice and then add the antibodies without washing the cells. Refer to each company's instructions on how to use the Fc block antibodies.
- Wash cells with FACS buffer (PBS, 2% FBS, 2 mM EDTA) and stain them with antibodies for 30 min on ice in a total volume of 50 µL. Wash and stain the cells with propidium iodide (PI) at a final concentration of 1 µg/mL immediately before the analysis or sorting. Perform post sort analyses to verify the purity of the sorted cell populations.
Results
Following these protocols1,14,15,16,17,18,19,20, each sample was transplanted, and the xenograft mouse model was established. The aim of the experiments here was to show IF injection with several types of human cells and following bone marrow aspiration/analysis in live mice. This paper shows the results of transplantation of the following commonly used human-derived samples. Samples included the K562 cell line (Figure 1), cord blood-derived HSPCs (CD34+, Figure 2), cord blood-derived HSCs (CD34+CD38-CD90+CD45RA-, Figure 3), adult bone marrow-derived HSPCs (CD34+/CD38-, Figure 4), leukemia stem cells (CD34+/CD38-, Figure 5), CRISPR/Cas9-edited cord blood-derived HSPCs (CD34+, Figure 6), and patient-derived AML-iPSCs (Figure 7). It is important to remember that these samples are of human origin, and the variation among samples is so great that there will also be a great deal of variation in the engraftment in each mouse. To avoid wasting valuable samples when conducting large-scale experiments, it is always important to first ascertain how many cells need to be transplanted to achieve a minimum level of engraftment.
Figure 1 shows a bioluminescence image of mice intrafemorally injected with cell lines (total of 10 cells) expressing AkaLumine-HCl/Akaluc. The Akaluc signal was shown on the side of the transplanted femur. With Akaluc here and luciferase elsewhere, transplantation techniques can be easily evaluated with minimal mouse invasion. If the operator needs more confidence in their technique, we recommend practicing IF using these methods first. For more details on imaging, refer to the respective papers10 and instruction manuals. We transplanted 10 cells per mouse; three mice were transplanted, and one was successfully engrafted, represented in this figure.
Figure 2 shows a sublethally irradiated NSG mouse transplanted with 15,000 cord blood (CB)-derived normal CD34+ HSPCs (magnetic bead-enriched) and serially analyzed by IF aspiration. Although there are variations among CB donors, transplantation of 15,000 - 20,000 CD34+-enriched cells generally results in more than 10 - 20% of human CD45+ cell engraftment at 8 weeks post-transplantation (n=4). Here, a significant number of human cells were found to be engrafted at 8 weeks; most of these were considered progenitor cells and were expected to disappear gradually. A decrease in the percentage of human cells was observed at 14 and 24 weeks after transplantation. Generally, CD19+ cells predominate over CD33+ cells in NSG mice. This is the opposite of human complete blood count, where CD33+ cells predominate.
Figure 3 shows a sublethally irradiated NSG mouse transplanted with 10 cord blood-derived normal HSCs (CD34+CD38-CD90+CD45RA-) and serially analyzed by IF aspiration at 8, 12, and 16 weeks post-transplantation. Although there are variations among cord blood donors, transplantation of 5 - 10 normal HSCs generally results in 0 - 10 % human engraftment at 8 weeks post-transplantation. The proportion of CD19+ and CD33+ cells was the same as that detected with CB-derived normal HSPCs. In this situation, 50 mice were transplanted, and 18 had successfully engrafted (32.7%).
Figure 4 shows a sublethally irradiated NSG mouse transplanted with 1,000 normal adult BM-derived CD34+CD38- HSPCs. Generally, adult BM-derived HSPCs are more challenging to engraft in NSG mice compared to the same number of cord blood-derived HSPCs. Since we transplanted a low cell number, we waited for 18 weeks after the transplantation to analyze engraftment. The proportion of CD19+ and CD33+ cells was the same as that detected with CB-derived normal HSPCs (n=1).
Figure 5 shows a sublethally irradiated NSG mouse transplanted with 330 patient-derived CD34+CD38- leukemia stem cells (LSCs) following chimerism analysis by IF aspiration at 8 and 12 weeks post-transplantation. Because of the large sample-to-sample variation in primary cells, there is often a large difference in engraftment even when the same number of cells are transplanted. Therefore, some degree of optimization is significant when conducting experiments with primary AML samples. In our experience, we have transplanted 113 patient samples (bulk CD34+ or LSCs, 10-2,592 cells/mouse), and eventually made 77 samples engrafted (68.1%).
Figure 6 shows a sublethally irradiated NSG mouse transplanted with 12,000 CRISPR/Cas9 edited cells (CB-derived CD34+ -enriched) following chimerism analysis by IF aspiration at 8 and 12 weeks post-transplantation. Cells were simply edited by nucleofection of an RNP (Cas9 and sgRNA) against the targeted gene, as per the previous literature13. Here, we targeted the AAVS1 gene. The AAVS1 locus is cited as a permissive safe harbor for stable transgene expression. The proportion of CD19+ and CD33+ cells was the same level as detected in CB-derived normal HSPCs. In our experience, we have transplanted three cord blood samples (CRISPR/Cas9-edited CD34+, 12,000-62,500 cells/mouse), and eventually made 26/26 mice engrafted (100.0%).
Figure 7 shows engrafted human CD45+ cells in the BM of a secondary recipient NSG mouse. The mice were transplanted with 10,000 CD34+ cells taken from the bone marrow of human primary NSG mice transplanted with cells differentiated from AML-iPSCs17,18, and at 5 weeks, the bone marrow was examined. Despite the sample-to-sample variation, the AML-iPSCs showed stable engraftment after a second transplant (n = 7, human CD45 ≥ 70%). Because it is a disease model, the health of the mice deteriorates as the disease progresses, but the status of the bone marrow can still be confirmed by IF aspiration at least 1-2 times.

Figure 1: Engraftment of human leukemia cell line K562 with Akaluc. A bioluminescence image of mice intrafemorally injected with 30 K562 cells expressing Akaluc. Substrate was administrated intraperitoneally. We used a CCD camera to capture the images (10 s exposure time). The AkaLumine-HCl/ Akaluc signal was shown on the side of the transplanted femur with high signal. Please click here to view a larger version of this figure.
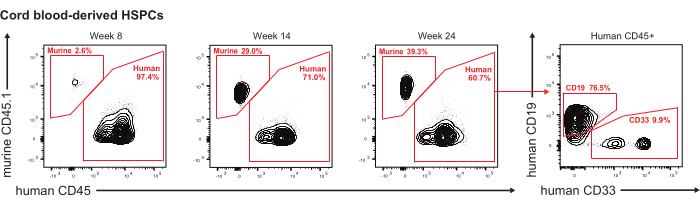
Figure 2: Engraftment of long-term normal human cord blood (CB)-derived HSPCs (CD34+). Representative flow plots of engrafted human CD45+ cells from mouse intrafemorally transplanted with normal CB-derived CD34+ HSPCs (total 15,000) into sublethally irradiated NSG mouse. The human cell engraftment in the mouse was serially analyzed by BM aspirations after 8, 14, and 24 weeks of transplantation; X-axis: Human CD45 expression. Y-axis: Mouse CD45.1 expression. The far-right figure shows flow plots of engrafted human CD19+ and CD33+ human cells within engrafted CD45+ after 24 weeks of transplantation; X-axis: Human CD33 expression. Y-axis: Human CD19 expression. Please click here to view a larger version of this figure.
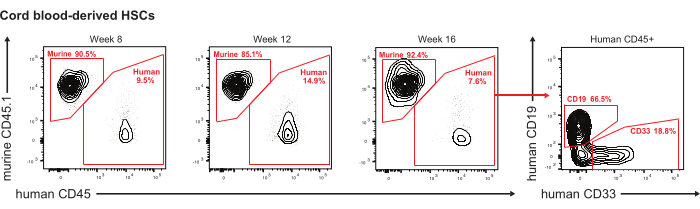
Figure 3: Engraftment of long-term normal human CB-derived HSCs (CD34+CD38-CD90+CD45RA-). Representative flow plots of engrafted human CD45+ cells from mouse intrafemorally transplanted with normal CB-derived CD34+CD38-CD90+CD45RA- HSCs (total 10) into sublethally irradiated NSG mouse. The human cell engraftment in the mouse was serially analyzed by BM aspirations after 8, 12, and 16 weeks of transplantation. X-axis: Human CD45 expression. Y-axis: Mouse CD45.1 expression. The far-right figure shows flow plots of engrafted human CD19+ and CD33+ human cells within engrafted CD45+ after 16 weeks of transplantation; X-axis: Human CD33 expression. Y-axis: Human CD19 expression. Please click here to view a larger version of this figure.

Figure 4: Engraftment of normal adult human bone marrow (BM)-derived HSPCs (CD34+CD38-) Representative flow plots of engrafted human CD45+ cells from mouse intrafemorally transplanted with normal human BM-derived CD34+CD38- cells (total 1,000) into sublethally irradiated NSG mouse. The human cell engraftment in the mouse was analyzed by BM aspirations after 18 weeks of transplantation. X-axis: Human CD45 expression. Y-axis: Mouse CD45.1 expression. The right figure shows flow plots of engrafted human CD19+ and CD33+ human cells within engrafted CD45+ after 18 weeks of transplantation; X-axis: Human CD33 expression. Y-axis: Human CD19 expression. Please click here to view a larger version of this figure.

Figure 5: Engraftment of patient-derived leukemia stem cells (CD34+CD38-). Representative flow plots of engrafted human CD45+ cells from mouse intrafemorally transplanted with CD34+CD38- leukemic stem cells (total 330) into sublethally irradiated NSG mouse. The human cell engraftment in the mouse was serially analyzed by BM aspirations after 8 and 12 weeks of transplantation. X-axis: Human CD45 expression. Y-axis: Mouse CD45.1 expression. Please click here to view a larger version of this figure.
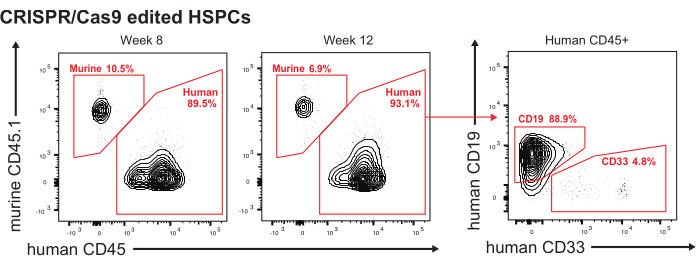
Figure 6: Engraftment of CRISPR/Cas9 edited HSPCs (CD34+). Representative flow plots of engrafted human CD45+ cells from mouse intrafemorally transplanted with normal CB-derived CD34+ -enriched CRISPR/Cas9 edited cells (total 12,000) into sublethally irradiated NSG mouse. The human cell engraftment in the mouse was serially analyzed by BM aspirations after 8 and 12 weeks of transplantation. X-axis: Human CD45 expression. Y-axis: Mouse CD45.1 expression. The far-right figure shows flow plots of engrafted human CD19+ and CD33+ human cells within engrafted CD45+ after 12 weeks of transplantation; X-axis: Human CD33 expression. Y-axis: Human CD19 expression. Please click here to view a larger version of this figure.

Figure 7: Engraftment of patient-derived iPSCs. Representative flow plots of engrafted human CD45+ cells in the BM of a secondary recipient NSG mouse. The mice were transplanted with CD34+ cells (total 10,000) taken from the BM of human primary NSG mice transplanted with AML-iPSCs. The human cell engraftment in the mouse was analyzed by BM aspirations after 5 weeks of transplantation. X-axis: Human CD45 expression. Y-axis: Mouse CD45.1 expression. Please click here to view a larger version of this figure.
Supplementary Figure S1: Tips for gripping the femur and finding the optimal puncture site. First, fix the femur by holding the arrowhead in the figure with the thumb and index fingers. After that, lightly prick the area circled in red in the figure several times with the needle tip to locate the center of the bone end. While feeling with the fingertips that the direction of the bone is parallel to the angle of entry of the needle, the needle is rotated like a drill as it begins to enter the bone. Please click here to download this File.
Supplementary Figure S2: Tips on body position when performing a mouse's bone marrow puncture (right leg). If the operatory is right-handed, the mouse is to be turned on its back, then slightly rotated to the left side to make the puncture easier. Please click here to download this File.
Supplementary Figure S3: Tips for finding the puncture site quickly. Once the mouse is positioned, the next step is to gently pull on the toe of the mouse to locate the white patellar ligament. Some types of mice may be difficult to recognize, so it is recommended to disinfect the skin with ethanol to make the ligament easier to see. Please click here to download this File.
Supplementary Figure S4: Tips for proper gripping of the femur. Hold the area indicated by the arrowhead in the figure firmly with the thumb and forefinger, pinching the femur. The place to hold it should be a little below the ligament identified in Supplementary Figure S3, feeling the direction of the femur with the fingertips. In fatty mice, it is difficult to grasp the femur, and the fingertips move easily, so it is crucial to hold the femur so that the entire fingertip firmly wraps around the femur. While holding the toes with the right hand, avoid the skin around the knee with the left hand as much as possible so that the ligament can be easily seen. The success rate of intramedullary puncture will vary greatly depending on whether this preparation is done properly. Please click here to download this File.
Supplementary Figure S5: Tips on how to find the optimal puncture site and how to insert the needle. Once the femur is firmly secured with the left index finger and thumb, as shown in Supplementary Figure S1 and Supplementary Figure S4, locate the center of the femoral epiphysis by poking the needle tip over the ligament several times.Once the puncture site is determined, rotate the needle like a drill and slowly advance the needle tip into the bone, feeling that the femur is parallel with the needle to be punctured, which is felt with the fingertips. When the needle tip is firmly in the bone marrow, resistance to the syringe suddenly disappears, which confirms that the needle has entered the bone marrow. Please click here to download this File.
Discussion
Murine xenograft models are important for studying both normal and pathological human hematopoiesis. The BM is the source of hematopoiesis3; therefore, studying hematological diseases requires the successful engraftment of rare human stem cells into the murine BM. So far, transplantation methods such as a tail vein, retroorbital vein, and IF injection have been reported, and it is known that any of these methods can engraft transplanted cells. IF injection is a transplantation method that has been used to ensure the implantation of a very limited number of human-derived cells into immunodeficient mice, and its engraftment rate is very stable compared to other methods6,7,8,9,11. In addition, the utility of direct intrabone marrow transplantation has already been reported in clinical practice5,19.
This procedure can be easily performed at any facility with an anesthesia machine. Regarding the time of the procedure, it is better to get it done as quickly as possible, both to reduce the burden on the mice and for the cells to be harvested. This procedure can be performed in one or both legs, allowing for engraftment and bone marrow analysis of either or both legs. However, because of the strain on the mice, we usually collected from only one leg.
Stabilizing the leg to ensure that the penetration of the bone is possible without movement of the patella and to guarantee finding the same hole a second time when the first needle gets removed is the most critical point to injecting the cells successfully. First, the mouse leg should be placed firmly on the ground, and the femur should be held firmly by both the index finger and thumb. In this way, the area near the patella is immobilized and stabilized. More importantly, the palm holding the femur should be as stable as possible on the ground. In doing this, it is important not to choke the mouse by pushing on it with the hand. Second, once the mouse is secured correctly, the secret to success is to create the entry path with the first needle, keeping an eye on the needle as it is removed, and then insert the second needle. It is advisable to keep the syringe containing the cells in a place that is readily accessible without taking one's eyes off the mouse's lap.
Still, the following points need to be considered when performing an IF injection. Future studies should focus on understanding the potential effects on the structure of the BM or on the type and number of cells that can be harvested from the BM after IF injection.
In rare cases, the bone at the puncture site thickens, and subsequent cell aspiration becomes difficult after 2-3 months of injection. In this case, the BM can be harvested from the non-injected leg. However, the engraftment rate on the opposite femur is generally lower than at the transplanted site6. From our experience, the maximum number of cells that can be safely injected into the BM of a mouse is 5 × 10⁶ cells, and more than that may cause sudden death of the mouse due to symptoms of cellular embolism. Only one case of sudden death was experienced with IF injection of 1 × 10⁷ patient cells, but when the diluent was increased from 20 to 50 µL, and the cells were injected very slowly, there was no issue. However, since there are reports on the capacity of BM20, it is necessary to optimize the number of cells, the amount of suspension medium, and the engraftment to retain the cells in the BM efficiently.
Based on our experience, we believe that the transplantation efficiency of IF injection is at the same level as the efficiency of intravenous transplantation into newborn mice. However, irradiating newborn mice is expected to cause many side effects, such as growth disturbance and early death, which may significantly impact the experimental system. Therefore, we believe that IF injection is an important implantation method for experimental systems that require long-term follow-up of mice. However, it should be understood that there is a discrepancy in cell engraftment in both peripheral blood, bone marrow on the side of the transplant, bone marrow on the opposite side of the transplant, and samples obtained by euthanizing and crushing all bones (typically the sternum, pelvis, femur, tibia, fibula, and spine).
This protocol for BM procedures in mice involves a two-step process that requires perforation of the cortical bone with a first needle followed by cannulation of the orifice with a needle of the same gauge for cell injection.
This step-by-step procedure takes less than 30 s for an experienced researcher if everything is ready to set up. The success rate is extremely close to 100%, although this must be confirmed by assessing engraftment. As described in this paper, if an imaging system can be built to track the cells, the cells can be transplanted and immediately tracked to see how they behave in the body.
If the described protocol is followed, the chances of finding the same hole with the second syringe are close to 100%. If the same spot is found, the second syringe needle can be inserted with little or no resistance felt. If the needle is inserted without resistance, always check for reverse bleeding to confirm that the needle has been inserted into the bone marrow. With experience, it becomes possible to know that the needle has been inserted into the bone marrow without confirming reverse blood flow or feeling a decrease in resistance during needle insertion. To expertise the technique, it is important to use IACUC-approved practice mice under anesthesia or already dead mice before the actual experiments.
There is a report using a pediatric spinal tap needle to efficiently and conveniently inject and sample cells in mice BM with one perforation of the bone12. Although this procedure has the advantage of not requiring a needle change, it is difficult to feel using the fingers whether the needle gets into the BM cavity, and it takes time to complete the procedure overall. Further, generally, these instruments cost more than the standard disposable needle used in this protocol.
IF injections provide an efficient disease model using valuable human samples and contribute significantly to the elucidation of disease states. Seeing is believing, and we believe that the detailed protocols presented in this video are important for the widespread adoption of IF injections or aspirations, which were thought to require specialized skills. We hope that this technique will be more widely used and that the pathophysiology of many diseases will be further elucidated.
For the continuous bone marrow analysis by intrafemoral aspiration, it has been previously reported that it is possible to continuously analyze cells in the BM of mice transplanted with HSPCs intravenously9. However, in this study, we have shown that it is possible to perform IF injection of various types of human-derived cells into immunodeficient mice, which are generally susceptible to stress, and to analyze the cells in the BM (at least every 4 weeks for three times) safely and repeatedly while the mice are still alive.
With respect to flow cytometric staining, before staining the samples, mouse and human Fc blocks must be used to prevent non-specific antibody binding. Fc receptors are found on B cells, monocytes, macrophages, and dendritic cells. They bind antibodies via their constant Fc domain rather than the antigen-specific Fab domain. Such nonspecific reactions of antibodies may lead to false-positive data, which could make interpretation of data difficult.
In summary, we have developed a protocol for successful IF injections using various types of human cells and serial bone marrow analysis of live immunodeficient mice. We do hope that many researchers will use this technique to help elucidate the pathophysiology of various diseases.
Disclosures
R.M. is on the Advisory Boards of Kodikaz Therapeutic Solutions, Orbital Therapeutics, and 858 Therapeutics and is an inventor on a number of patents related to CD47 cancer immunotherapy licensed to Gilead Sciences. R.M. is a co-founder and equity holder of Pheast Therapeutics, MyeloGene, and Orbital Therapeutics.
Acknowledgements
We thank all the members of the Majeti lab for their help, support, encouragement, and inspiration over the years. We acknowledge the Flow Cytometry Core of the Stanford Stem Cell Institute, the Binns Program for Cord Blood Research, and the patients for donating their samples. For human samples, normal donor human bone marrow and peripheral blood cells were obtained fresh from AllCells or the Stanford Blood Center. We thank the Nakauchi lab at Stanford University for donating the pBac-AkaLuc-tdTomato plasmid. Above all, we would like to thank the veterinarians and animal control staff at the Veterinary Service Center at Stanford who take care of our mice. In particular, Mike Alvares, supervisor of the animal center, has been so thorough in his management of the mice that it is no exaggeration to say that without him, our research would not have been possible.
This work was supported by NIH grants 1R01HL142637 and 1R01CA251331, the Stanford Ludwig Center for Cancer Stem Cell Research and Medicine, and the Blood Cancer Discoveries Grant program through The Leukemia & Lymphoma Society, The Mark Foundation for Cancer Research, and The Paul G. Allen Frontiers Group, all to R.M. R.M. is a recipient of a Leukemia and Lymphoma Society Scholar Award. Y.N. was supported by the Nakayama Foundation for Human Science and a Stanford University School of Medicine Dean's Postdoctoral Fellowship. A.E. was supported by the NCI under award F32CA250304, the Advanced Residency Training Program at Stanford, and the American Society of Hematology Scholar Award.
Materials
| Name | Company | Catalog Number | Comments |
|---|---|---|---|
| 1/2 mL Syringe, 27 G | BD | 305620 | https://www.bd.com/en-ca/offerings/capabilities/bd-luer-lok-syringe-with-attached-needle/305620 |
| ACK Lysing Buffer | Qualoty Biological | 118-156-101CS | https://www.qualitybiological.com/product/ack-lysing-buffer/ |
| Biological Irradiator | Kimtron | IC-250 | https://www.kimtron.com/ic-250 |
| Chlorhexidine | Nolvasan | NDC 54771-8701-1 | https://www.zoetisus.com/products/petcare/nolvasan-skin-and-wound-cleanser |
| Ethyl alcohol, proof 190 | Gold Shield | https://goldsd.com/line-card/ | |
| FACSCanto II | (Becton Dickinson and Company (BD), Franklin Lakes, NJ, USA | ||
| Fetal Bovine Serum (FBS) | Omega Scientific | FB-01 | https://www.omegascientific.com/product/fetal-bovine-serum-usda-certified/ |
| Flow cytometer, AriaII | Beckton Dickinson (BD) | cell sorting | |
| IMDM | Gibco | 12440053 | https://www.thermofisher.com/order/catalog/product/12440053 |
| Isoflurane, USP | Dechra | NDC 17033-094-25 | https://www.dechra-us.com/our-products/us/companion-animal/dog/prescription/isoflurane-usp-inhalation-anesthetic |
| NOD.Cg-Prkdcscid Il2rgtm1Wjl/SzJ (NSG) mice | Jackson Laboratory, Bar Harbor, ME, USA | Strain #:005557 | Six- to ten-week-old male or female |
| Ophthalmic ointment, USP | Bausch Lomb | NDC 24208-780-55 | https://www.bausch.com/contentassets/2914df881e4344a 7a202cc5a0673c977/neomycin-and-polymyxin-b-sulfates-gramicidin-ophthalmic-solution.pdf |
| OstiFen Injection (Caprofen) | VetOne | NDC 13985-748-20 | http://vetone.net/Default/CatHeaderPage?id=9534ccca-eac5-4d68-8ad8-46436067587b |
| PBS, pH 7.4 | Homemade | ||
| Penicillin-Streptomycin | Gibco | 15140122 | https://www.thermofisher.com/order/catalog/product/15140122 |
| Povidone-iodine | Betadine | NDC 67618-155-16 | https://www.betadine.com/veterinary-surgical-scrub-and-solution/ |
| TokeOni (in the U.S.) | Sigma-Aldrich | 808350-5MG | AkaLumine-HCl/Akaluc; https://www.sigmaaldrich.com/US/en/product/aldrich/808350 |
| UltraPure 0.5 M EDTA, pH 8.0 | Invitrogen | 15575020 | https://www.thermofisher.com/order/catalog/product/15575020 |
| Engraftment antibody panel (in vivo, mouse bone marrow) | |||
| Antigen | Dilution | ||
| Antigen: Anti-human CD45 Fluorophore: V450 Clone: HI30 | BD Biosciences | 560367 | 1:25 |
| Antigen: Anti-mouse CD45.1 Fluorophore: PE-Cy7 Clone: A20 | eBioscience | 25-0453-81 | 1:50 |
| Antigen:Anti-mouse TER-119 Fluorophore: PE-Cy5 Clone: TER-119 | eBioscience | 15-5921-83 | 1:100 |
| Antigen:Anti-human CD3 Fluorophore: APC-Cy7 Clone: SK7 | BD Biosciences | 341090 | 1:12.5 |
| Antigen:Anti-human CD19 Fluorophore: APC Clone: HIB19 | BD Biosciences | 555415 | 1:25 |
| Antigen:Anti-human CD33 Fluorophore: PE Clone: WM53 | BD Biosciences | 555450 | 1:25 |
| Live/Dead staining | Conc. | ||
| PI | Invitrogen | 1 μg/mL | |
| Compensation beads | |||
| Negative control | BD Biosciences | See instruction for details | |
| Anti-mouse Ig, κ | BD Biosciences | See instruction for details |
References
- Majeti, R., Park, C. Y., Weissman, I. L. Identification of a hierarchy of multipotent hematopoietic progenitors in human cord blood. Cell Stem Cell. 1 (6), 635-645 (2007).
- Wilkinson, A. C., Igarashi, K. J., Nakauchi, H. Haematopoietic stem cell self-renewal in vivo and ex vivo. Nature reviews. Genetics. 132, 1-14 (2020).
- Pinho, S., Frenette, P. S. Haematopoietic stem cell activity and interactions with the niche. Nature Reviews Molecular Cell Biology. 20 (5), 303-320 (2019).
- Méndez-Ferrer, S., et al. Bone marrow niches in haematological malignancies. Nature Reviews. Cancer. 20 (5), 285-298 (2020).
- Frassoni, F., et al. Direct intrabone transplant of unrelated cord-blood cells in acute leukaemia: a phase I/II study. The Lancet. Oncology. 9 (9), 831-839 (2008).
- Mazurier, F., Doedens, M., Gan, O. I., Dick, J. E. Rapid myeloerythroid repopulation after intrafemoral transplantation of NOD-SCID mice reveals a new class of human stem cells. Nature Medicine. 9 (7), 959-963 (2003).
- McKenzie, J. L., Gan, O. I., Doedens, M., Dick, J. E. Human short-term repopulating stem cells are efficiently detected following intrafemoral transplantation into NOD/SCID recipients depleted of CD122+ cells. Blood. 106 (4), 1259-1261 (2005).
- Futrega, K., Lott, W. B., Doran, M. R. Direct bone marrow HSC transplantation enhances local engraftment at the expense of systemic engraftment in NSG mice. Scientific Reports. 6 (1), 23886(2016).
- Chung, Y. R., Kim, E., Abdel-Wahab, O. Femoral bone marrow aspiration in live mice. Journal of Visualized Experiments. (89), e51660(2014).
- Iwano, S., et al. Single-cell bioluminescence imaging of deep tissue in freely moving animals. Science. 359 (6378), 935-939 (2018).
- Sundberg, R. D., Hodgson, R. E. Aspiration of bone marrow in laboratory animals. Blood. 4 (5), 557-561 (1949).
- Schmitz, M., Bourquin, J. -P., Bornhauser, B. C. Alternative technique for intrafemoral injection and bone marrow sampling in mouse transplant models. Leukemia & lymphoma. 52 (9), 1806-1808 (2011).
- Nakauchi, Y., et al. The cell type-specific 5hmC landscape and dynamics of healthy human hematopoiesis and TET2-mutant preleukemia. Blood Cancer Discovery. 3 (4), 346-367 (2022).
- Chan, S. M., et al. Isocitrate dehydrogenase 1 and 2 mutations induce BCL-2 dependence in acute myeloid leukemia. Nature Medicine. 21 (2), 178-184 (2015).
- Zhang, T. Y., et al. IL-6 blockade reverses bone marrow failure induced by human acute myeloid leukemia. Science Translational Medicine. 12 (538), (2020).
- Bak, R. O., et al. Multiplexed genetic engineering of human hematopoietic stem and progenitor cells using CRISPR/Cas9 and AAV6. eLIFE. 6, 27873(2017).
- Nishimura, T., et al. Sufficiency for inducible Caspase-9 safety switch in human pluripotent stem cells and disease cells. Gene Therapy. 27 (10-11), 525-534 (2019).
- Chao, M. P., et al. Human AML-iPSCs reacquire leukemic properties after differentiation and model clonal variation of disease. Cell Stem Cell. 20 (3), 329-344 (2017).
- Okada, M., et al. A prospective multicenter phase II study of intrabone marrow transplantation of unwashed cord blood using reduced-intensity conditioning. European Journal of Haematology. 100 (4), 335-343 (2018).
- Fink, D., et al. Capacity of the medullary cavity of tibia and femur for intra-bone marrow transplantation in mice. PloS One. 14 (11), 0224576(2019).
Reprints and Permissions
