Structural and biochemical studies of human membrane transporters require milligram quantities of stable, intact, and homogeneous protein. Here we describe scalable methods to screen, express, and purify human solute carrier transporters using codon-optimized genes.
Method Article
High-Throughput Expression and Purification of Human Solute Carriers for Structural and Biochemical Studies
In This Article
Summary
Abstract
Solute carriers (SLCs) are membrane transporters that import and export a range of endogenous and exogenous substrates, including ions, nutrients, metabolites, neurotransmitters, and pharmaceuticals. Despite having emerged as attractive therapeutic targets and markers of disease, this group of proteins is still relatively underdrugged by current pharmaceuticals. Drug discovery projects for these transporters are impeded by limited structural, functional, and physiological knowledge, ultimately due to the difficulties in the expression and purification of this class of membrane-embedded proteins. Here, we demonstrate methods to obtain high-purity, milligram quantities of human SLC transporter proteins using codon-optimized gene sequences. In conjunction with a systematic exploration of construct design and high-throughput expression, these protocols ensure the preservation of the structural integrity and biochemical activity of the target proteins. We also highlight critical steps in the eukaryotic cell expression, affinity purification, and size-exclusion chromatography of these proteins. Ultimately, this workflow yields pure, functionally active, and stable protein preparations suitable for high-resolution structure determination, transport studies, small-molecule engagement assays, and high-throughput in vitro screening.
Introduction
Membrane proteins have long been targets for researchers and pharmaceutical industries alike. Of these, the solute carriers (SLCs) are a family of over 400 secondary transporter genes encoded within the human genome1. These transporters are involved in the import and export of numerous molecules, including ions2, neurotransmitters3, lipids4,5,6,7, amino acids8, nutrients9,10,11, and pharmaceuticals12. With such a breadth of substrates, these proteins are also implicated in a range of pathophysiologies through the transport of toxins13, transport of and inhibition by drugs of abuse14,15, or deleterious mutations16. Bacterial homologs have served as prototypes for the fundamental transport mechanism of several SLC families17,18,19,20,21,22,23,24,25. In contrast to human proteins, prokaryotic orthologs are often better expressed in the well-understood Escherichia coli expression system26,27 and are more stable in the smaller detergents which yield well-ordered crystals for X-ray crystallography28. However, sequence and functional differences complicate the use of these distantly-related proteins for drug discovery29,30. Consequently, direct study of the human protein is often needed to decipher the mechanism of action of drugs targeting SLCs31,32,33,34,35. While the recent advances in Cryo-electron Microscopy (Cryo-EM) have enabled structural characterization of SLCs in more native-like conditions36,37, difficulty in expressing and purifying these proteins remains a challenge for developing targeted therapeutics and diagnostics.
To alleviate this challenge, the RESOLUTE consortium (re-solute.eu) has developed resources and protocols for the large-scale expression and purification of human SLC-family proteins38. Starting with codon-optimized genes, we have developed methods for the high-throughput cloning and screening of SLC constructs. These methods were systematically applied to the whole family of SLCs, the genes were cloned into the BacMam viral expression system, and the protein expression was tested in human cell lines39 based on previously described methods for high-throughput cloning and expression testing40. In summary, the SLC gene is cloned from the pDONR221 plasmid into a pHTBV1.1 vector. This construct is subsequently used to transpose the gene of interest into a bacmid vector for transfecting insect cells, which includes a cytomegalovirus promoter and enhancer elements for expression in mammalian cells. The resulting baculovirus can be used to transduce mammalian cells for the expression of the target SLC protein.
We further developed standardized methods for large-scale expression and stable purification of selected SLCs (Figure 1). This protocol includes multiple checkpoints to facilitate effective troubleshooting and minimize variability between experiments. Notably, routine monitoring of protein expression and localization, as well as small-scale optimization of purification conditions for individual targets, were aided by Strep and Green Fluorescent Protein (GFP) tags41,42.
Ultimately, these chemically pure and structurally homogeneous protein samples can be used for structural determination by X-ray crystallography or Cryo-Electron Microscopy (Cryo-EM), biochemical target-engagement assays, immunization for binder generation, and cell-free functional studies via reconstitution into chemically defined liposomes.
Protocol
NOTE: All codon-optimized RESOLUTE SLC genes have been deposited into AddGene43, the links to which are available on the list of RESOLUTE public reagents44. These genes have been cloned into the pDONR221 plasmid and allow direct cloning of the genes into the destination vector using recombination cloning45. To maximize parallelism, bacterial, insect, and mammalian cells are grown in block format for bacmid production (section 3), baculovirus amplification (section 5), and expression testing (section 6), respectively. For these steps, a micro-expression shaker is required to ensure sufficient mixing and aeration.
1. (High-throughput) cloning of SLCs into pHTBV1.1 bacmid
NOTE: The cloning step uses a recombination cloning protocol for efficient cloning and transformation into Escherichia coli (E. coli) using the heat-shock method46. The protocol is designed for high-throughput and parallel cloning of multiple targets or constructs but can be readily adapted to smaller scales.
- In a 96-well plate, add 150 ng of the pDONR221 SLC clone and 100 ng of the pHTBV1.1-C3CGFP-SIII-10H-GTW vector. Bring the reaction volume to 8 µL with 10 mM Tris pH 8.0, and then add 2 µL of the recombination enzyme mix.
- Incubate at room temperature for 1 h, add 1 µL of Proteinase K, and incubate for 30 min at 37 °C.
- Use 4 µL of the reaction mixture to transform 50 µL of chemically competent E. coli MACH-1 cells using the heat-shock method46 and SOC medium for recovery. Plate onto LB-agar containing 5% sucrose, or SOC agar, supplemented with 100 µg/mL ampicillin.
- Identify colonies harboring the pHTBV1.1 vector with the SLC gene insert using appropriate primers (see Table 1) and standard protocols for colony PCR47.
- Purify the recombinant plasmid from single colonies with the gene of interest using a plasmid miniprep kit.
2. Transposition
NOTE: The following steps are used to transpose the SLC genes from the pHTBV1.1 vector into a bacmid for BacMam baculovirus generation in Sf9 cells. Using the heat-shock method46, the pHTBV1.1 vector is transformed into DH10Bac competent E. coli cells, which contain a parent bacmid with a lacZ-mini-attTn7 fusion. Transposition occurs between the elements of the pHTBV1.1 vector and the parent bacmid in the presence of the transposition proteins provided by a helper plasmid48. See Table 2 for the composition of solutions used in this protocol.
- Using 3 µL of 100-200 ng/µL purified pHTBV1.1 vector DNA, transform DH10Bac using the heat-shock method in a 96-well PCR plate. Recover the cells by incubating them in recovery medium for 4-5 h at 37 °C while shaking at 700 rpm in a micro-expression shaker.
- Spread 50 µL of transformed cells onto DH10Bac selection plates. Incubate the plates at 37 °C for 48 h covered with foil.
- Pick a single white colony (containing the recombinant DNA) and streak to dilution. Incubate at 37 °C overnight.
3. High-throughput bacmid production
NOTE: The protocol describes the steps for extracting bacmids using a 96-well bacmid purification kit.
- Inoculate individual white colonies (isolated from the streaked to dilution plates) into wells of a 96-deep-well block, containing 1 mL of 2x LB medium (Table 2).
- Cover with a porous seal and incubate at 37 °C overnight at 700 rpm in a micro-expression shaker.
- Prepare a glycerol stock of the cells by mixing 120 µL of the culture with 30 µL of 60% glycerol in a microtiter plate and store at -80 °C.
- Centrifuge the deep well block at 2,600 × g for 30 min. Decant the supernatant into a suitable container for decontamination. Invert the block and tap gently on a paper towel. Add 250 µL of Solution 1 to each well of the block using a multi-channel pipette.
- Resuspend the pellets; if necessary, use a multi-channel pipette.
- Add 250 µL of Solution 2 to each well and seal with a silicone mat. Invert gently 5x and incubate at room temperature for 10 min. Spin very briefly.
- Add 300 µL of Solution 3 and seal with a silicone mat. Mix gently but thoroughly by inverting 5x.
- Place the sample on ice for 20 min, then centrifuge at 2,600 × g for 30 min at 4 °C.
- Transfer the clear supernatant to a fresh 96-well block. Centrifuge again at 2,600 × g for 30 min at 4 °C.
- In a fresh 96-deep-well block, dispense 0.8 mL of 100% isopropanol per well. Add 0.8 mL of supernatants from the corresponding wells.
- Gently pipette up and down using a pipette, then incubate on ice for 30 min or overnight at 4 °C to yield more bacmid.
- Centrifuge at 2,600 × g for 30 min at 4 °C.
- Inside a biological safety cabinet, spray the outside of the block with 70% ethanol, open the block, and discard the supernatant.
- Add 500 µL of 70% ethanol (v/v) to each well and tap the block gently to wash the pellet. Cover with an adhesive plastic seal and centrifuge at 2,600 × g for 30 min at 4 °C.
- Inside a Biological Safety Cabinet, open the block and discard the supernatant. Tap the block very gently on a paper towel to remove the ethanol. Allow the block to dry either inside the hood for 1-2 h or in a 50 °C oven.
- Add 50 µL of sterile TE buffer to resuspend the bacmid DNA and seal using an adhesive plastic seal. Transfer the contents to a V-bottom microtiter plate. Store the bacmid DNA at 4 °C until the test purification is complete and then store it at -20 °C.
NOTE: While not routinely measured, generally a yield of 500 to 2,000 ng/µL bacmid DNA can be expected. - Use standard colony PCR methods47, and the following vector primers to screen for bacmids successfully incorporating the target gene:
pFBM-fwd caaaatgtcgtaacaactccgc
pFBM-rev tagttaagaataccagtcaatctttcac
NOTE: The amplicon will be approximately 700 bp bigger than the target gene.
4. Transfection
NOTE: These steps are used to transfect Sf9 insect cells with the bacmid produced, which causes the insect cells to generate baculovirus particles (P0).
- Grow Sf9 cells in serum-free insect medium to a density of 2.0-2.4 × 10⁶ cells/mL. Dilute the cells to 2 × 10⁵ cells/mL in serum-free insect medium and dispense 1 mL of the diluted cells into a 24-well tissue culture plate well. Include a transfection-reagent-only as well as a cells-only control. Incubate the plate in a humidified incubator at 27 °C for 1 h to allow cell attachment.
- Mix 38 µL per well of serum-free insect medium with 2 µL per well of the transfection reagent. Dispense 40 µL of the mixture into a 96-well sterile flat-bottom microtiter plate. Add 2 µL of recombinant bacmid DNA at 0.5-2.0 µg/µL, cover the plate, and incubate inside the microbiological safety cabinet for 15 min.
- Add 160 µL of serum-free insect medium into each well of the microtiter plate containing the DNA-transfection reagent mixture.
- Aspirate medium from the cells in step 4.1. Gently, add the 200 µL of bacmid-transfection reagent-medium mixture onto the cells, cover the plate, and incubate for 4 h in a humidified incubator at 27 °C.
- Add 400 µL of serum-free insect medium supplemented with 2% FBS to each well. To reduce evaporation, transfer the plate into a clean plastic bag but do not seal it. Incubate the plate at 27 °C for 72 h in a humidified incubator.
- After 3 days, transfer the media from the plate into a sterile 96-deep-well block and centrifuge at 1,500 × g for 20 min at room temperature. Transfer the clarified supernatant containing P0 baculovirus into a sterile 96-deep-well block and store at 4 °C away from light.
5. BacMam baculovirus amplification
NOTE: The following steps are used to amplify the initial P0 baculovirus to higher titer viral stocks; namely P1, P2, and P3. The final P3 titer is appropriate for transduction and protein expression. For efficiency and parallelism, this protocol uses fixed volumetric ratios for viral amplification, which have been empirically optimized. However, if the subsequently transduced cells do not show GFP fluorescence and increased cell diameter by microscopy or if protein expression fails (see sections 6 and 8), baculovirus amplification should be re-optimized for a low multiplicity of infection at each step after quantifying the baculovirus titer49,50,51,52, and infection monitored by GFP fluorescence microscopy and increased cell diameter53.
- Prepare the P1 virus stock by growing Sf9 cells in serum-free insect medium to a density of 2 × 10⁶ cells/mL, add 2% FBS, and seed the cells in a 24-deep-well block in a final volume of 3 mL per well. Add 120 µL of P0 virus stock to the cells.
- Incubate the block at 27 °C while shaking at 450 rpm in a micro-expression shaker for 66-72 h. Centrifuge the block at 1,500 × g for 20 min at room temperature and harvest the supernatant into 96-deep-well blocks. Store as P1 virus stock at 4 °C away from light.
- Prepare P2 virus stock by infecting 50 mL of Sf9 cells (2 × 10⁶ cells/mL cell density), grown in serum-free insect medium supplemented with 2% FBS, with 250 µL of P1 virus stock. Incubate the cells at 27 °C with shaking at 110 rpm.
- Harvest P2 virus stock after 66-72 h by centrifugation at 1,500 × g for 20 min and store at 4 °C away from light.
- Prepare P3 virus stock by infecting the desired volume of Sf9 cells (2 × 10⁶ cells/mL cell density) with 1:200 (v/v) P2 viral stock. Incubate the cells at 27 °C with shaking at 110 rpm.
- After 66-72 h, centrifuge at 1,500 × g for 20 min and harvest the P3 virus by collecting the supernatant and store at 4 °C, protected from light.
6. Transduction for expression testing
NOTE: The following section describes small-scale expression testing and can be modified for parallel testing of multiple constructs using deep well blocks.
- Prepare a 20% (w/v) polyethylene glycol solution by dissolving 200 g of PEG 10,000 and 12 g of NaCl in 600 mL of double-distilled H2O. Stir and bring to a final volume of 1,000 mL. Autoclave the solution.
- Add 300 µL of harvested P1 virus into the wells of a 24-deep-well block and 75 µL of the PEG solution to each well. Incubate the block in a micro-expression shaker at 18 °C while shaking at 300 rpm for 5 min and store the block at 4 °C overnight.
- Shake the block again at 300 rpm for 30 min at 18 °C and centrifuge the block at 3,000 × g for 45 min. Discard the supernatant using a pipette in a microbiological safety cabinet.
- Prepare suspension-adapted HEK293 cells in HEK293 medium to a density of 2 × 10⁶ cells/mL, and seed 3 mL into each well containing the virus pellet, supplementing with 5 mM sodium butyrate.
- Incubate the block at 30 °C with 8% CO2 while shaking at 200-250 rpm for 72 h.
NOTE: The vendor-recommended CO2 concentrations during cell culture are different for suspension-adapted and ancestral HEK293 cell lines, at 8% and 5%, respectively. - Harvest the cells by centrifugation at 900 × g for 20 min and wash each well with 1 mL of PBS.
NOTE: Aspirate 10 µL of resuspended cells and view the cells under a fluorescence microscope with a GFP-compatible filter cube to assess protein expression and localization. Aspirate 10-15 µL of resuspended cells and run a whole-cell SDS-PAGE gel for in-gel GFP fluorescence detection54. - Centrifuge again at 900 × g for 20 min. Freeze the pellets at -80 °C.
7. High-throughput small-scale test purification
NOTE: The following steps describe a rapid test purification workflow in a 24-well block format for screening the expression levels of individual SLCs. See Table 2 for the composition of solutions used in this protocol.
- Add 1 mL of HT lysis buffer to each well of harvested cells and proceed to sonicate on ice for a total length of 4 min (cycling at 3 s on/15 s off) in 24-well blocks using a 24-head probe.
- Transfer the contents to a 96-deep well block, add 125 µL of detergent stock, and seal with a silicon seal. Rotate the block gently at 4 °C for 1 h. Alternatively, add dodecylmaltoside (DDM) and cholesterol hemisuccinate (CHS) directly to the 24-well blocks and place them on a rocker-shaker at 4 °C.
- Centrifuge the block at 2600 × g for 20 min at 4 °C and transfer the supernatant into a new 96-deep-well block.
- Prepare a 50% stock of high-capacity Strep-Tactin resin preequilibrated with lysis buffer.
- Add 100 µL of resuspended resin stock to each well.
- Cover the block with a silicon seal and rotate at 4 °C for 2 h and then centrifuge very briefly (up to 200 × g) to remove liquid sticking to the cover.
- Place a 96-well filter plate on top of an empty block and transfer the resin/supernatant mix into the filter plate. Rinse the wells of the deep well block with 800 µL of HT wash buffer and transfer to the filter block to collect the maximum amount of resin.
- Allow the buffer to drip through or centrifuge briefly at 200 × g and collect the flowthrough. Place the filter plate on top of a new wash block and wash the resin with 800 µL of HT wash buffer, allowing the buffer to drip through (or centrifuge briefly). Repeat the wash step twice more and centrifuge the block at 500 × g for 3 min to remove the residual HT wash buffer.
- Place the filter plate on top of a 96-well microtiter plate. Add 50 µL of HT elution buffer and incubate with shaking at room temperature for 10 min. Elute samples by centrifuging at 500 × g for 3 min.
- Run 15 µL of the eluted sample on a Coomassie-stained SDS-PAGE gel to check the protein expression. Load the remaining samples of eluent onto a Size Exclusion Chromatography (SEC) or Fluorescence-detection Size Exclusion Chromatography (FSEC) system to evaluate protein monodispersity in DDM/CHS.
8. Transduction for large-scale expression
NOTE: The following steps are the standard RESOLUTE protocol for SLC expression. Individual targets will require further optimization for the expression time, incubation temperature, and concentration of sodium butyrate. Further, we routinely optimize the baculovirus multiplicity of infection by testing various volumetric ratios of the P3 virus used to infect the suspension-adapted HEK293 cells in small-scale experiments. This is time efficient, uses techniques and equipment already at hand, and directly evaluates the desired experimental output. However, this empirical method requires re-optimization with each amplification of the P3 virus, and other methods are available to quantify the baculovirus particles49,50,51,52.
- Scale up the required volume of suspension-adapted HEK293 cells in HEK293 medium.
- Dilute suspension-adapted HEK293 cells to 1 × 10⁶ cells/mL and grow for 24 h (at 170 rpm for 2 L roller bottles and 105 rpm for 3 L roller bottles).
- Add 30 mL of P3 virus per liter of cells and add 5 mM sodium butyrate. Incubate cells at 37 °C for 48 h or at 30 °C for 72 h.
- During and after the incubation period, a Key Step is to examine the cells using brightfield microscopy to check for microbial contamination and cell viability. Assess protein expression and localization using fluorescence microscopy with a GFP-compatible filter cube.
- Harvest the cells by centrifugation at 900 × g for 20 min.
- Wash the cell pellet by resuspending it in 10-15 mL of PBS per liter of cell culture and pellet again at 900 × g for 20 min.
- Snap-freeze the cell pellets in liquid nitrogen and store them at -80 °C.
9. Protein purification
NOTE: The following is the standard RESOLUTE method for SLC purification for 5 L of cell culture. For each SLC target, the optimal detergent must be determined empirically. Prepare base buffer, detergent stock solution, wash, elution, and SEC buffers in advance (Table 2). For a list of the standard detergents tested, see Table 3. ATP and MgCl2 in the wash buffer reduce contamination by heat-shock proteins.
- Day 1
- Thaw the frozen cell pellet in a water bath set to room temperature.
- Prepare solubilization buffer with 135 mL of base buffer and three protease Inhibitor Cocktail tablets. Allow the tablets to dissolve.
- Resuspend the thawed pellet with solubilization buffer. Use 27 mL of solubilization buffer per 10-15 g of cell pellet, add DNase, and pour into an ice-cold Dounce homogenizer. Homogenize the solution by moving the plunger up and down approximately 20x, keeping the homogenizer on ice.
NOTE: The resuspension volume will need to be optimized based on the target protein and the cell pellet mass, which will vary due to the cell density at harvest. Commercial DNase can be added as per the manufacturer's instructions. DNase can also be expressed and purified in-house using established protocols55. - Add detergent stock solution to 1% final concentration.
NOTE: A Key Step to optimizing protein purification is identifying the optimal detergent for SLC solubilization and purification, which must be identified empirically. We have regularly utilized various detergents; each alone and in combination with cholesteryl hemisuccinate, keeping the detergent to CHS mass ratio at 10:1. - Transfer the solubilization mixture to 50 mL conical tubes. Rotate slowly for 1 h at 4 °C.
- Centrifuge the solution at 50,000 × g for 30 min at 4 °C. Collect the supernatant.
- Equilibrate 4-6 mL bed volume of Strep-Tactin resin with the base buffer.
- Add equilibrated resin to the solubilized supernatant and rotate for 2 h at 4 °C.
- Pour the solution into a gravity flow column and allow the solution to flow through.
- Wash the resin with 30x the bed volume of Strep wash buffer in 3 equal volume steps.
- Add 3-5 mL of elution buffer, incubate for 15 min, and collect the eluate. Repeat this step four more times, collecting each elution fraction separately.
NOTE: A Key Step is protein elution from the Strep-Tactin resin, where it is important to incubate for 15 min after each addition of the elution buffer. Typically, the first eluate fraction contains a lower concentration of protein due to the dilution of the elution buffer by the residual wash buffer. Therefore, the first eluate fraction may be discarded if a higher final protein concentration is desired. Alternatively, the protein concentration in all serial elutions may also be analyzed using SDS-PAGE to optimize the protocol. - Measure protein concentration by UV absorbance spectroscopy, combine the desired elution fractions, and add 3C protease at the ratio of 1:5 (w/w) to 1:10 (w/w).
- Rotate slowly overnight at 4 °C.
NOTE: Steps 9.1.12 and 9.1.13 are only necessary if the GFP tag needs removal. If the tag removal is not required, proceed to Step 9.2.4 directly. Alternatively, the protein can be kept at 4 °C overnight to continue the following day. Furthermore, for SLCs with diminished stability, the protease concentration, incubation period, and temperature may need optimization. The 3C protease is active over a wide range of temperatures and allows for optimization best suited for various SLCs.
- Day 2
- Equilibrate 2-4 mL of bed volume of cobalt metal affinity resin with SEC buffer.
- Add equilibrated cobalt metal affinity resin to the overnight 3C reaction mixture and rotate for 1 h at 4 °C.
- Pour the solution into a gravity flow column and collect the flowthrough.
- Concentrate the flowthrough in a 100 kDa cut-off centrifugal filter by spinning at 3,000 × g at 4 °C and gently mix the sample every 5 min until the desired SEC injection volume is reached.
- Equilibrate a dextran-agarose-based size exclusion chromatography column using SEC buffer. The SEC procedure should be carried out at 4 °C (cooled chamber or cold room).
NOTE: Key step: Depending on the oligomeric state of the SLC, a different column, such as an agarose-based size exclusion chromatography column, may be used to perform SEC. - Inject the sample into the sample loop and run the SEC program, with a flow rate such that column pressure is below the column manufacturer's specifications. Using a fraction collector, automatically collect 0.3 mL fractions over the entire SEC run.
- Pool peak fractions, measure UV absorbance, and concentrate in a 100 kDa cut-off centrifugal concentrator to the required volume/concentration by spinning at 3,000 × g at 4 °C.
Results
SLC genes can be cloned from RESOLUTE pDONR plasmids into BacMam vectors for mammalian expression
The described protocols for cloning, expression, and purification have proven successful for many SLC transporters across multiple protein folds. Nevertheless, the procedures include several checkpoints for monitoring progress, allowing for optimization to account for differences in expression, protein folding, lipid- and detergent-dependent stability, and sensitivity to buffer conditions.
Checkpoints during SLC cloning and small-scale expression
In the cloning steps, agarose gel electrophoresis should be used to ensure the correct size of the PCR and digestion products. Similarly, the Gateway and transposition reactions can be validated with a colony PCR reaction (Figure 2A,B). Baculovirus generation can be monitored using standard techniques as necessary49,50,51,52. The initial expression should be done at a small scale, evaluating protein yield by SDS-PAGE (Figure 2B). Similarly, the fraction of green fluorescent cells, total protein expression, and protein localization should be noted using fluorescence microscopy (Figure 2C,D). Protein expression should be optimized for cell type, temperature, time, and the necessity of co-expressing chaperones or complex partners. The expression can be further optimized by modifying the construct to truncate disordered N- and C-termini, based on secondary structure prediction56,57,58, and testing the types and placement of affinity tags. Protein stability should be evaluated at a small scale by FSEC (Figure 2E), SEC-based thermal shift assay (SEC-Ts), and DSF41,42,59,60,61,62. Small molecules, such as substrates and inhibitors, detergents, cholesterol hemisuccinate, lipids, and pH should be tested for improving protein stability considering the protein's function and native subcellular environment and subsequent purification buffers modified accordingly. In both small- and large-scale expression setups, cells should be monitored using microscopy for viability and contamination.
Optimization of transporter purification at large scale
Each step of large-scale protein purification should be evaluated by SDS-PAGE, including in-gel fluorescence to specifically monitor the GFP-tagged protein and enzymatic removal of that tag. In practice, the GFP-tagged SLC-expressing cells appear yellowish-green. After Twin-Strep-tag chromatographic elution, the eluent containing the purified protein appears fluorescent neon-green under white light. Chemically and structurally homogeneous protein should yield a single monodisperse A280 peak during size-exclusion chromatography (Figure 2F,G), and should show a single band on SDS-PAGE. The SDS-PAGE band corresponding to the expected SLC, and any unexpected bands, should be analyzed using tryptic digestion mass-spectrometry. Multiple bands on the SDS-PAGE gel indicate either proteolytic degradation, contaminating proteins, or SDS-resistant oligomers. Contaminating proteins may be removed by increasing the NaCl concentration of the solubilization buffer or changing the affinity tag. Proteolysis can be limited by improving the protein's purity, ensuring all steps are done at 4 °C or on ice, and optimizing the protocol to minimize the time of each step. If the SEC profile has a broad peak, multiple peaks, or large void peak (such as the purple trace of Figure 2F), the construct and purification conditions should be optimized at a small scale using FSEC, SEC-Ts, or DSF41,42,59,60,61,62.
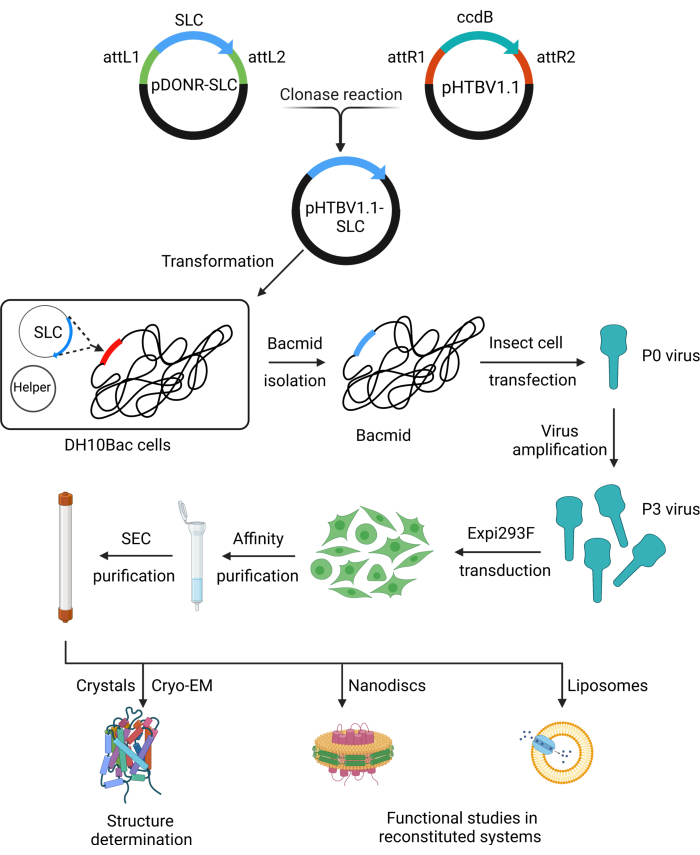
Figure 1: Schematic of RESOLUTE workflow for SLC expression and purification. Step-by-step illustration of recombination cloning, BacMam baculovirus preparation, protein expression and purification, and downstream applications. Abbreviations: SLC = solute carrier; Cryo-EM = cryo-electron microscopy; SEC = size exclusion chromatography. Please click here to view a larger version of this figure.
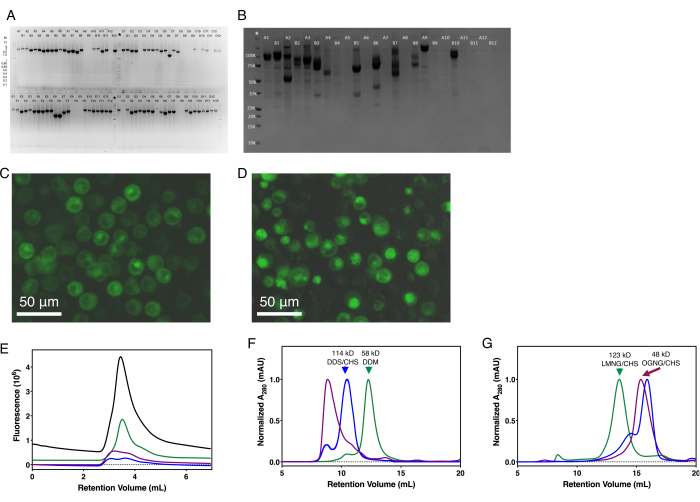
Figure 2: Representative results for SLC expression and purification. (A) Colony PCR of high-throughput SLC cloning into pHTBV1.1-C3CGFP-SIII-10H-GTW. (B) Coomassie-stained SDS-PAGE of single small-scale, parallel expression test of 24 different full-length SLCs. (C) In-cell fluorescence of a GFP-tagged SLC localizing primarily to the plasma membrane. (D) In-cell fluorescence of a GFP-tagged SLC with significant intracellular localization. (E) Representative FSEC traces for four SLCs resolved on a hydrophilic, neutral silica-based UHPLC column. Representative SEC traces for six SLCs purified on either a (F) dextran-agarose or (G) agarose size exclusion chromatography columns. Molecular weights of the SLC complex and detergent used for purification are indicated where the oligomeric state has been experimentally determined. Abbreviations: SLC = solute carrier; GFP = green fluorescent protein; FSEC = fluorescence-detection size exclusion chromatography. Please click here to view a larger version of this figure.
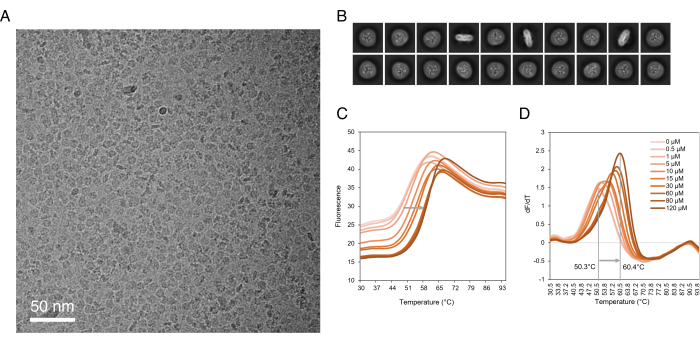
Figure 3: Downstream applications of purified SLCs. (A) Micrograph of SLC1A1 in detergent. (B) 2D class averages of SLC1A1 in detergent. (C) Raw fluorescence of CPM thermal denaturation assay of SLC10A6 incubated with various concentrations of Taurolithocholic acid 3-sulfate. (D) First derivative of CPM thermal denaturation of SLC10A6. The SLC10A6's melting temperature increased by 10 °C in the presence of 120 µM Taurolithocholic acid 3-sulfate. Abbreviations: SLC = solute carrier; CPM = N-[4-(7-diethylamino-4-methyl-3-coumarinyl)phenyl]maleimide. Please click here to view a larger version of this figure.
| Vector Name | Antibiotic markers | Tags for Purification | Screening Primers | bp added during PCR | ||
| pHTBV1.1-C3CGFP-SIII-10H-GTW | AmpR | C-terminal | pHTBV-F (CTATAGACTCTATAGGCACACC) | ~350 | ||
| 3C protease site GFP | ||||||
| Twin-Strep | GFP-R (CTGTCGTACAGATGAACTTCAAGGTC) | |||||
| His10 | ||||||
| pDONR221 | KanR | none | M13 Forward | ~190 | ||
| M13 Reverse | ||||||
Table 1: Plasmids used for RESOLUTE cloning and BacMam generation.
| Solution | Composition |
| DH10Bac selection plates | LB-agar plates containing 50 µg/mL kanamycin, 10 µg/mL tetracycline, 7µg/mL gentamycin, 40 µg/mL IPTG, and 100 µg/mL bluo-gal |
| 2x LB medium (with antibiotics) | 2x LB broth containing 50 µg/mL kanamycin, 10 µg/mL tetracycline, and 7 µg/mL gentamycin |
| HT Lysis buffer | 50 mM HEPES-NaOH, pH 7.5, 250 mM NaCl, 5% glycerol, EDTA-free protease inhibitor |
| HT Wash buffer | 50 mM HEPES-NaOH, pH 7.5, 250 mM NaCl, 5% glycerol, 0.03% DDM/0.003% CHS |
| HT Elution buffer | 50 mM HEPES-NaOH, pH 7.5, 250 mM NaCl, 5% glycerol, 0.03% DDM/0.003% CHS, 100 mM D-Biotin |
| Base buffer | 50 mM HEPES-NaOH, pH 7.5, 150 mM NaCl |
| Detergent stock solution | 10% (w/v) detergent, with or without 1% CHS as appropriate. Mix at 4 °C overnight and store at -20 °C. |
| Strep wash buffer | 50 mM HEPES-NaOH, pH 7.5, 150 mM NaCl, detergent at 3-fold CMC, 10 mM MgCl2, 1 mM ATP |
| Strep elution buffer | 50 mM HEPES-NaOH, pH 7.5, 150 mM NaCl, 100 mM D-Biotin, detergent at 3-fold CMC |
| Size exclusion chromatography (SEC) buffer | 20 mM HEPES-NaOH, pH 7.5, 150 mM NaCl, detergent at 2-fold CMC. Filter through a 0.22 µM membrane. |
| Sodium butyrate | 1 M solution in DPBS, store at -20 °C for long-term use. |
Table 2: A list of solutions used in this protocol and their composition.
| Detergent system | Extraction concentration | Purification concentration (% w/v) |
| DDM | 1% | 0.03% |
| DDM + CHS | 1% + 0.1% | 0.03% + 0.003% |
| DM | 1% | 0.25% |
| DM+CHS | 1% + 0.1% | 0.25% + 0.025% |
| NG | 1% | 0.60% |
| OG | 1.5% | 1.50% |
| LDAO | 1% | 0.07% |
| LDAO + CHS | 1% + 0.1% | 0.07% + 0.007% |
| C12E8 | 1% | 0.015% |
| C12E8 + CHS | 1% + 0.1% | 0.015% + 0.0015% |
| C12E9 + CHS | 1% + 0.1% | 0.01 + 0.001% |
| CYMAL-5 | 1% | 0.40% |
| LMNG | 1% | 0.005% |
| LMNG + CHS | 1% + 0.1% | 0.005% + 0.0005% |
| GDN | 1% | 0.02% |
| Digitonin | 0.05% | |
| OGNG + CHS | 1% + 0.1% | 0.18% + 0.018% |
| C12E10 + CHS | 1% + 0.1% | 0.04% + 0.004% |
| Fos Choline-12 | 1% | 0.14% |
Table 3: Standard detergents used to test membrane solubilization and SLC monodispersity and stability.
Discussion
The development of SLC-targeting therapies has remained hampered due to the absence of systematic characterization of transporter function. This has led to disproportionally fewer drugs targeting this protein class relative to GPCRs and ion channels63, despite their numerous roles in normal and pathophysiological processes. RESOLUTE is an international consortium aimed at developing cutting-edge research techniques and tools to accelerate and improve current SLC research. As a part of RESOLUTE, we have developed these protocols for efficient cloning, construct screening, and large-scale expression and purification of human SLCs.
Here we describe scalable SLC cloning and expression methods that were successfully used to systematically explore the human SLC transporters, including putative and orphan SLCs. Notably, SLCs purified in this manner have been successfully used in subsequent studies of transporter structure, biochemistry, function, binder generation, and small-molecule binding. We regularly employ this method to purify milligram quantities of various SLCs and under optimal conditions, the entire protocol, including the cloning and tissue culture steps, can be completed in 4-5 weeks.
Our method is optimized for economy and parallelism to systematically evaluate multiple targets. However, this high-throughput method is also readily adapted to the parallel generation of constructs for a single target with various truncations or tags by using distinct cloning primers or vectors. This is similar to methods that also optimize multiple constructs for a target64, though our protocol offers further efficiencies with parallel cloning, baculovirus generation, and expression testing. Transfection offers a shorter time between construct cloning and expression by forgoing the baculovirus generation65 but is significantly more expensive and laborious for large-scale expression. In contrast, stable cell lines are likely less expensive for large-scale expression66, but generating highly-expressing clonal cell lines can require more time and specialized resources. Finally, while this protocol uses human cell lines for protein production, insect cells line such as from Spodoptera frugiperda and Trichoplusia ni have also been successfully used for large-scale SLC expression5,31,64. Expression in human cell lines increases media costs but offers more native-like post-translation modifications and lipid environment39,67.
While the protocol can be adapted for different membrane transporters and experimental needs, several factors influence the quality and yield of the purified protein samples. Though it is ideal to study full-length proteins, some degree of sequence truncation may be required to achieve better expression, purification, and reconstitution yields. All RESOLUTE SLC constructs have been tagged with a cleavable GFP, which is valuable in monitoring SLC expression, cellular localization, and purification. The suspension-adapted HEK293 cell expression system used in these experiments has led to superior yields and is recommended, although we routinely also produce proteins without complex glycosylation via the suspension-adapted HEK293 GnTl- cell line. The incubation temperature and length for protein expression by transduced cells should be optimized for each target, though we have found 72 h at 30 °C to be a good default.
All protein purification steps should be carried out on ice or at 4 °C and once the purified protein has been snap-frozen, freeze-thaw cycles should be avoided. The type and amount of the detergents used in membrane solubilization and purification buffers are critical and should be determined for each SLC empirically.
The SLCs purified with this method yield homogeneous and structurally and functionally intact samples, which can be used for a variety of biochemical and biophysical studies. Observing single, discrete particles of the solubilized and purified SLC protein by negative stain and Cryo-EM (Figure 3A,B) can be promising for subsequent structure determination37. The purified SLC in detergent can be used for biophysical assays such as thermal stability assay (Figure 3C,D) to investigate the protein interactions with small molecules such as substrates, inhibitors, or lipids59,62. Finally, the SLCs purified using this protocol in biochemical assays can be reconstituted into liposomes or nanodiscs for functional assays68 and used for antibody and nanobody generation and selection69,70. While it remains a challenge to adapt these methods to the throughput necessary for the discovery of new SLC-targeted small molecules 1, promising advances have been made in the field of in vitro high-throughput screening technologies71,72,73,74.
Disclosures
The authors declare no competing financial interests.
Acknowledgements
This work was performed within the RESOLUTE project. RESOLUTE has received funding from the Innovative Medicines Initiative 2 Joint Undertaking under grant agreement No 777372. This Joint Undertaking receives support from the European Union's Horizon 2020 research and innovation programme and EFPIA. This article reflects only the authors' views and neither IMI nor the European Union and EFPIA are responsible for any use that may be made of the information contained therein. The pHTBV plasmid was kindly provided by Prof. Frederick Boyce (Harvard).
Materials
| Name | Company | Catalog Number | Comments |
|---|---|---|---|
| 3C protease | Produced in-house | ||
| 50 or 100 kDa cut-off centrifugal concentrators | Sartorius | VS0242 | |
| 5-Cyclohexyl-1-Pentyl-β-D-Maltoside | Anatrace | C325 | CYMAL-5 |
| 96-well bacmid purification kit | Millipore | LSKP09604 | Montage Plasmid Miniprep |
| 96-well block (2 mL) | Greiner Bio-One | 780271 | |
| Adhesive plastic seals | Qiagen | 19570 | Tape Pads |
| Agarose size exclusion chromatography column | Cytiva | 29091596 | Superose 6 Increase 10/300 GL |
| Benzonase DNAse | Produced in-house | ||
| BisTris | Sigma Aldrich | B9754 | |
| Cholesteryl Hemisuccinate Tris salt | Anatrace | CH210 | CHS |
| Cobalt metal affinity resin | Takara Bio | 635653 | TALON Metal Affinity Resin |
| D(+)-Biotin | Sigma Aldrich | 851209 | |
| Dextran-agarose size exclusion chromatography column | Cytiva | 28990944 | Superdex 200 Increase 10/300 GL |
| Digitonin | Apollo Scientific | BID3301 | |
| Dounce tissue grinder (40 mL) | DWK Life Sciences | 357546 | |
| EDTA-free protease inhibitor cocktail | Sigma Aldrich | 4693132001 | cOmplete, EDTA-free Protease Inhibitor Cocktail |
| Fetal Bovine Serum | Thermo Fisher | 10500064 | |
| Fos-Choline-12 | Anatrace | F308S | FS-12 |
| Glycerol | Sigma Aldrich | G5516 | |
| Glyco-diosgenin | Anatrace | GDN101 | GDN |
| Gravity flow columns | Cole-Parmer | WZ-06479-25 | |
| HEK293 medium | Thermo Fisher | 12338018 | FreeStyle 293 medium |
| HEPES | Apollo Scientific | BI8181 | |
| Hydrophilic, neutral silica UHPLC column | Sepax | 231300-4615 | Unix-C SEC-300 4.6 x 150 |
| Imidazole | Sigma Aldrich | 56750 | |
| Insect transfection reagent | Sigma Aldrich | 71259 | Reagent |
| Lauryl Maltose Neopentyl Glycol | Anatrace | NG310 | LMNG |
| Magnesium Chloride Hexahydrate | Sigma Aldrich | M2670 | |
| Micro-expression shaker | Glas-Col | 107A DPMINC24CE | |
| NaCl | Sigma Aldrich | S9888 | |
| n-Decyl-β-D-Maltoside | Anatrace | D322 | DM |
| n-Dodecyl-b-D-Maltopyranoside | Anatrace | D310 | DDM |
| n-Dodecyl-N,N-Dimethylamine-N-Oxide | Anatrace | D360 | LDAO |
| n-Nonyl-β-D-Glucopyranoside | Anatrace | N324S | NG |
| n-Octyl-d17-β-D-Glucopyranoside | Anatrace | O311D | OGNG |
| Octaethylene Glycol Monododecyl Ether | Anatrace | O330 | C12E8 |
| Octyl Glucose Neopentyl Glycol | Anatrace | NG311 | OGNG |
| Phosphate Buffered Saline | Sigma Aldrich | D8537 | DPBS |
| Polyoxyethylene(10)dodecyl Ether | Anatrace | AP1210 | C12E10 |
| Polyoxyethylene(9)dodecyl Ether | Anatrace | APO129 | C12E9 |
| Porous seal for tissue culture plates | VWR | 60941-084 | Rayon Films for Biological Cultures |
| Proteinase K | New England Biolabs | P8107S | |
| Recombination enzyme mix | Thermo Fisher | 11791020 | Gateway LR Clonase II |
| Serum-free insect media | Gibco | 10902088 | Sf-900 II serum-free media |
| Sodium Butyrate | Sigma Aldrich | 303410 | |
| Sonicator 24-head probe | Sonics | 630-0579 | |
| Sonicator power unit | Sonics | VCX 750 | |
| Strep-Tactin resin | IBA Life Sciences | 2-5030-025 | Strep-TactinXT 4Flow high- capacity resin |
| Sucrose | Sigma Aldrich | S7903 | |
| Sucrose Monododecanoate | Anatrace | S350 | DDS |
| Suspension-adapted HEK293 cells | Thermo Fisher | A14527 | Expi293F |
| Transfection reagent | Sigma Aldrich | 70967 | GeneJuice Transfection Reagent |
References
- Wang, W. W., Gallo, L., Jadhav, A., Hawkins, R., Parker, C. G. The druggability of solute carriers. Journal of Medicinal Chemistry. 63 (8), 3834-3867 (2020).
- Liao, J., et al. Structural insight into the ion-exchange mechanism of the sodium/calcium exchanger. Science. 335 (6069), 686-690 (2012).
- Bröer, S., Gether, U. The solute carrier 6 family of transporters: the solute carrier family 6. British Journal of Pharmacology. 167 (2), 256-278 (2012).
- Anderson, C. M., Stahl, A. SLC27 fatty acid transport proteins. Molecular Aspects of Medicine. 34 (2-3), 516-528 (2013).
- Nguyen, L. N., et al. Mfsd2a is a transporter for the essential omega-3 fatty acid docosahexaenoic acid. Nature. 509 (7501), 503-506 (2014).
- Kobayashi, N., et al. MFSD2B is a sphingosine 1-phosphate transporter in erythroid cells. Scientific Reports. 8 (1), 4969(2018).
- Kawahara, A., et al. The sphingolipid transporter Spns2 functions in migration of zebrafish myocardial precursors. Science. 323 (5913), 524-527 (2009).
- Kandasamy, P., Gyimesi, G., Kanai, Y., Hediger, M. A. Amino acid transporters revisited: New views in health and disease. Trends in Biochemical Sciences. 43 (10), 752-789 (2018).
- Navale, A. M., Paranjape, A. N. Glucose transporters: physiological and pathological roles. Biophysical Reviews. 8 (1), 5-9 (2016).
- Pajor, A. M. Molecular properties of the SLC13 family of dicarboxylate and sulfate transporters. Pflügers Archiv - European Journal of Physiology. 451 (5), 597-605 (2006).
- Nwosu, Z. C., Song, M. G., Di Magliano, M. P., Lyssiotis, C. A., Kim, S. E. Nutrient transporters: connecting cancer metabolism to therapeutic opportunities. Oncogene. 42 (10), 711-724 (2023).
- Girardi, E., et al. A widespread role for SLC transmembrane transporters in resistance to cytotoxic drugs. Nature Chemical Biology. 16 (4), 469-478 (2020).
- Nigam, S. K. The SLC22 transporter family: a paradigm for the impact of drug transporters on metabolic pathways, signaling, and disease. Annual Review of Pharmacology and Toxicology. 58 (1), 663-687 (2018).
- Cheng, M. H., et al. Insights into the modulation of dopamine transporter function by amphetamine, orphenadrine, and cocaine binding. Frontiers in Neurology. 6, 134(2015).
- Sachkova, A., Doetsch, D. A., Jensen, O., Brockmöller, J., Ansari, S. How do psychostimulants enter the human brain? Analysis of the role of the proton-organic cation antiporter. Biochemical Pharmacology. 192, 114751(2021).
- Lin, L., Yee, S. W., Kim, R. B., Giacomini, K. M. SLC transporters as therapeutic targets: emerging opportunities. Nature Reviews Drug Discovery. 14 (8), 543-560 (2015).
- Yernool, D., Boudker, O., Jin, Y., Gouaux, E. Structure of a glutamate transporter homologue from Pyrococcus horikoshii. Nature. 431 (7010), 811-818 (2004).
- Huang, Y., Lemieux, M. J., Song, J., Auer, M., Wang, D. -N. Structure and mechanism of the glycerol-3-phosphate transporter from Escherichia coli. Science. 301 (5633), 616-620 (2003).
- Yamashita, A., Singh, S. K., Kawate, T., Jin, Y., Gouaux, E. Crystal structure of a bacterial homologue of Na+/Cl--dependent neurotransmitter transporters. Nature. 437 (7056), 215-223 (2005).
- Sauer, D. B., et al. Structural basis for the reaction cycle of DASS dicarboxylate transporters. eLife. 9, 61350(2020).
- Levin, E. J., Quick, M., Zhou, M. Crystal structure of a bacterial homologue of the kidney urea transporter. Nature. 462 (7274), 757-761 (2009).
- Abramson, J., et al. Structure and mechanism of the lactose permease of Escherichia coli. Science. 301 (5633), 610-615 (2003).
- Faham, S., et al. The crystal structure of a sodium galactose transporter reveals mechanistic insights into Na + /sugar symport. Science. 321 (5890), 810-814 (2008).
- Lopez-Redondo, M. L., Coudray, N., Zhang, Z., Alexopoulos, J., Stokes, D. L. Structural basis for the alternating access mechanism of the cation diffusion facilitator YiiP. Proceedings of the National Academy of Sciences. 115 (12), 3042-3047 (2018).
- Mulligan, C., et al. The bacterial dicarboxylate transporter VcINDY uses a two-domain elevator-type mechanism. Nature Structural & Molecular Biology. 23 (3), 256-263 (2016).
- Kermani, A. A. A guide to membrane protein X-ray crystallography. The FEBS Journal. 288 (20), 5788-5804 (2021).
- Carpenter, E. P., Beis, K., Cameron, A. D., Iwata, S. Overcoming the challenges of membrane protein crystallography. Current Opinion in Structural Biology. 18 (5), 581-586 (2008).
- Sonoda, Y., et al. Benchmarking membrane protein detergent stability for improving throughput of high-resolution X-ray structures. Structure. 19 (1), 17-25 (2011).
- Wang, H., et al. Structural basis for action by diverse antidepressants on biogenic amine transporters. Nature. 503 (7474), 141-145 (2013).
- Malinauskaite, L., et al. A mechanism for intracellular release of Na+ by neurotransmitter/sodium symporters. Nature Structural & Molecular Biology. 21 (11), 1006-1012 (2014).
- Sauer, D. B., et al. Structure and inhibition mechanism of the human citrate transporter NaCT. Nature. 591 (7848), 157-161 (2021).
- Qiu, B., Matthies, D., Fortea, E., Yu, Z., Boudker, O. Cryo-EM structures of excitatory amino acid transporter 3 visualize coupled substrate, sodium, and proton binding and transport. Science Advances. 7 (10), eabf5814(2021).
- Canul-Tec, J. C., et al. Structure and allosteric inhibition of excitatory amino acid transporter 1. Nature. 544 (7651), 446-451 (2017).
- Coleman, J. A., Green, E. M., Gouaux, E. X-ray structures and mechanism of the human serotonin transporter. Nature. 532 (7599), 334-339 (2016).
- Han, L., et al. Structure and mechanism of the SGLT family of glucose transporters. Nature. 601 (7892), 274-279 (2022).
- Choy, B. C., Cater, R. J., Mancia, F., Pryor, E. E. A 10-year meta-analysis of membrane protein structural biology: Detergents, membrane mimetics, and structure determination techniques. Biochimica et Biophysica Acta (BBA) - Biomembranes. 1863 (3), 183533(2021).
- Piper, S. J., Johnson, R. M., Wootten, D., Sexton, P. M. Membranes under the magnetic lens: a dive into the diverse world of membrane protein structures using Cryo-EM. Chemical Reviews. 122 (17), 13989-14017 (2022).
- Superti-Furga, G., et al. The RESOLUTE consortium: unlocking SLC transporters for drug discovery. Nature Reviews Drug Discovery. 19 (7), 429-430 (2020).
- Fornwald, J. A., Lu, Q., Boyce, F. M., Ames, R. S. Gene expression in mammalian cells using BacMam, a modified baculovirus system. Baculovirus and Insect Cell Expression Protocols. 1350, 95-116 (2016).
- Mahajan, P., et al. Expression screening of human integral membrane proteins using BacMam. Structural Genomics. 2199, 95-115 (2021).
- Kawate, T., Gouaux, E. Fluorescence-detection size-exclusion chromatography for precrystallization screening of integral membrane proteins. Structure. 14 (4), 673-681 (2006).
- Hattori, M., Hibbs, R. E., Gouaux, E. A fluorescence-detection size-exclusion chromatography-based thermostability assay for membrane protein precrystallization screening. Structure. 20 (8), 1293-1299 (2012).
- Fan, M., Tsai, J., Chen, B., Fan, K., LaBaer, J. A central repository for published plasmids. Science. 307 (5717), 1877-1877 (2005).
- Resolute Public Reagents. , https://re-solute.eu/resources/reagents (2023).
- Hartley, J. L. DNA cloning using in vitro site-specific recombination. Genome Research. 10 (11), 1788-1795 (2000).
- Froger, A., Hall, J. E. Transformation of Plasmid DNA into E. coli using the heat shock method. Journal of Visualized Experiments. (6), 253(2007).
- Bergkessel, M., Guthrie, C. Colony PCR. Methods in Enzymology. 529, 299-309 (2013).
- Luckow, V. A., Lee, S. C., Barry, G. F., Olins, P. O. Efficient generation of infectious recombinant baculoviruses by site-specific transposon-mediated insertion of foreign genes into a baculovirus genome propagated in Escherichia coli. Journal of Virology. 67 (8), 4566-4579 (1993).
- Dulbecco, R., Vogt, M. Some problems of animal virology as studied by the Plaque Technique. Cold Spring Harbor Symposia on Quantitative Biology. 18 (0), 273-279 (1953).
- Hitchman, R. B., Siaterli, E. A., Nixon, C. P., King, L. A. Quantitative real-time PCR for rapid and accurate titration of recombinant baculovirus particles. Biotechnology and Bioengineering. 96 (4), 810-814 (2007).
- Hopkins, R. F., Esposito, D. A rapid method for titrating baculovirus stocks using the Sf-9 Easy Titer cell line. BioTechniques. 47 (3), 785-788 (2009).
- Shen, C. F., Meghrous, J., Kamen, A. Quantitation of baculovirus particles by flow cytometry. Journal of Virological Methods. 105 (2), 321-330 (2002).
- Janakiraman, V., Forrest, W. F., Seshagiri, S. Estimation of baculovirus titer based on viable cell size. Nature Protocols. 1 (5), 2271-2276 (2006).
- Bird, L. E., et al. fluorescent protein-based expression screening of membrane proteins in Escherichia coli. Journal of Visualized Experiments. (95), 52357(2015).
- Biedermann, K., Jepsen, P. K., Riise, E., Svendsen, I. Purification and characterization of a Serratia marcescens nuclease produced by Escherichia coli. Carlsberg Research Communications. 54 (1), 17-27 (1989).
- Cong, Q., Grishin, N. V. MESSA: MEta-Server for protein Sequence Analysis. BMC Biology. 10 (1), 82(2012).
- Jumper, J., et al. Highly accurate protein structure prediction with AlphaFold. Nature. 596 (7873), 583-589 (2021).
- Baek, M., et al. Accurate prediction of protein structures and interactions using a three-track neural network. Science. 373 (6557), 871-876 (2021).
- Mancusso, R., Karpowich, N. K., Czyzewski, B. K., Wang, D. -N. Simple screening method for improving membrane protein thermostability. Methods. 55 (4), 324-329 (2011).
- Majd, H., et al. Screening of candidate substrates and coupling ions of transporters by thermostability shift assays. eLife. 7, e38821(2018).
- Nji, E., Chatzikyriakidou, Y., Landreh, M., Drew, D. An engineered thermal-shift screen reveals specific lipid preferences of eukaryotic and prokaryotic membrane proteins. Nature Communications. 9 (1), 4253(2018).
- Alexandrov, A. I., Mileni, M., Chien, E. Y. T., Hanson, M. A., Stevens, R. C. Microscale fluorescent thermal stability assay for membrane proteins. Structure. 16 (3), 351-359 (2008).
- Santos, R., et al. A comprehensive map of molecular drug targets. Nature Reviews Drug Discovery. 16 (1), 19-34 (2017).
- Goehring, A., et al. Screening and large-scale expression of membrane proteins in mammalian cells for structural studies. Nature Protocols. 9 (11), 2574-2585 (2014).
- Kaipa, J. M., Krasnoselska, G., Owens, R. J., Van Den Heuvel, J. Screening of membrane protein production by comparison of transient expression in insect and mammalian cells. Biomolecules. 13 (5), 817(2023).
- Khanppnavar, B., et al. Structural basis of organic cation transporter-3 inhibition. Nature Communications. 13 (1), 6714(2022).
- Marheineke, K., Grünewald, S., Christie, W., Reiländer, H. Lipid composition of Spodoptera frugiperda (Sf9) and Trichoplusia ni (Tn) insect cells used for baculovirus infection. FEBS Letters. 441 (1), 49-52 (1998).
- Majeed, S., Ahmad, A. B., Sehar, U., Georgieva, E. R. Lipid membrane mimetics in functional and structural studies of integral membrane proteins. Membranes. 11 (9), 685(2021).
- Schenck, S., et al. Generation and characterization of anti-VGLUT nanobodies acting as inhibitors of transport. Biochemistry. 56 (30), 3962-3971 (2017).
- Zimmermann, I., et al. Synthetic single domain antibodies for the conformational trapping of membrane proteins. eLife. 7, e34317(2018).
- Yandrapalli, N., Robinson, T. Ultra-high capacity microfluidic trapping of giant vesicles for high-throughput membrane studies. Lab on a Chip. 19 (4), 626-633 (2019).
- Bazzone, A., Barthmes, M., Fendler, K. SSM-based electrophysiology for transporter research. Methods in Enzymology. 594, 31-83 (2017).
- Maynard, J. A., et al. Surface plasmon resonance for high-throughput ligand screening of membrane-bound proteins. Biotechnology Journal. 4 (11), 1542-1558 (2009).
- Haffke, M., Duckely, M., Bergsdorf, C., Jaakola, V. -P., Shrestha, B. Development of a biochemical and biophysical suite for integral membrane protein targets: A review. Protein Expression and Purification. 167, 105545(2020).
Reprints and Permissions
