Recent technical advances enabled the scaled production of an in vitro platform for drug metabolism and toxicity applications. An all-human 2D+ hepatic system (TV2D+) provides physiologically relevant results using traditional two-dimensional culture methods. This protocol will support end-users in the setup, maintenance, and application of the system.
Method Article
An All-Human Hepatic Culture System for Drug Development Applications
In This Article
Summary
Abstract
Finding a long-term, human-relevant culture model for primary human hepatocytes (PHHs) for pharmacological and toxicological studies remains a challenge. Current in vitro model platforms are often inconvenient and complex, lack phenotypic stability over time, and do not support multiple PHH lots, lacking experimental reproducibility and flexibility. Here, we provide a detailed protocol for the thawing, plating, and maintenance of an all-human 2D+ hepatic system (TV2D+), which takes advantage of standard two-dimensional (2D) culture techniques and equipment while maintaining the longevity and phenotypic stability over time that typically accompany more complex three-dimensional (3D) systems. The results show attachment and percent plateability in TV2D+ as a function of PHH seeding density, as well as stable functionality for at least 2 weeks in culture. A range of PHH seeding densities are assessed to achieve a successful long-term culture. When established properly, the PHHs in TV2D+ organize into hepatocyte colonies, express a hepatic-specific marker, and maintain viability, architectural integrity, and physiologically relevant levels of albumin and urea. This unique combination of attributes makes the TV2D+ system a suitable hepatic model for a variety of pharmacological and toxicological applications.
Introduction
Predicting therapeutic safety and efficacy is an important part of preclinical drug development. However, conventional preclinical in vitro hepatic models are limited in their ability to accurately mimic the in vivo liver cellular microenvironment and maintain hepatocyte functionality and morphology over time. There is a need for models that provide stable metabolic competence for more than 1 week to assess slow-turnover compounds or investigate outcomes associated with sub-acute or chronic exposure. In vivo animal tests often fail to predict drug efficacy and risk due to translational species differences in human hepatic clearance mechanisms1. Current in vitro 2-dimensional (2D) hepatic models, such as traditional primary human hepatocyte (PHH) monoculture or sandwich cultures, lack phenotypic stability and longevity in culture, leading to loss of key hepatocellular function and architectural integrity over time2. An alternative method involves the formation of 3-dimensional (3D) hepatocyte spheroids, offering a more relevant microenvironment versus 2D culture. However, this method is limited by the availability of raw materials, PHH donor-lot selection, reproducibility, and loss of viability with increasing spheroid size3,4,5,6. Multicellular platforms have been introduced whereby PHHs are seeded with feeder cells onto fixed-sized, micropatterned plates. Though these models may enable longer culture times, non-human feeder cells used in these platforms can alter experimental outcomes and limit their application due to innate background contribution to drug clearance and metabolic profiles1,7. The TruVivo all-human 2D+ hepatic system (TV2D+) recently described in Weaver, et al8, was developed to address some of the limitations of traditional, co-culture, and 3D culture methods of PHHs. The non liver feeder cells reduce the interspecies differences in metabolism and paracrine production and provide the support necessary for primary hepatocytes in a reproducible, robust fashion that cannot be provided by corresponding non-parenchymal liver cells from a single donor lot due to limitations in expansion, phenotype, and performance. The feeder cells chosen were able to be consistently expanded before use and lacked the need for transformation or differentiation. As described by Glicklis et al.4 and Khetani et al.5, 3D culture models like hepatocyte spheroids have challenges with reproducibility due to donor variability and maintaining consistency in spheroid size, which affects nutrient diffusion in spheroids greater than 200 µm, leading to decreased viability and functionality. Like 3D spheroid formation, the TV2D+ system relies on self-assembly of PHHs; however, the PHH colonies formed are dispersed over the surface area of the well at a single-cell depth rather than compacted into a single aggregate. This method of culture may be useful to address donor variability, allowing PHHs to be plated, cultured, and maintain basic functionality at various seeding densities. The TV2D+ system may also increase the robustness of user handling due to loss during manipulation or specialized equipment required to perform extended culture in 3D spheroids.
The TV2D+ system combines standard 2D culture with the longevity and phenotypic stability that typically accompany 3D systems. The protocol described herein provides step-by-step directions for users with basic tissue culture skills in laboratories equipped with standard equipment such as biosafety cabinets, centrifuges, and CO2 incubators. Each step in the process is outlined in detail, including media preparation, thawing, plating, and maintenance of the resulting culture system. The protocol also contains a method for determining basic hepatocyte functionality outputs, albumin, and urea, as well as immunofluorescent image analysis for determining PHH attachment for normalization. When established properly, the PHHs in TV2D+ organize into hepatocyte colonies, mimicking the native hepatic morphology, and maintain extended viability, architectural integrity, and physiologically relevant levels of albumin and urea for at least 2 weeks8. Because the system can allow a range of PHH seeding densities, it may be useful in increasing the availability of less plateable PHH lots that have desirable donor characteristics. This combination of accessibility and functionality makes TV2D+ a suitable hepatic model for a variety of pharmacological and toxicological applications.
Protocol
This protocol follows the guidelines of Lifenet Health's ethics committee. The manuscript does not contain any studies with human participants or animal studies performed by any of the authors. All cells were isolated from donor tissue fully consented for research purposes by Lifenet Health.
1. Medium preparation
- Thaw one bottle each feeder cell thawing medium, supplement A, supplement B, and supplement C (see Table of Materials) in a 37 °C water bath or 16-24 h at 4 °C.
- Aliquot the entire bottle (10 mL) of feeder cell thawing medium into a 15 mL or 50 mL conical tube.
NOTE: The size of the cell pellet will be easier to view using a 15 mL conical tube. - Add 4.5 mL of supplement B and 11 mL of supplement A to one bottle of plating medium (75 mL) (see Table of Materials) to make a complete plating medium.
NOTE: Complete plating medium has a concentration of FBS <5% v/v. - Into a separate bottle, add 100 mL of culture medium (see Table of Materials), 1 mL supplement C, and 14 mL supplement A to make a complete culture medium.
NOTE: Complete culture medium has a concentration of FBS <1% v/v - Store remaining supplement C and supplement A at -20 °C until week 2 medium preparation.
NOTE: Repeated freeze-thaw cycles will reduce the shelf life of the supplements. It is recommended to only freeze-thaw one time. - Prior to use, warm 10 mL of feeder cell thawing medium, hepatocyte thawing medium, complete plating medium, and complete culture medium for 20-30 min in a 37 °C water bath.
2. Thawing, counting, and plating human feeder cells (Figure 1A)
- Culture the feeder cells approximately 1 h prior to seeding PHHs. Thaw feeder cells (see Table of Materials) in a 37 °C water bath for 1-2 min.
NOTE: Avoid prolonged exposure (e.g., >2 min) by monitoring thawing and removing the vial when liquid becomes loose in the cryovial when inverted. - Immediately after thawing, place the feeder cells on ice.
- Using aseptic techniques, in a biosafety cabinet (BSC), add freshly thawed cells to 10 mL of feeder cell thawing medium.
- Use a 1000 µL pipette to wash the vial once with 1 mL of cell/thaw medium suspension and collect.
- Spin at 400 x g for 4 min at room temperature (RT).
- Carefully discard the supernatant to not disturb the cell pellet by pipetting or vacuum aspiration. Resuspend cell pellet in 1 mL of complete plating medium and count the feeder cells.
NOTE: Feeder cells can be counted using acridine orange and propidium iodide (AOPI) on an automated cell counter or trypan blue using a hemacytometer. Cell counts may vary depending on technology and user. For best results, count duplicate samples and remain consistent in the chosen methodology. - Dilute the cell suspension to 100,000 cells/mL using the complete plating medium.
- Plate 500 µL (50,000 cells) per well of the diluted cell suspension onto a collagen-coated 24-well plate (see Table of Materials).
- Shake the plate in a North (N)-South (S)-East (E)-West (W) motion by using a back-and-forth motion in the N-S direction 2 times followed by the same motion E-W. Repeat this shaking protocol 2 more times for a total of 3 rounds.
NOTE: Perform shaking using moderate force to avoid splashing on the plate lid while still assisting in cell distribution (please refer to video). - Incubate at 37 °C/5% CO2 for 60 min.
- View feeder cell attachment before proceeding to thawing hepatocytes.
NOTE: Acceptable feeder cell attachment is visually approximately 50% confluent.
3. Thawing, counting, and plating primary human hepatocytes (Figure 1B)
- Following 30 min of feeder cell culture, filter pre-warmed hepatocyte thawing medium through a 0.2 µm polyethersulfone (PES) filter unit.
- Thaw PHHs in a 37 °C water bath for 1-2 min.
NOTE: Avoid prolonged exposure (e.g., >2 min) by monitoring thawing and removing the vial when liquid becomes loose in the cryovial when inverted. - Immediately after thawing, place PHHs on ice.
- In a BSC, pour PHH suspension into the hepatocyte thawing medium.
NOTE: Avoid pipetting PHH cell suspensions when possible. It is most critical to perform no pipetting during the transfer of thawed PHHs from the cryovial to the thawing medium. - Use a 1000 µL pipette to wash the vial 3-4 times by gently pipetting 1 mL of hepatocyte/thaw medium suspension back into the vial and collecting the wash by pouring it back into the thaw medium.
- Cap and gently invert thawed PHH suspension 5 times.
- Spin at 100 x g for 8 min at RT.
- Carefully discard the supernatant to not disturb the cell pellet by pipetting or vacuum aspiration. To the wall of the conical tube, add 3 mL of complete plating medium.
- Rock the conical tube side to side to resuspend the cell pellet.
- Add an additional 5 mL of complete plating medium to the resuspended hepatocytes.
- Count PHHs.
NOTE: PHHs can be counted using AOPI on an automated cell counter or trypan blue using a hemacytometer. Cell counts may vary depending on technology and user. For best results, count duplicate samples and remain consistent in the chosen methodology. - Dilute the cell suspension to the desired seeding density (300,000-600,000 PHHs/mL) using the complete plating medium.
NOTE: Optimal hepatocyte seeding density may vary from lot to lot. The recommended seeding density for a given lot will be provided in the certificate of analysis (COA). Use the below equation to determine hepatocytes/mL for a 24-well plate.

- From the plated feeder cells, remove the medium by pipetting or vacuum aspiration.
NOTE: To ensure the viability of the feeder cells, it is recommended to change no more than 3 wells at a time. - Immediately plate 500 µL (150,000-300,000 cells) per well of the diluted hepatocyte suspension onto the pre-coated collagen 24-well plate containing feeder cells.
- Shake the plate in a N-S-E-W motion by using a back-and-forth motion in the N-S direction 2 times followed by the same motion E-W. Repeat this shaking protocol 2 more times for a total of 3 rounds.
NOTE: Perform shaking using moderate force to avoid splashing on the plate lid while still assisting in cell distribution. - Incubate at 37 °C/5% CO2 for 2-4 h. For the first 60 min of culture, shake the plate every 15 min in N-S-E-W motion as in step 3.15 above.
- Following incubation, remove the plate from the incubator and place it in BSC.
- Shake the plate and remove the complete plating medium by pipetting or vacuum aspiration.
NOTE: To ensure the viability of the culture, it is recommended to change no more than 3 wells at a time. - Immediately add 500 µL of pre-warmed complete culture medium to each well.
4. Maintenance
- Aliquot and pre-warm complete culture medium in a 37 °C water bath for 20-30 min. Approximately 13.5 mL of medium is needed for one 24-well plate.
- Feed cultures daily with 500 µL per well of fresh, pre-warmed complete culture medium.
NOTE: To ensure the viability of the culture, it is recommended to change no more than 3 wells at a time. - Prepare fresh complete culture medium every 7 days.
5. Collection of culture supernatant samples for measurement of albumin and urea
- At days 7, 10, and 14, collect 500 µL of medium from the desired sample well(s) into a microcentrifuge tube(s), as shown in Figure 1C.
- Spin the sample(s) at 320 x g for 10 min at 4 °C to pellet debris.
- Use a pipette to transfer sample supernatant(s) into new microcentrifuge tube(s), avoiding disruption of the pellet.
- Run the samples on the albumin and/or urea assay (see sections 10 and 11, respectively).
NOTE: Samples can be stored at -20 °C to -80 °C for 2 weeks.
6. Staining day I
CAUTION: Fixation buffer contains Paraformaldehyde. Paraformaldehyde can cause eye damage, skin irritation, and organ toxicity. Work in an area with good ventilation and wear appropriate personal protection equipment (PPE).
- Following the collection of medium samples on day 14, add 300 µL of fixation buffer (see Table of Materials) to each well to be stained, as shown in Figure 1C. Stain a minimum of 2 wells.
- Incubate at 4 °C for 20-60 min.
- Prepare 1x permeabilization buffer (see Table of Materials) by adding 5 mL of 10x stock solution to 45 mL of 1x PBS (see Table of Materials).
NOTE: The 1x permeabilization buffer can be stored at 4° C for 1 month. - Wash 2 times with 300 µL of 1x permeabilization buffer on ice.
- Add 300 µL of primary antibody cytokeratin 18 (see Table of Materials) using a 1:1000 dilution in 1x permeabilization buffer on ice.
NOTE: Minimally, incubate one well with 1x permeabilization buffer only for a secondary antibody-only control. - Incubate 16-24 h at 4 °C.
7. Staining day II
- The following day, remove the primary antibody by pipetting or vacuum aspiration.
- Wash 2 times with 300 µL per well of 1x permeabilization buffer on ice.
- Add 300 µL of fluorescent secondary antibody (see Table of Materials) using a 1:500 dilution in 1x permeabilization buffer (include secondary only control).
NOTE: Avoid light when using fluorescent antibodies. - Incubate for 30-45 min at 4 °C in dark.
- Remove the secondary antibody by pipetting or vacuum aspiration.
- Wash 2 times with 300 µL per well of 1x permeabilization buffer on ice.
- Wash 1 time with 300 µL per well of 1x PBS.
- Add 150 µL of 4′,6-diamidino-2-phenylindole (DAPI) mounting medium (see Table of Materials) to each well and incubate for 15 min at RT in the dark.
NOTE: Plate can be wrapped in parafilm and stored at 4 °C in the dark for 1 week. - View under a fluorescent microscope. Capture 5 images of each specific fluorescent channel for each well using the 10x objective lens (ensure one image has a scale bar).
NOTE: DAPI has an excitation/emission of 358 nm/461 nm. Use a fluorescent microscope equipped with the appropriate detection filters for both DAPI and the secondary antibody fluorophore.
8. ImageJ analysis (Figure 2)
NOTE: It is recommended to use ImageJ Version 1.52a or higher.
- Open an image containing a scale bar in ImageJ. Click the Straight Line icon and draw a line to the exact length of the scale bar [Figure 2 (1)]
NOTE: If needed, click the Magnify Glass icon to zoom in or out. - Click on the Analyze tab. Highlight and click Set Scale.
- Change Known Distance to the distance of the scale bar. Change Units of Length to the units of the scale bar. Globally apply the settings by checking Global. Click OK to set the scale.
NOTE: Once this setting is applied, every image opened will show the calculated area of the field of view in units input by the user. - Open a DAPI-only image in ImageJ. Click on the Process tab and highlight Subtract Background. Remove the background 50 pixels at a time until the unstained areas are black.
NOTE: If the image does not contain background, this step is not required. - Click Image tab and highlight Type. Click on 8-bit to make the image grayscale [Figure 2 (2)].
- Threshold the image manually or automatically to include all the DAPI particles (use caution not to manually over the threshold) [Figure 2 (3)]. Click the Image tab and highlight Adjust. Click Threshold. Click Apply when complete.
- Click the Process tab and highlight Binary. Click Watershed.
- Click the Analyze tab and highlight /click Analyze Particles [Figure 2 (4)]. Set the Size to 5-Infinity and Circularity to 0.00-1.00. In the Show drop-down tab, select Outlines. Ensure Display Results, Summarize, and Include Holes are checked. Click OK.
NOTE: The desired particle range can be adjusted if thresholding yields background pixels. - Record the count result as TOTAL DAPI.
- Open a merged Cytokeratin 18/DAPI image in ImageJ.
- Use the Multi-Point [Figure 2 (5)] icon to count all DAPI particles unstained for Cytokeratin 18 manually.
- Record result as FEEDER CELLS. Use the equation below to determine hepatocyte DAPI.
Hepatocyte DAPI = Total DAPI - Feeder Cell DAPI
9. Quantitation of total attached hepatocytes and percent attachment (Plateability)
- Create a scale factor for the 24-well culture area using the equation below. Field of view measurements can be found at the top of each image opened [Figure 2 (2), green box].

- Calculate the total attached hepatocytes using the equation below.
Attached Hepatocytes = Scale factor × Hepatocyte DAPI - Calculate the percent attachment of the hepatocytes using the equation below.

10. Albumin assay
- Measure the albumin production using a sandwich enzyme-linked immunosorbent assay (ELISA) (see Table of Materials) on samples diluted at 1:200.
NOTE: For accuracy, the user confirms that the samples fall within the standard curve linear range. The specified kit provides all materials and instructions to perform the assay. - Normalize sample concentrations to attached hepatocytes using the equation below.

11. Urea assay
CAUTION: Blood urea nitrogen (BUN) acid reagent contains sulfuric acid. The sulfuric acid concentration in the BUN acid reagent is considered corrosive. Do not ingest. Work in an area with good ventilation and wear appropriate PPE.
- Urea synthesis is measured using a modified diacetyl monoxime method (see Table of Materials).
- Dilute 53.3 µL of 75 mg/dL urea into 346.7 µL of complete culture medium to make Standard #1 (100 µg/mL)
- Label tubes 2-8 and use a 1:2 serial dilution to make the urea assay standards (Table 1).
- Add 10 µL of sample or standard to wells of a black-walled, clear bottom 96-well plate (see Table of Materials).
- Add 150 µL of BUN reagent to each well containing sample. Prepare BUN reagent by mixing 1/3 of BUN color reagent with 2/3 BUN acid reagent. Use the equation below to assist in calculations.

BUN color reagent (mL) = Total BUN Reagent Needed × 0.333
BUN acid reagent (mL) = Total BUN Reagent Needed × 0.667 - Incubate plate for 90 min in an oven or incubator at 60 °C.
- Read the plate absorbance immediately at 540 nm and 650 nm.
- Create a standard curve by subtracting blank and background absorbance (650 nm) from all samples and standards. Generate a best-fit line by linear regression analysis.
- Determine unknown sample concentration from the standard curve.
- Normalize the sample concentrations to attached hepatocytes using the equation below.

Results
The overall method of plating, culturing, and basic functionality testing of the hepatic culture system involves common primary cell culture techniques and analysis, as illustrated in Figure 1. Hepatocyte attachment and percent plateability were calculated on day 14 using ImageJ analysis of at least five images of Cytokeratin 18 and DAPI staining per well (Figure 2). Representative images of PHHs cultured with feeder cells are shown in Figure 3. The various hepatic seeding densities showed visual differences of confluence based on seeding density and maintained typical hepatic, cuboidal morphology for 14 days of culture. Images of hepatocyte donor lots A and B were captured for each tested seeding density (Figure 4A). The average percent plateability for donor B (89.04% ± 3.99%, 198,552 ± 49,885 PHHs) was higher than donor A (66.08% ± 6.67%, 146,128 ± 33,063 PHHs) across all seeding densities used (Figure 4B). Donor A had significantly higher percent plateability using 150,000 PHHs/well (76.07% ± 12.87%) compared to 250,000-300,000 PHHs/well (62.75% ± 9.64%). Donor B showed no significant differences in hepatocyte percent plateability. Donor B had the lowest hepatocyte plateability (85.78% ± 13.25%) at the highest seeding density, 300,000 PHHs/well. Similar to donor A, seeding donor B at 150,000 PHHs/well had the highest percent plateability of hepatocytes (94.75% ± 15.07%).
Albumin production and urea synthesis were measured at three time points during the 14-day culture period and normalized to calculated attached hepatocytes. Overall, donor A had increased albumin production compared to donor B (41.32 ± 4.58 µg alb/day/106 PHHs vs. 34.66 ± 10.03 µg alb/day/106 PHHs) (Figure 5). Donors A and B had the highest albumin production seeding hepatocytes at 150,000 PHHs/well, 45.91 ± 5.96 µg alb/day/106 PHHs and 48.67 ± 20.44 µg alb/day/106 PHHs, respectively. No significant differences in albumin production were seen in the seeding densities used. As stated by Baudy et al.3, it is desirable that liver microphysiological systems maintain consistent albumin production and urea synthesis with less than 50% change over 14 days of culture. The coefficient of variation (CV) was calculated by dividing the mean by the standard deviation for days 7, 10, and 14. All samples were run in duplicates. The CV for albumin output over the 14-day culture period at 150,000 PHHs/well was 12.24% for donor A and 37.97% for donor B, less than the 50% criterion desired. A high variance in albumin production was seen in both donor A and donor B when seeded at 250,000 and 300,000 PHHs/well. At these seeding densities, both donors experience a steep decrease in albumin production between days 7, 10, and 14 of culture (CV donor A, 22.49%, and donor B, 45.07%).
Donor B urea synthesis (95.09 ± 18.91 µg urea/day/106) was increased compared to donor A (64.92 ± 4.66 µg urea/day/106 PHHs) when averaging days 7, 10, and 14 PHH lot specific data (Figure 6). Donor B (113.49 ± 37.34 µg urea/day/106 PHHs) and donor A (69.12 ± 17.06 µg urea/day/106 PHHs) had the greatest urea synthesis over a 14-day culture period seeding at a density of 150,000 PHHs/well and 200,000 PHHs/well, respectively. Both donor lots had the lowest urea output and highest CV at 300,000 PHHs/well. No significant differences in urea synthesis were seen in the seeding densities used. The lowest CV for urea synthesis for donor A was seen when cultured at 250,000 PPHs/well (23.11%) and 200,000 PHHs/well for donor B (28.26%). As highlighted by these results, optimal seeding density for a given lot of PHH depends on the level of confluency desired at the time of the assay and the nature of the outcomes that are being measured; higher seeding density may not always correlate with higher signal or dynamic range.
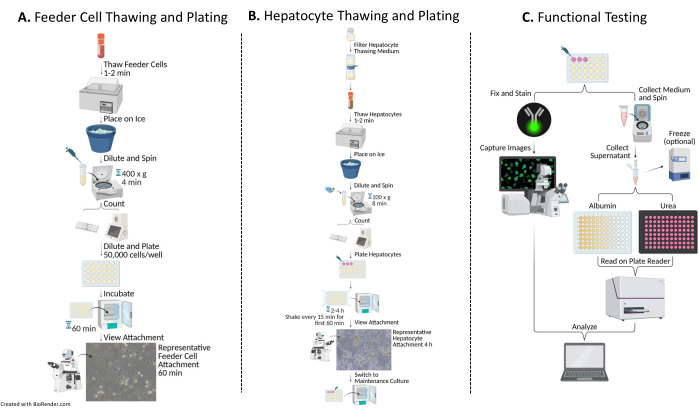
Figure 1: Flow chart of plating, culturing, and functional testing of hepatocytes with feeder cells. (A) Feeder cells are thawed in a specific thawing medium (see Table of Materials), resuspended in a complete plating medium (see Table of Materials), and the cells are counted. The cells are diluted, plated, and incubated for 60 min at 37 °C/5% CO2. (B) Hepatocytes are thawed in a specific thawing medium (see Table of Materials), resuspended in a complete plating medium, and the cells are counted. The hepatocytes are diluted and plated with feeder cells. The cells are incubated for 2-4 h at 37 °C/5% CO2, shaking in a N-S-E-W motion every 15 min for the first 60 min of culture. The plating medium is replaced with a pre-warmed complete culture medium for maintenance of culture (see Table of Materials). The cultures are fed daily. (C) On days 7, 10, and 14, medium samples are collected for albumin and urea testing. Following collection of samples on day 14, the cells are fixed and stained with Cytokeratin 18 (see Table of Materials) antibody 16-24 h at 4 °C. Further, they are incubated in an appropriate secondary antibody, washed, and mounted with DAPI (see Table of Materials) for capturing and image analysis. Please click here to view a larger version of this figure.
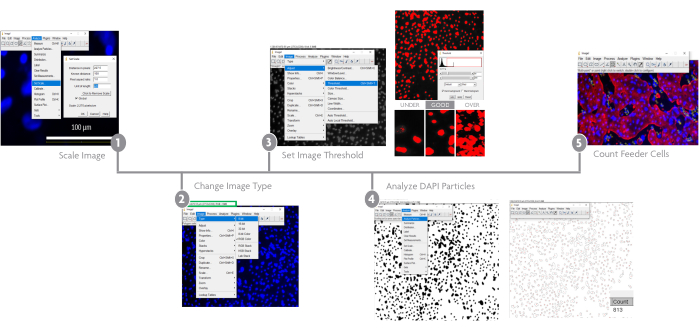
Figure 2: Image analysis using ImageJ software. ImageJ processing of captured images. Step 1: a scale is applied to all images based on the microscope-specific scale bar. Step 2: the image type is changed. Step 3: a threshold limit is applied to select DAPI particles. Step 4: a particle analysis is performed, and the count is recorded. Step 5: to determine the number of attached feeder cells, a merged image is counted using the multi-point tool. Please click here to view a larger version of this figure.
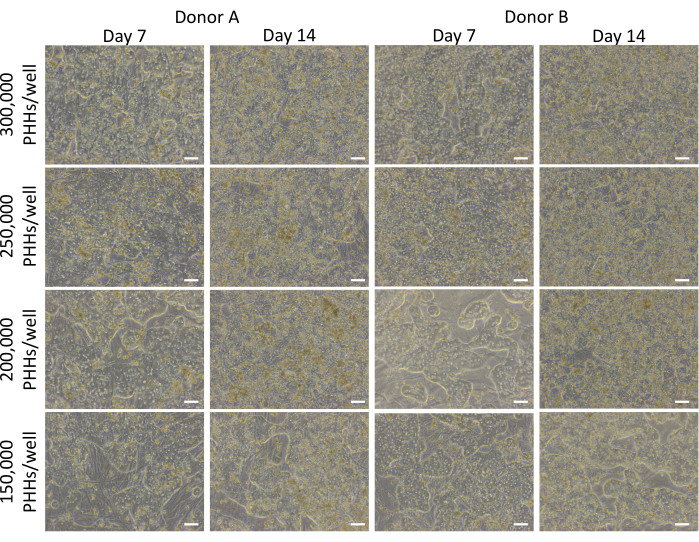
Figure 3: Morphology of various hepatic seeding densities cultured with feeder cells. Representative images on days 7 and 14 of PHHs cultured with feeder cells (50,000 cells/well) at hepatic seeding densities of 150,000, 200,000, 250,000, and 300,000 PHHs/wells. Images were taken using a 10x objective lens on an inverted phase contrast microscope. Scale bar = 100 µm. Please click here to view a larger version of this figure.
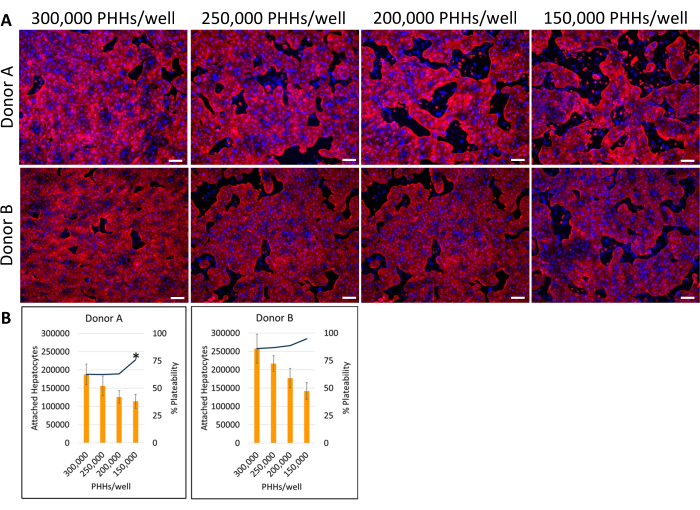
Figure 4: Fluorescent Immunocytochemistry of various hepatic seeding densities cultured with feeder cells. (A) Representative images of Cytokeratin 18 (red) staining on day 14 at hepatic seeding densities of 150,000, 200,000, 250,000, and 300,000 PHHs/wells. Two-wells for each seeding density were fixed for 30 min at 4 °C. Wells were incubated 16-24 h at 4° C with primary antibody at 1:1000. A secondary antibody was used at 1:500 for 30 min at 4 °C in dark. DAPI (blue) nuclear stain was added to wells for 15 min at room temperature. Images were taken using a 10X objective lens on an inverted fluorescent microscope. Scale bar = 100 µm. (B) Calculated attached hepatocytes and percent plateability of various hepatic seeding densities calculated using ImageJ. *p ≤ 0.05, to percent plateability for 200,000, 250,000, and 300,000 PHHs/well. Error bars represent standard deviation (n ≥ 5 images per condition). Please click here to view a larger version of this figure.
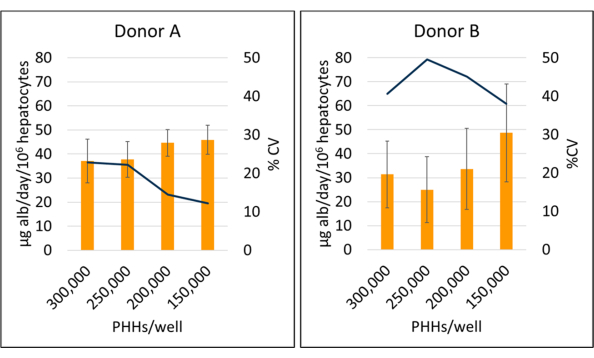
Figure 5: Albumin production of hepatocytes cultured with feeder cells. Albumin production from hepatic seeding densities at 150,000, 200,000, 250,000, and 300,000 PHHs/well. Columns represent the 14-day average of micrograms of albumin/day normalized to total attached hepatocytes. A line represents CV between days 7, 10, and 14. Error bars represent standard deviation (n ≥ 2 wells per condition with replicates). Please click here to view a larger version of this figure.
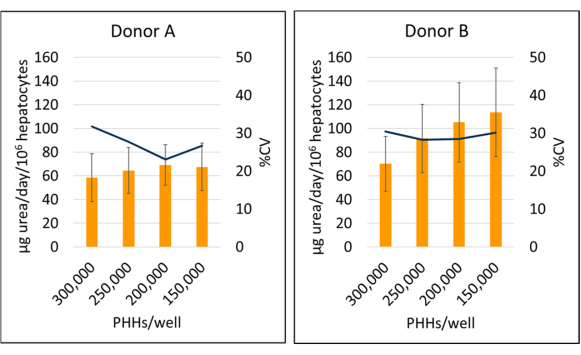
Figure 6: Urea synthesis of hepatocytes cultured with feeder cells. Urea synthesis from hepatic seeding densities at 150,000, 200,000, 250,000, and 300,000 PHHs/well. Columns represent 14-day average of µg urea/day normalized to total attached hepatocytes. A line represents %CV between days 7, 10 and 14. Error bars represent standard deviation (n ≥ 2 wells per condition with replicates). Please click here to view a larger version of this figure.
| Standard (S) # | Concentration (µg/mL) | Urea Solution (µL) | Complete Culture (µL) |
| 1 | 100 | 53.3 75 mg/dL stock | 346.7 |
| 2 | 50 | 100 (S1 solution) | 100 |
| 3 | 25 | 100 (S2 solution) | 100 |
| 4 | 12.5 | 100 (S3 solution) | 100 |
| 5 | 6.26 | 100 (S4 solution) | 100 |
| 6 | 3.125 | 100 (S5 Solution) | 100 |
| 7 | 1.5625 | 100 (S6 Solution) | 100 |
| Blank | 0 | 0 | 100 |
Table 1: Urea standard sample preparation. Using 75 mg/dL stock urea, prepare a 100 µg/mL urea solution. Aliquot the suggested volumes to reach the final concentration for the standard curve.
Discussion
The described hepatic culture system can be established in laboratories that are equipped with standard tissue culture instrumentation. Comprised of PHHs cultured with feeder cells, the system allows the user to culture PHHs for at least two weeks with stable albumin production and urea synthesis. Because of PHH donor lot variability, only pre-screened and qualified PHHs are recommended for use in the system. Although the number of attached PHHs varies based on donor lot and seeding density, the relative plateability remains similar within each donor lot. While recommended seeding densities are advised, the above data suggest hepatocyte seeding density can be adjusted for different experimental needs; however, it should be noted that seeding a greater number of PHHs may not provide higher or more consistent functional outputs. Analysis of the PHH lots evaluated showed the lowest CV for albumin production and urea synthesis using lower seeding densities of 150,000 PHHs/well and 200,000 PHHs/well; however, no significant differences were found between albumin and urea at any seeding density. Higher seeding densities of 250,000 PHHs/well and 300,000 PHHs/well show a greater decrease in albumin and urea over the 14-day culture period. Inherent donor variability in plateability may affect the consistency of albumin production and urea synthesis at 250,000 PHHs/well and 300,000 PHHs/well for the tested donor lots. Similar to large hepatocyte spheroids, overseeding PHHs in the TV2D+ system may have negative effects on the long-term culture and functionality of PHHs.
All steps in thawing, plating, and maintenance are critical for successful culture and data generation; however, there are several common mistakes inexperienced users can avoid. PHHs are highly susceptible to damage secondary to temperature fluctuation, shear stress, and exposure to air9,10. Precautions should be taken when thawing PHHs to avoid prolonged thawing time frames and excessive pipetting. The use of a hand pouring method, a timer, and immediate transfer from water bath to ice will reduce these common errors that can affect the viability and plateability of the PHHs. Additionally, with supply chain issues becoming more commonplace, it may be difficult to obtain collagen-coated plates. Manual coating of tissue culture-treated plates using commercial solutions of collagen type I (5-10 µg/cm2) can be used to overcome this issue; however, for optimal performance and consistency, it is recommended to use pre-coated collagen plates. In the process of transition from feeder cell-only culture to the introduction of PHHs, it is critical to prevent the feeder cell layer from drying. Never allow air exposure to the feeder cells. Any air exposure time may lead to poor feeder cell layer quality, which will negatively impact the long-term culture of PHHs. It is best practice to allow a small amount of residual medium to remain between medium changes. On occasion, PHHs may contain excess debris from isolation, which can make viewing morphology difficult. To help with this issue, shake the plate before a medium change and use vacuum aspiration. Finally, when performing a medium change, carefully aspirate the spent medium, taking care not to disturb the cultured cells. Pipette fresh medium volume down the side of the well to avoid pipetting directly onto the cell layer. The user should also avoid air exposure at every medium change, using the recommended 3-well change (Sections 3 and 4). It should also be noted that a daily medium change is ideal but not required.
Although fluorescent microscopes have become common in most labs, software needed to perform specific image analysis can incur additional expenses. ImageJ can be downloaded for free, making it an easily accessible image analysis tool. The steps in the protocol provide a basis to which the user may need to optimize, specifically particle analysis of DAPI staining; however, in the absence of fluorescent imaging capability, PHH attachment values at day 14 are provided on lot-specific certificates of analysis. Poor thresholding will result in inaccurate counting of the DAPI particles. It is also recommended to check the surface area of individual DAPI particles prior to setting a size exclusion. This can be achieved by using the Oval icon [Figure 2 (1), circle icon below the Edit tab] and drawing a circle that encompasses the DAPI particle. The Analyze tab can then be used to measure the area of the selected DAPI particle. Specific measurements can be selected using the Set Measurements under the Analyze tab [step 8.9 and Figure 2 (4)].
Current methods for culturing PHHs involve the use of coatings such as collagen-I for increasing cell attachment in traditional 2-dimensional monoculture11 or overlaying with an extracellular matrix, like the murine-based Matrigel, a technique commonly referred to as "sandwich culture"12,13,14,15. While the sandwich culture technique improves PHH morphology and polarity over time compared to traditional monoculture, both approaches still lack long-term phenotypic stability in culture for most plateable lots of PHHs. Another method used to culture PHHs is making 3D spheroids; however, as previously stated by Glicklis et al.4, there can be technical challenges with reproducibility of spheroid size due to donor variability. In an effort to make a more physiologically relevant liver model, multicellular models have been developed. As described by Ware et al.7, using micropatterning, murine fibroblasts and primary human liver sinusoid endothelial cells surrounded by PHHs enabled longer in vitro culture times. However, micropatterning can be a complex and time-consuming process, and the non-human feeder cells may contribute to background in metabolic signals, limiting the utility of this platform in certain applications. The use of various non-liver cells, including human and rat dermal fibroblasts and bovine aorta endothelial cells as feeder cells for co-culture of hepatocytes have shown albumin secretion and tight junction formation similar to co-cultures of feeder cells of liver origin16. However, the mechanism of interactions between TV2D+ non-liver feeder cells and the PHHs in culture needs to be further investigated to better understand the influence on the stability and functionality of the PHHs in this system. The culture system previously described by Weaver et al.8 can successfully culture PHHs in hepatic colonies for up to 42 days, forming extensive bile canalicular networks. The PHHs cultured in this system maintained key hepatic functionality, including Cytochrome 1A2, 2B6, and 3A4 activity and Uridine 5′-diphospho-glucuronosyltransferase (UGT)-based enzyme activity, phase I and II metabolite formation, albumin production, and urea synthesis for at least 22 days in vitro with no Matrigel. This culture system produces stable, physiologically relevant outputs that are readily adaptable to any lab for pharmacological and toxicological applications. Although key PHH functions are maintained in the TV2D+ system, no direct comparisons have been made to the 3D spheroid model; however, future work comparing the same PHH donors between the culture systems will prove valuable in determining the limits and advantages of both methods.
Potential applications of TV2D+ include evaluation of metabolic clearance and drug-drug interactions of low-turnover compounds, drug-induced liver injury, and risk assessment of agrochemicals. Accurately predicting hepatic clearance of new and emerging drugs relies on a stable and prolonged PHH culture with retention of key hepatocellular functionality, which is particularly challenging when evaluating low-turnover compounds. Additionally, risk assessment and chemical-induced liver toxicity are major health concerns, and current models do not provide the long-term stability and functionality in culture to accurately evaluate potential chronic chemical toxicity that may be secondary to acute exposure. Healthy and diseased PHHs cultured in TV2D+ showed characteristic differences in function and lipid disposition that were retained over time17. These studies support TV2D+ as a promising tool for a variety of pharmacological and toxicological applications.
Disclosures
JO, LW, EG, EL, SP, and JW are employees of LifeNet Health, the non-profit organization that produces TV2D+.
Acknowledgements
We would like to thank Mellissa Keller and Wendy Hetman for their assistance with manuscript and figure review.
Materials
| Name | Company | Catalog Number | Comments |
|---|---|---|---|
| 0.2 µm PES filter unit | Thermo Fisher Scientific | 565-0020 | User preference |
| 15 mL or 50 mL conical tubes | Thermo Fisher Scientific | 352196 or 352070 | User preference |
| Alexa Fluor 555, goat anti-rabbit | Thermo Fisher Scientific | A-21428 | Other secondary antibodies can work |
| Anti-Cytokeratin 18 antibody | abcam | ab24561 | Necessary using same dilution |
| AOPI | Nexcelom | CS2-0106-5mL | Used for Cellometer counting |
| Biosafety cabinet | Labconoco | 3460801 | User preference |
| Black-walled, clear bottom, 96-well plate | Thermo Fisher Scientific | 165305 | User preference |
| Centrifuge | Thermo Fisher Scientific | Sorvall X4R | Capable of speeds up to 400 x g |
| Collagen coated plate, 24-well | Greiner Bio-One | 662950 | Rat tail collagen coating |
| Counting slides | Nexcelom | CHT4-SD100-002 | Used for Cellometer counting |
| Culture medium | LifeNet Health | MED-TCCM | |
| Culture supplement | LifeNet Health | MED-TCSC | |
| DAPI | Thermo Fisher Scientific | 00-4959-52 | Contains mounting medium |
| DPBS (-Ca, -Mg) | Thermo Fisher Scientific | 14190250 | User preference |
| Feeder cell supplement | LifeNet Health | MED-TCSA | |
| Feeder cell thawing medium | LifeNet Health | MED-FCTM | |
| Fluorescent microscope | Zeiss | AxioObserver Z1 | Equipped with user specific filters |
| Hepatocyte thawing medium | LifeNet Health | MED-HHTM4C-50ML | |
| Human albumin ELISA kit | abcam | ab108788 | Necessary if using same dilution |
| Human feeder cells | LifeNet Health | PHFC24 | |
| Humidified incubator | VWR | 97025-842 | Capable of 5% CO2 |
| IC Fixation buffer | Thermo Fisher Scientific | 00-8222-49 | Paraformaldehyde based, 10% formalin can also be used |
| ImageJ | National Insitute of Health | Version 1.52a | 1.52a or higher |
| Inverted phase contrast microscope | Olympus | CK40-F100 | User preference |
| Microcentrifuge tubes | VWR | 20170-022 | User preference |
| Micropipettes (various sizes) | USA Scientific | ErgoOne | User preference |
| Permeabilization buffer (10x) | Thermo Fisher Scientific | 00-8333-56 | Other permeabilization buffers can work |
| Plate reader | BMG Labtech | CLARIOstar | Capable of reading absorbance 450-640 nm |
| Plating medium | LifeNet Health | MED-TCPM | |
| Plating supplement | LifeNet Health | MED-TCSB | |
| Primary human hepatocytes | LifeNet Health | various | Catalog number may vary based on lot number |
| Secondary antibody | Thermo Fisher Scientific | A-21428 | User preference |
| Serological pipet controller | Gilson | F110120 | User preference |
| Storage bottle 100–500 mL | VWR | 76311-770 | User preference |
| Urea Nitrogen (BUN) Test | Stanbio | 0580-250 | |
| Water bath | PolyScience | WBE05 | Capable for use at 37 °C |
References
- Khetani, S. R., Bhatia, S. N. Microscale culture of human liver cells for drug development. Nature Biotechnology. 26 (1), 120-126 (2008).
- Swift, B., Pfeifer, N. D., Brouwer, K. L. Sandwich-cultured hepatocytes: an in vitro model to evaluate hepatobiliary transporter-based drug interactions and hepatotoxicity. Drug Metabolism Reviews. 42 (3), 446-471 (2010).
- Baudy, A. R., et al. Liver microphysiological systems development guidelines for safety risk assessment in the pharmaceutical industry. Lab on a Chip. 20 (2), 215-225 (2020).
- Glicklis, R., Merchuk, J. C., Cohen, S. Modeling mass transfer in hepatocyte spheroids via cell viability, spheroid size, and hepatocellular functions. Biotechnology and Bioengineering. 86 (6), 672-680 (2004).
- Khetani, S. R., et al. Microengineered liver tissues for drug testing. Journal of Laboratory Automation. 20 (3), 216-250 (2015).
- Monckton, C. P., Brown, G. E., Khetani, S. R. Latest impact of engineered human liver platforms on drug development. APL Bioengineering. 5 (3), 031506(2021).
- Ware, B. R., Durham, M. J., Monckton, C. P., Khetani, S. R. A cell culture platform to maintain long-term phenotype of primary human hepatocytes and endothelial cells. Cellular and Molecular Gastroenterology and Hepatology. 5 (3), 187-207 (2018).
- Weaver, J. R., et al. The morphology, functionality, and longevity of a novel all human hepatic cell-based tri-culture system. Toxicology In Vitro. 86, 105504(2023).
- Li, W., et al. Matrix stiffness and shear stresses modulate hepatocyte functions in a fibrotic liver sinusoidal model. American Journal of Physiology, Gastrointestinal and Liver Physiology. 320 (3), G272-G282 (2021).
- Thompson, S. M., et al. Heat stress induced cell death mechanisms in hepatocytes and hepatocellular carcinoma: in vitro and in vivo study. Lasers in Surgery and Medicine. 46 (4), 290-301 (2014).
- Mooney, D., et al. Switching from differentiation to growth in hepatocytes: control by extracellular matrix. Journal of Cellular Physiology. 151 (3), 497-505 (1992).
- Berthiaume, F., Moghe, P. V., Toner, M., Yarmush, M. L. Effect of extracellular matrix topology on cell structure, function, and physiological responsiveness: hepatocytes cultured in a sandwich configuration. The FASEB Journal. 10 (13), 1471-1484 (1996).
- Hamilton, G. A., et al. Regulation of cell morphology and cytochrome P450 expression in human hepatocytes by extracellular matrix and cell-cell interactions. Cell and Tissue Research. 306 (1), 85-99 (2001).
- Orkin, R. W., et al. A murine tumor producing a matrix of basement membrane. Journal of Experimental Medicine. 145 (1), 204-220 (1977).
- Sivaraman, A., et al. A microscale in vitro physiological model of the liver: predictive screens for drug metabolism and enzyme induction. Current Drug Metabolism. 6 (6), 569-591 (2005).
- Goulet, F., Normand, C., Morin, O. Cellular interactions promote tissue-specific function, biomatrix deposition and junctional communication of primary cultured hepatocytes. Hepatology. 8 (5), 1010-1018 (1988).
- Characterization of primary human hepatocytes from diseased and healthy livers in an all-human cell based triculture system. The Toxicologist, a Supplement to Toxicological Sciences. Odanga, J. J., Breathwaite, E. K., Presnel, S., LeCluyse, E. L., Weaver, J. R. 62nd Annual Meeting & ToxExpo, , Nashville, TN. 4283(2023).
Reprints and Permissions
