A novel motion-based acuity test that allows the assessment of central and peripheral visual processing in low-vision and healthy individuals, along with goggles limiting peripheral vision compatible with MRI protocols, are described here. This method offers a comprehensive vision assessment for functional impairments and dysfunctions of the visual system.
A subscription to JoVE is required to view this content. Sign in or start your free trial.
Method Article
Motion-Acuity Test for Visual Field Acuity Measurement with Motion-Defined Shapes
In This Article
Erratum Notice
Important: There has been an erratum issued for this article. View Erratum Notice
Summary
Abstract
The standard visual acuity measurements rely on stationary stimuli, either letters (Snellen charts), vertical lines (vernier acuity) or grating charts, processed by those regions of the visual system most sensitive to the stationary stimulation, receiving visual input from the central part of the visual field. Here, an acuity measurement is proposed based on discrimination of simple shapes, that are defined by motion of the dots in the random dot kinematograms (RDK) processed by visual regions sensitive to motion stimulation and receiving input also from the peripheral visual field. In the motion-acuity test, participants are asked to distinguish between a circle and an ellipse, with matching surfaces, built from RDKs, and separated from the background RDK either by coherence, direction, or velocity of dots. The acuity measurement is based on ellipse detection, which with every correct response becomes more circular until reaching the acuity threshold. The motion-acuity test can be presented in negative contrast (black dots on white background) or in positive contrast (white dots on black background). The motion defined shapes are located centrally within 8 visual degrees and are surrounded by RDK background. To test the influence of visual peripheries on centrally measured acuity, a mechanical narrowing of the visual field to 10 degrees is proposed, using opaque goggles with centrally located holes. This easy and replicable narrowing system is suitable for MRI protocols, allowing further investigations of the functions of the peripheral visual input. Here, a simple measurement of shape and motion perception simultaneously is proposed. This straightforward test assesses vision impairments depending on the central and peripheral visual field inputs. The proposed motion-acuity test advances the capability of standard tests to reveal spare or even strengthened vision functions in patients with injured visual system, that until now remained undetected.
Introduction
Most of the available visual tests are directed to examine the features processed by central vision, relying on the input deriving from the central retina1. The central retina has the densest cone-photoreceptor population for maximal visual acuity and lacks rod photoreceptors, which dominate the peripheral retina2. The presence of densely packed photoreceptors is also reflected in an increased density of ganglion cells, which means a greater number of axons are directed to the optic nerve and, eventually, to the visual cortex. Outside the fovea towards the periphery, rods outnumber the cone photoreceptor3. With the rods' wider bodies and the sparser mosaic of photoreceptors, the peripheral retina is primarily responsive to night vision and motion awareness4.
Classically, it was believed that visual processing, depending on stimulation of the central part of the visual field, is devoted to the fine analysis of stationary objects, and its peripheral part is specialized in detecting motion and bringing objects to the central, foveal vision, where it is further analyzed5,6. However, now we have emerging evidence showing that on the cortical level, the fine analysis of the stationary pathway is not fully separated from the motion-sensitive one6,7,8. Testing form and motion perception simultaneously is classically performed using moving gratings9 and glass patterns10 and also concentric rings motion11. Our goal is to introduce a test that is close to the normal life of visually disabled people, which can lower their frustrations and give hope by explicitly showing them that some features of their visual processing might still be preserved and even strengthened. The proposed motion-acuity test based on random dot kinematograms (RDKs) combines motion and shape perception analysis and simultaneously tests the functioning of the motion and shape perception. Within the motion-acuity test, there are many possibilities of psychophysical features to test, such as different velocities, directions, and contrasts of the RDKs. By changing the parameters, we can manipulate the strength of stimulation, either specific for the central processing or peripheral. For example, detecting fast-moving objects is a well-described feature specific to peripheral visual processing12, whereas the processing of the darks on the bright background is preferentially processed by central vision13. This test was initially performed on patients with retinal degeneration of photoreceptors, either specifically located within the central or peripheral retina14. Retinitis pigmentosa (RP) is manifested with peripheral damage and prevails in ~1/5000 patients worldwide15. Stargardt disease (STGD), with a prevalence of ~1/10000, is the most common cause of juvenile macular degeneration (MD)16. Damage to the photoreceptors at the central retina, as in macular degeneration or as in retinitis pigmentosa at the peripheral retina, results in corresponding visual field losses. Those visual field losses are reflected in the impairments of the features specific to the given visual system regions17. Importantly, the regions of the visual system that receive inputs from unaffected parts of the retina are also affected. It was previously shown in animal models of macular degeneration18 that after binocular central retinal damage, not only is acuity aggravated, but motion perception, a feature characteristic of peripheral processing, is reinforced. The motion-acuity testing described here provides an important insight for planning visual rehabilitation procedures. A complete view of the interplay between central and peripheral parts of the visual field has a crucial role in understanding how lost functions might be taken over by the spare parts of the visual system and how this process can be supported by visual training rehabilitation procedures. Inline, the knowledge of how regional retinal degeneration affects visual processing, especially beyond its damaged parts, still remains incomplete. Optical tests are based on the measurements of the stationary shape features. For instance, the visual acuity measurements rely on stationary stimuli, either letters (Snellen charts), grating charts, or vernier acuity charts.
For the purpose of widening the insight into the dynamics between central and peripheral vision in healthy eyes and eyes that have impaired central/peripheral visual functions, a motion-based acuity test measuring the shape and motion perception simultaneously was introduced. The motion-acuity test is based on the detection of centrally located shapes in negative or positive contrast (dark or light dots), an ellipse and circle with matching surfaces, built from random dot kinematograms (RDK) and separated from the same RDK background by velocity, coherence, or direction. Acuity is measured as the minimal difference perceived between circle and ellipse dimensions, and the results are given in visual degrees at which the subject stops to perceive the difference. Additionally, to check if the luminance contrast influences the measured motion acuity, stimuli can be presented in negative (black dots on white background) or in positive contrast (white dots on black background). All the available information about positive contrast (ON type) and negative contrast (OFF type) processing in the visual system comes from the stationary stimulation of the central visual field19,20. But how peripheral processing of motion signals depends on contrast remains fairly unknown14,21. It was only established that sensitivity to high velocities is specific for peripheral processing, whereas central motion processing engages slow velocities at higher spatial frequencies presented in positive contrast (ON type)12. The positive and negative contrast versions of the motion-acuity stimuli, as well as the ability to modify the velocity of dots, as well as the coherence or direction, is crucial for a more detailed description of the full visual field. Additionally, a mechanical narrowing of the visual field to central 10 degrees is proposed using goggles with lenses replaced with opaque ones with centrally located holes. This easily replicable narrowing system, suitable for fMRI and TMS protocols, allows further investigations of the functions of the peripheral visual input and how visual peripheries influence centrally measured acuity. A similar system was initially validated in previous studies14, in which it was found that motion acuity tests in negative contrast and in fast motion, strongly activating visual peripheries, are the most difficult for all participants. For patients with Stargardt disease, they were unmanageable. Importantly, attenuation of visual periphery stimulation, by diminishing the velocity of RDKs, improves acuity thresholds in all tested subjects. In conclusion, we propose the task with motion-acuity measurement based on simple shape discrimination. Therefore, the results are straightforward and easy to understand also for patients and their caregivers. The motion-acuity test presented here is also addressed for users outside academia. The task is easy to explain to a broad range of ages and patient groups.
Access restricted. Please log in or start a trial to view this content.
Protocol
All procedures were performed following the relevant guidelines and regulations and were approved by the Ethical Committee, WUM (KB/157/2017). Written consent was obtained from all participants, ensuring that they understood the general aim of the experiment and that they understood the inclusion of their data for statistical analysis purposes. All presented visual stimuli are generated using a Java-based desktop application (Viscacha2) created for the purpose of these experiments.
1. Setup
- Secure a quiet, dimmed room. Build a setup consisting of a computer, a keyboard, a flat display, an eye tracker (optional, depending on the research question and aims; see Table of Materials), a desk, a chinrest, and a chair. Arrange it so that the participants can sit with the chin resting on the chinrest, eyes directly in front of the center of the upper half of the display, and hands reaching the arrow keys on the keyboard. The horizontal distance between the display and the eyes should be 85 cm.
NOTE: Although the participants are trained and specifically asked to fixate the central fixation cross during the entire procedure, testing with an eye tracker may constitute an additional control for filtering during analyses of those participants who exhibit too many fluctuations with their gaze. Moreover, depending on the aim of the study, eye tracker results may provide interesting insight into the fixation patterns, pupil size, or location of interest of different cohorts of participants. - Visit https://github.com/grimwj/Viscacha2 and download the software by clicking the Code button and downloading ZIP. Extract the zip file and save it in the working directory.
- Follow the installation steps described in the README.txt file. In case of testing with an eye tracker, follow the software installation steps for the eye tracker. Mount the eye tracker as per instruction.
- To perform an initial check, run the program by double-clicking the Viscacha2.jar file. After the initial screen is displayed, press ESC on the keyboard to exit the program.
- Navigate through newly created folders – experiment_data, TestPatient, Shape_Brt. Open the .csv file using a spreadsheet editor (set semicolon as field separator). Verify that the parameters, such as screen dimensions and the distance from the screen, are correct.
NOTE: From here, the protocol is based on the assumption that a 1920 x 1080, 31.5 inch display is used and the distance between the patient and the screen is 85 cm. This implies that the screen occupies 44.6° of visual space horizontally. If these parameters cannot be met, one can refer to step 5 for reconfiguring the program.
2. Determining the initial difficulty of the test
- Open the config.txt file and find a line containing patient_name=TestPatient. Replace the TestPatient with a text identifying the subject being examined.
- In the config.txt file, find the line filename=Shape_Brt.txt. Make sure that this line does not begin with a hash symbol # (uncommented line).
- Ask the subject to sit in front of the display, with his/her chin rested and eyes directly in front of the center of the upper half of the display. Verify that the distance from the screen is correct. Make sure that the keyboard keys are easily accessible for the subject to use.
- Navigate to the Viscacha2.jar directory and run the program. Teach the participant to focus the sight on the fixation cross at the center of the screen for the entire duration of the experiment.
- On each side of the screen, either a circle or an ellipse will be presented at the same distance from the central fixation cross. The task is to select the circle over an ellipse using the left and right arrow keys on the keyboard. Explain the task to the participant, and when he/she is ready, press the s key to begin the experiment. The experiment continues till the participant presses one of the arrow keys.
- The program ends after four reversals have occurred or a maximum number of trials has been reached. A reversal occurs when the subject selects the wrong response after previously selecting the correct one or vice versa.
NOTE: This is a staircase-type procedure. The difficulty of each trial increases after each correct response and decreases after a wrong response. Figure 1 displays how the staircase level changes over trials for one representative participant. - Note the four reversals after which the task is finished and the detection threshold has been established. Open the corresponding .csv file containing results. Locate the THRESHOLD columns near the end of the file. Use the value in this column to calculate the initial difficulty for subsequent tasks.
NOTE: The test can also be presented in a constant paradigm, where the level of the difficulty is fixed and does not change, by removing the hash symbol from the Experiment_Type=Constant line in the init.txt files and by adding a hash symbol before the line Experiment_Type=Staircase.
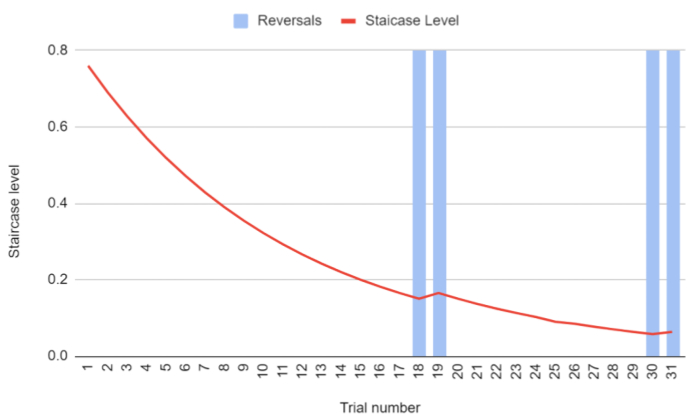
Figure 1: Change in the staircase level over the duration of the Shape_Brt experiment (subsequent trials). The red plot depicts the staircase level, which translates to the aspect ratio of the S- (ellipse). After 4 reversals have occurred (blue bars), the subject’s detection threshold has been established, and the task is finished. Please click here to view a larger version of this figure.
- Use the newly obtained threshold as the baseline for the next stimuli presentation (steps 2.3–2.5). To replace the new threshold in all the stimuli definition files, use the Python script inside the replacer folder and follow the instructions on the screen.
3. Stimuli procedure
NOTE: A total of 10 experiments will be conducted: 5 with white dots on a black background and 5 with black dots on a white background.
- Coherence task
- When the subject is ready, open the config.txt file and comment (i.e., insert the hash symbol) the line filename=Shape_Brt.txt and uncomment the line below, including the shape_dotsB_C.txt task. In this task, the circle and the ellipse consist of dots moving randomly with a velocity of 10°/s. The background is built of dots moving coherently upward with the same velocity as in the circle and ellipse.
NOTE: It is possible to define a different movement direction of the background dots by editing the Direction parameter inside the definition file for each task. - Run Viscacha2.jar. Explain the task to the subject in simple words, for example, Please always point to the circle. When the participant is ready, press the s key to begin the experiment. Wait until the experiment is completed.
- Open the config.txt file, comment the line filename=shape_dotsB_C.txt, and uncomment the line below including the shape_dotsW_C.txt task. Repeat step 3.1.2.
- When the subject is ready, open the config.txt file and comment (i.e., insert the hash symbol) the line filename=Shape_Brt.txt and uncomment the line below, including the shape_dotsB_C.txt task. In this task, the circle and the ellipse consist of dots moving randomly with a velocity of 10°/s. The background is built of dots moving coherently upward with the same velocity as in the circle and ellipse.
- Direction task
- When the subject is ready, open the config.txt file and comment on the previously selected filename. Uncomment the line containing filename=shape_dotsB_D.txt task. In this task, the circle and the ellipse consist of dots moving coherently upward with a velocity of 10°/s. The background consists of dots moving coherently leftward with the same velocity as in the circle and ellipse.
- Run Viscacha2.jar. Explain the task to the subject. When the participant is ready, press the s key to begin the experiment. Wait until the experiment is completed.
- Open the config.txt file, comment the line filename=shape_dotsB_D.txt, and uncomment the line below, including the shape_dotsW_D.txt task. Repeat step 3.2.2.
- Velocity task
- When the subject is ready, open the config.txt file and comment the previously selected filename. Uncomment the line containing filename=shape_dotsB_V10_20.txt task. This task involves three conditions. The circle and ellipse and the background consist of dots moving coherently upward, and dots within the circle and the ellipse always move slower than the background dots: i) 10°/s versus 20°/s; ii) 5°/s versus 10°/s; and iii) 1°/s versus 2°/s.
- Run Viscacha2.jar. Explain the task to the subject. When the participant is ready, press the s key to begin the experiment. Wait until the experiment is completed.
- Open the config.txt file and comment on the line shape_dotsB_V10_20.txt and uncomment the line below, including the shape_dotsW_V10_20.txt task. Repeat step 3.2.2.
- Repeat steps 3.3.1 - 3.3.3 2x, for tasks shape_dotsB_V5_10.txt and shape_dotsW_V5_10.txt, as well as for shape_dotsB_V1_2.txt and shape_dotsW_V1_2.txt.
- To avoid manually changing the filename for each task after the task is done, use a sweep_file option. In the config.txt file, set the sweep_files field to 0 to end the procedure after each task procedure is over.
- Use this setting for the Shape_Brt.txt task to define the initial baseline threshold value. Once the baseline is set, for running multiple tasks in succession, set the sweep file to an integer between 1 and 9. The integer here determines the number of changes between consecutive tasks (e.g., if set to 1 and shape_dotsB_D.txt is uncommented, the program will run this task and the next one. If set to 9, all tasks will be run). Internally, this will result in regenerating a new config file after each experiment is completed, with a previously selected filename commented and the subsequent filename selected for the upcoming experiment.
4. Goggles limiting vision
- To transiently remove the peripheral visual field, use swimming goggles (Figure 2), where transparent lenses are replaced with white opaque ones. The lenses had an aperture of 1.4 mm that limited the visual field to the central 10°. To make the goggles suitable for every subject and to account as best as possible for the natural individual interocular distance, make 14 pairs of goggles with holes spacing from 58 mm to 72 mm (with a step of 1 mm between each pair of goggles).

Figure 2: Narrowing goggles. The central holes have a diameter of 1.4 mm. We had 14 pairs of goggles with distances between holes of 58 mm to 72 mm. Please click here to view a larger version of this figure.
- Use a ruler to define the distance between the participant’s eyes. Place the ruler just above the eyes, in line with the eyebrows, with the value 0 on top of one eye. Calculate how far in mm, is the second pupil by checking the value on top of the second eye. During the procedure, ask the participant to maintain the gaze as stable as possible.
- After the more suitable pair has been chosen, give a break of 15 min. During this time, ask the participants to move freely in the room, use their telephone, or read to let the eyes become accustomed to the new visual condition.
- Start the procedure again from step 3.
5. Reconfiguration
- Screen size and distance calibration
- If a different display is being used, insert the screen dimensions (resolution and diagonal) into the config file (resolution_v for vertical resolution, resolution_h for horizontal resolution, diagonal_inch for the screen diagonal in inches).
- Run Viscacha2.jar. Once the initial screen displays, press ESC to terminate. Open the .csv file containing the results.
- Find the line containing Distance mm text and write down the value.
- Readjust the experimental setup so that the subject can be seated at the newly calculated distance. Calculate the distance so that the screen width occupies 44.6° of visual space horizontally. This is defined by the full_angle_h parameter, which can also be changed in the config.txt file.
NOTE: Calibration can be also performed for screen height using the full_angle_v parameter. Please note that only one of these parameters can be set, the other one has to be commented with a # prefix.
- Stimuli definition
- Define the stimuli parameters in separate files (e.g., shape_dotsB_C.txt). Some values, such as dimensions of the S- (Ellipse_X, Ellipse_Y) are given in pixels. To calculate from pixels to visual degrees, multiply the value by the Pixel to angle multiplier extracted from the csv file containing results.
NOTE: Stimuli parameters, such as the coherence of the dots are predefined and adjustable for each layer (background, shape S+, shape S-, noise). In the coherence task, for example, the circle and the ellipse consist of dots moving randomly with a velocity of 10°/s (coherence = 0.0). The background is built of dots moving coherently upward with the same velocity as in the circle and ellipse (coherence = 1.0). Viscacha2 does not have an official user manual as of yet. For further information regarding the stimuli definition refer to the stimuli_description.ods file in the Viscacha2 repository.
- Define the stimuli parameters in separate files (e.g., shape_dotsB_C.txt). Some values, such as dimensions of the S- (Ellipse_X, Ellipse_Y) are given in pixels. To calculate from pixels to visual degrees, multiply the value by the Pixel to angle multiplier extracted from the csv file containing results.
Access restricted. Please log in or start a trial to view this content.
Results
The motion acuity task generates, for each participant, one result file for each stimuli procedure. An exemplary log file for a test participant has been included in the repository inside the doc folder. From row 1 to row 31, various settings are reported, such as the name of the patient and the configuration settings. The task block starts from row 34 and reports important information necessary for further analysis: event time, event type, trial, duration, selection, correct, success, experimenter, external stimuli, rev...
Access restricted. Please log in or start a trial to view this content.
Discussion
Here, a novel method is described for measuring visual motion acuity using a set of stimuli based on random dot kinematograms. The result is given as a minimal perceived difference between a circle and an ellipse, and it allows one to see when the subject stopped distinguishing shapes from each other. The smaller the difference achieved, the better acuity: it means that the subject can still detect where the circle is, even though it is almost identical to the ellipse. The motion-acuity test presented here brings the res...
Access restricted. Please log in or start a trial to view this content.
Disclosures
The authors have nothing to disclose.
Acknowledgements
The protocol was conducted at the Laboratory of Brain Imaging at the Nencki Institute of Experimental Biology, Warsaw, Poland and was supported by a grant 2018/29/B/NZ4/02435 from the National Science Centre (Poland) awarded to K.B and J.S.
Access restricted. Please log in or start a trial to view this content.
Materials
| Name | Company | Catalog Number | Comments |
|---|---|---|---|
| Chinrest | custom-made | ||
| Computer | Windows 10 or higher | ||
| Display | 1920 × 1080, 31 inches | ||
| EyeLink 1000 Plus | SR Research | desktop mount | |
| USB Keyboard | |||
| USB mouse |
References
- Wells-Gray, E. M., Choi, S. S., Bries, A., Doble, N. Variation in rod and cone density from the fovea to the mid-periphery in healthy human retinas using adaptive optics scanning laser ophthalmoscopy. Eye. 30 (8), 1135-1143 (2016).
- Kolb, H. How the retina works. Am Sci. 91, 28-35 (2003).
- Østerberg, G. Topography of the layer of rods and cones in the human retina. Acta Ophthal. 6, 1(1935).
- Kolb, H. The Organization of the Retina and Visual System. Circuitry for Rod Signals through the Retina. , University of Utah Health Sciences Center. USA. (2011).
- Burnat, K. Are visual peripheries forever young. Neural Plast. 2015, 307929(2015).
- Donato, R., Pavan, A., Campana, G. Investigating the interaction between form and motion processing: A review of basic research and clinical evidence. Front Psychol. 11, 566848(2020).
- Geisler, W. S. Motion streaks provide a spatial code for motion direction. Nature. 400, 65-69 (1999).
- Apthorp, D., et al. Direct evidence for encoding of motion streaks in human visual cortex. Proc Biol Sci. 280, 20122339(2013).
- Kelly, D. H. Moving gratings and microsaccades. J Opt Soc Ame. A, Opt Image Sci. 7 (12), 2237-2244 (1990).
- Glass, L. Moiré effect from random dots. Nature. 223 (5206), 578-580 (1969).
- Tagoh, S., Hamm, L. M., Schwarzkopf, D. S., Dakin, S. C. Motion adaptation improves acuity (but perceived size doesn't matter). J Vis. 22 (11), 2(2022).
- Orban, G. A., Kennedy, H., Bullier, J. Velocity sensitivity and direction selectivity of neurons in areas V1 and V2 of the monkey: influence of eccentricity. J Neurophysiol. 56 (2), 462-480 (1986).
- Rahimi-Nasrabadi, H., et al. Image luminance changes contrast sensitivity in visual cortex. Cell Rep. 34 (5), 108692(2021).
- Kozak, A., et al. Motion based acuity task: Full visual field measurement of shape and motion perception. Transl Vis Sci Technol. 10 (1), 9(2021).
- Cross, N., van Steen, C., Zegaoui, Y., Satherley, A., Angelillo, L. Retinitis pigmentosa: Burden of disease and current unmet needs. Clin Ophthalmol. 16, 1993-2010 (2022).
- Cremers, F. P. M., Lee, W., Collin, R. W. J., Allikmets, R. Clinical spectrum, genetic complexity and therapeutic approaches for retinal disease caused by ABCA4 mutations. Prog Retin Eye Res. 79, 100861(2020).
- Plank, T., et al. matter alterations in visual cortex of patients with loss of central vision due to hereditary retinal dystrophies. Neuroimage. 1556, 65(2011).
- Burnat, K., Hu, T. T., Kossut, M., Eysel, U. T., Arckens, L. Plasticity beyond V1: Reinforcement of motion perception upon binocular central retinal lesions in adulthood. J Neurosci. 37 (37), 8989-8999 (2017).
- Jansen, M., et al. Cortical balance between ON and OFF visual responses is modulated by the spatial properties of the visual stimulus. Cereb Cortex. 29 (1), 336-355 (2019).
- Pons, C., et al. Amblyopia affects the ON visual pathway more than the OFF. J Neurosci. 39 (32), 6276-6290 (2019).
- Luo-Li, G., Mazade, R., Zaidi, Q., Alonso, J. M., Freeman, A. W. Motion changes response balance between ON and OFF visual pathways. Commun Biol. 1, 60(2018).
- Jackson, A., Bailey, I. Visual acuity. Opto Pract. 5, 53-70 (2004).
- Baker, C. I., Peli, E., Knouf, N., Kanwisher, N. G. Reorganization of visual processing in macular degeneration. J Neurosci. 25 (3), 614-618 (2005).
- Gilbert, C. D., Li, W. Adult visual cortical plasticity. Neuron. 75 (2), 250-264 (2012).
- Guadron, L., et al. The saccade main sequence in patients with retinitis pigmentosa and advanced age-related macular degeneration. Invest Ophthalmol Vis Sci. 64 (3), 1(2023).
- Gameiro, R. R., et al. Natural visual behavior in individuals with peripheral visual-field loss. J Vis. 18 (12), 10(2018).
- Sammet, S. Magnetic resonance safety. Abdom Radiol. 41 (3), 444-451 (2016).
- Potok, W., et al. Modulation of visual contrast sensitivity with tRNS across the visual system, evidence from stimulation and simulation. eNeuro. 10 (6), (2023).
- Pearson, J., Tadin, D., Blake, R. The effects of transcranial magnetic stimulation on visual rivalry. J Vis. 7 (7), 1-11 (2007).
Access restricted. Please log in or start a trial to view this content.
Reprints and Permissions
Erratum
Formal Correction: Erratum: Motion-Acuity Test for Visual Field Acuity Measurement with Motion-Defined Shapes
Posted by JoVE Editors on 4/01/2024. Citeable Link.
This corrects the article 10.3791/66272
