Three-dimensional (3D) phase-resolved functional lung (PREFUL) is a functional magnetic resonance imaging (MRI) technique that allows for quantification of regional ventilation of the whole human lung volume, using tidal breathing and contrast-agent free acquisition for 8 min. Here, we present an MR protocol to collect and analyze 3D PREFUL imaging data.
Method Article
Three-Dimensional Phase Resolved Functional Lung Magnetic Resonance Imaging
In This Article
Summary
Abstract
Pulmonary magnetic resonance imaging (MRI) offers a variety of radiation-free techniques tailored to assess regional lung ventilation or its surrogates. These techniques encompass direct measurements, exemplified by hyperpolarized gas MRI and fluorinated gas MRI, as well as indirect measurements facilitated by oxygen-enhanced MRI and proton-based Fourier decomposition (FD) MRI. In recent times, there has been substantial progress in the field of FD MRI, which involved improving spatial/temporal resolution, refining sequence design and postprocessing, and developing a comprehensive whole-lung approach.
The two-dimensional (2D) phase-resolved functional lung (PREFUL) MRI stands out as an FD-based approach developed for the comprehensive assessment of regional ventilation and perfusion dynamics, all within a single MR acquisition. Recently, a new advancement has been made with the development of 3D PREFUL to assess dynamic ventilation of the entire lung using 8 min exam with a self-gated sequence.
The 3D PREFUL acquisition involves employing a stack-of-stars spoiled-gradient-echo sequence with a golden angle increment. Following the compressed sensing image reconstruction of approximately 40 breathing phases, all the reconstructed respiratory-resolved images undergo registration onto a fixed breathing phase. Subsequently, the ventilation parameters are extracted from the registered images.
In a study cohort comprising healthy volunteers and patients with chronic obstructive pulmonary disease, the 3D PREFUL ventilation parameters demonstrated strong correlations with measurements obtained from pulmonary function tests. Additionally, the interscan repeatability of the 3D PREFUL technique was deemed to be acceptable, indicating its reliability for repeated assessments of the same individuals.
In summary, 3D PREFUL ventilation MRI provides a whole lung coverage and captures ventilation dynamics with enhanced spatial resolution compared to 2D PREFUL. 3D PREFUL technique offers a cost-effective alternative to hyperpolarized 129Xe MRI, making it an attractive option for patient-friendly evaluation of pulmonary ventilation.
Introduction
According to the World Health Organization (WHO), chronic respiratory diseases are the third leading cause of death, placing a significant burden on healthcare1. The diagnosis and monitoring of several respiratory diseases involve pulmonary functional tests, which lack spatial information and may not be feasible in young patients. Multiple other nuclear medicine modalities provide spatial measures of ventilation, such as positron emission tomography (PET)2, single-photon emission computed tomography (SPECT)3, or computed tomography4. A significant drawback of these techniques is the usage of ionizing radiation for imaging. Therefore, those measurements are not feasible in sensitive populations like children or for repeated measurements in clinical studies.
Magnetic resonance imaging methods gained interest in the last two decades because they offer radiation free measurement of pulmonary function. Above all, hyperpolarized gas MRI techniques5 have been used for the assessment of pulmonary ventilation in healthy controls and patients with pulmonary disease while achieving a superior signal-to-noise (SNR) ratio when compared to 19F6 or oxygen-enhanced MRI7. The common disadvantages of gas MRI techniques include the requirement for additional personnel, hardware costs, or the need for patient cooperation during the breathold measurement. To address these limitations, methods based on Fourier Decomposition (FD) MRI8 have been introduced for evaluating pulmonary ventilation and perfusion. As an alternative to FD MRI, a phase-resolved functional lung (PREFUL) MRI9 was developed, validated10,11,12, and tested in multiple studies, including multicentre studies13,14. Nevertheless, the 2D acquisition results in long acquisition times for complete lung coverage and limited spatial resolution. An elegant solution is offered by self-gated 3D acquisitions, albeit at the expense of the perfusion information15,16,17. One of these techniques, 3D PREFUL MRI17, has been developed not only to assess static ventilation but also ventilation dynamics during an 8 min MR exam, providing superior image resolution when compared to 2D methods.
Following the original publication describing the method17, the technique's repeatability has been assessed and compared to clinically the well-established spirometric measurements18, and more recently, an accelerated image registration framework has been introduced while improving the repeatability of ventilation parameters and preserving the image quality of ventilation maps19. This patient-friendly and easily scalable technique, capable of quantitatively mapping regional ventilation in the human lung, has the potential to significantly contribute to early detection, diagnosis of respiratory disease, or follow-up monitoring of therapy effects20. These treatment changes in regional lung function, such as improved ventilation volume, have the potential to become biomarkers for assessing the impact of therapies and could be a useful tool in multicenter clinical studies.
The article aims to provide a comprehensive and visual explanation of the 3D PREFUL technology, with the goal of fostering a wider translation of this technique.
Protocol
This study received approval from the ethics committee of Hannover Medical School, ensuring that it adhered to rigorous ethical standards throughout the research process. The investigation strictly followed the guidelines outlined in the Declaration of Helsinki, emphasizing the ethical conduct of medical research. Additionally, informed consent was diligently obtained from all study participants (or their parents or legal guardians) before their participation in the MRI examination.
NOTE: The inclusion/exclusion criteria for studies involving 3D PREFUL MRI vary and depend on the study design. Typically, inclusion criteria for healthy volunteers in a 3D PREFUL MRI examination involve individuals who (a) are free from any significant medical conditions that could affect the study outcomes, (b) are not taking any medications that may interfere with the MRI results, (c) have no claustrophobia, anxiety, metallic implants or devices, (d) meet specific age and gender criteria relevant to the study objectives, (e) have no smoking history, (f) have normal findings of spirometry (FEV1/FVC > 0.7 and both FEV1 and FVC > 80% of predictive value). Exclusion criteria for all study participants undergoing a 3D PREFUL MRI examination may include: (a) pregnancy, (b) have any condition that may compromise the safety or validity of the 3D PREFUL MRI examination, (c) intolerance to gadolinium-based contrast agents when dynamic contrast-enhanced MRI in included in a study protocol.
1. Pre-MRI interview
- Have a medical doctor gather important information regarding the subject's medical history.
- Explain the potential contraindications, risks, and the MRI procedure.
- Obtain written, informed consent from the subject.
NOTE: If no pulmonary function test results are available, request the subject to undergo a pulmonary function test prior to the MRI examination and verify that the obtained results meet the inclusion criteria.
2. Preparation of the radiographer for the MR exam
- Register the subject in the MR console and choose the MR protocol of the study with 3D PREFUL acquisition.
- Verify that the subject, his or her pockets, and clothing are free from metal-containing pieces.
- Place the sheets on the scanner table so that a sterile environment is guaranteed.
- Enter the MR room with the subject.
3. Preparing the subject for the MR exam
- Have the subject lie on the MRI table in a supine position (however, a prone position is possible).
- Make sure that the torso coil provides adequate coverage of the thorax, placing the top element of the torso coil near the subject's chin.
- Provide the subject with headphones (alternatively earplugs or both) to protect hearing from loud MRI-induced noise.
- Provide the subject with a safety button (or an alternate safety mechanism) so that it can be easily accessed and squeezed.
- Place a pad under the subject's head and legs to enhance comfort during the MR exam.
- Place the subject into the MR scanner, using the laser light navigation to make sure that the imaged area occupies the isocentre of the bore.
4. MRI exam
- Localizer
- Perform a localizer sequence (with similar parameters as listed in Table 1A) to obtain low-resolution anatomical images in three planes (with large field-of-view) that will be used to plan the 3D PREFUL exam.
- 3D PREFUL imaging
- Set the acquisition parameters according to Table 1B for imaging acquisition.
- Set the number of radial projections accordingly so that the acquisition takes approximately 8 min.
- Tell the subject to breathe normally (tidal-free breathing) for the whole acquisition.
- Check that the whole thorax is included in the field of view and start the acquisition.
- After the imaging is complete, remove the subject from the scanner.
5. Raw data transfer
- Ordinarily, the acquired raw data is not saved on the MR vendor platform. Save the raw 3D PREFUL kspace data using the vendor-specific steps on the MR console.
6. Data analysis and postprocessing
- Start evaluating the acquired data using the image reconstruction script (Table of Materials) on the designated workstation, e.g., in MATLAB, by setting the path to the raw data.
NOTE: The designated workstation should already have the following packages installed:
(a) The Berkeley Advanced Reconstruction Toolbox (BART)
(b) Advanced Normalization Tools (ANTs) - Image reconstruction
- Estimate the MR system-dependent gradient delays using the calibration projections with the estdelay function implemented in Berkeley advanced reconstruction toolbox (BART)21,22.
- Apply a shift to each projection according to the calculated gradient delay.
- Apply Hanning filtering (using the hann function in MATLAB) to the gradient-delay corrected data using a periodic window in the x-y plane and the z-direction.
- Low-resolution image reconstruction for respiratory binning
- Select one-eight/one-fourth of the k-space data centered around the middle index of the readout/partition dimension.
NOTE: Depending on the subject's size, this step results in a matrix size of 32 x 32 x (12-20). - Reshape the matrices of k-space data and corresponding trajectories to include additional time dimension, with each time point comprising 14 radial projections.
NOTE: Each subsequent time point includes 13 radial projections from the previous time point plus one new successive radial projection. - Utilize the parallel imaging and compressed sensing (pics) command implemented in BART for image reconstruction.
NOTE: Apply L2 norm (λ = 0.1) and total variation (λ = 0.0001) regularization in the spatial domain and total variation (λ = 0.01) regularization in the time domain.
- Select one-eight/one-fourth of the k-space data centered around the middle index of the readout/partition dimension.
- Extraction of the respiratory gating signal
- Segment the lung parenchyma in each reconstructed low-resolution 3D image using Otsu's thresholding23, and calculate the lung parenchyma volume for each time point.
- Apply a low-pass filter with a cutoff frequency of 0.7 Hz to the extracted volume time series and calculate the breathing frequency.
- Exclude extreme outliers from the time series (time points above the 95th percentile and below the 10th percentile).
NOTE: Arranging the time series by their amplitude and phase allows to reconstruct a single respiratory cycle.
- Perform fast Fourier transform (FFT, fft function in MATLAB) on the hanning-filtered data along the slice direction to enable slice-by-slice image reconstruction.
- Reshape the k-space data matrix based on the extracted time series so that each respiratory bin contains a minimum of 100 spokes.
- Utilize 20% of projections from adjacent bins to enhance the SNR24,25 of each respiratory bin.
- Reshape the k-space trajectories matrix to match the size of the k-space data.
- Execute the pics command for image reconstruction for each slice.
NOTE: Apply L2 norm (λ = 0.1) and total variation (λ = 0.0001) regularization in the spatial domain and total variation (λ = 0.01) regularization in the time domain. - Save the variables, including the reconstructed images of one complete respiratory cycle, breathing frequency, and acquisition times, in a .mat file.
- Image registration
- Invert the signal intensities of the reconstructed images.
- Register the images to a selected respiratory state, such as inspiration, using non-rigid registration.
NOTE: To improve the registration accuracy, a group-oriented approach26 may be employed. The registration process can be executed on either CPU or GPU using tools such as Advanced Normalization Tools (ANTs)27 or the Forsberg registration package28.
- Lung parenchyma segmentation
- Segment the lung parenchyma of the end-inspiratory 3D image using a convolutional neuronal network with, e.g., nnUnet architecture29.
- Exclude lung vessels using a vessel recognition algorithm, such as the one described by Wernz et al.30.
NOTE: The lung vessel recognition step is not mandatory if you do not have access to such an algorithm. In some cases, manual resegmentation may be necessary.
- Filtering
- Apply Nadaraya-Watson kernel regression (with σ = 0.3) to the registered and reinverted images to interpolate 16 phases onto a uniformly spaced time grid.
- Eliminate signal variations unrelated to respiration by applying a low-pass filter at 0.7 Hz to the interpolated data in the time domain.
- Denoise the low-pass filtered images using image-guided filtering31, with the temporally averaged registered image serving as the guiding image. Set the following parameters: Window Size = [5, 5, 5], lambda = 0.001.
- Ventilation analysis
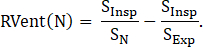
- Calculate the regional ventilation (RVent) maps in milliliter/milliliter (mL/mL) for each respiratory phase N using the following formula32:
 [1]
[1]
NOTE: SInsp represents the target image for image registration, corresponding to the end-inspiratory level. SExp refers to the end-expiratory image, while SN represents the N-th respiratory state. - Calculate the ventilation defect (VDRVent) map of the RVent map of 8th phase, which represents the maximal ventilation.
NOTE: To calculate VD, voxels below the threshold of the 90th percentile value, multiplied by a factor of 0.4, are considered defects33. - Calculate the flow-volume-loop correlation metric (FVL-CM) map.
- Calculate the flow as the first derivative of RVent.
NOTE: The volume is directly measured by RVent. - Establish a reference FVL for each slice, computed from a healthy region defined by RVent values between 75th and 95th percentile.
- Determine the similarity between each lung parenchyma voxel's FVL and the reference FVL using cross-correlation with zero-lag.
- Calculate the flow as the first derivative of RVent.
- Compute VDFVL-CM map, where voxels with FVL-CM values below 0.9 are identified as voxels with ventilation defect34.
- Compute ventilation time-to-peak (VTTP) maps in percentage (%) of respiratory cycle.
NOTE: Theoretically, the interpolated respiratory cycle starts/ends at peak expiration and is symmetrical about the peak inspiration at 50% of the ventilation cycle for a healthy voxel. For voxels undergoing advanced/delayed ventilation dynamics, the VTTP map will display a value below/above 50%. - Compute the deviation of VTTP value (VTTPDev) from the peak inspiration at 50% as follows:
 [2]
[2]
NOTE: For a healthy region, the VTTPDev should be close to 0%. - Statistics
- Describe statistically the parameters RVent, FVL-CM, VTTP, and VTTPDev for all slices, providing median, mean, standard deviation values, and interquartile ranges.
- Calculate the ventilation defect percentage values derived from the generated VD maps.
- Export all calculated parameters to a spreadsheet file (refer to the example provided in Table 3).
- Calculate the regional ventilation (RVent) maps in milliliter/milliliter (mL/mL) for each respiratory phase N using the following formula32:
Results
The simplest 3D PREFUL imaging protocol includes two sequences. One anatomical localizer + one free breathing measurement using golden-angle 3D stack-of-stars acquisition. The stack-of-stars trajectory is shown in Figure 1. This trajectory combines radial sampling (in-plane) with linear cartesian sampling (in z-direction). Initially, samples in the kz partition direction are acquired, followed by the rotation of the golden angle to sample the kx-ky plane. The golden angle acquisition scheme promotes self-gating with uniform coverage of k-space, facilitating image reconstruction with heavily undersampled data.The whole exam does not exceed 10 minutes. Further details of the 3D PREFUL acquisition are placed in the Table of Materials.
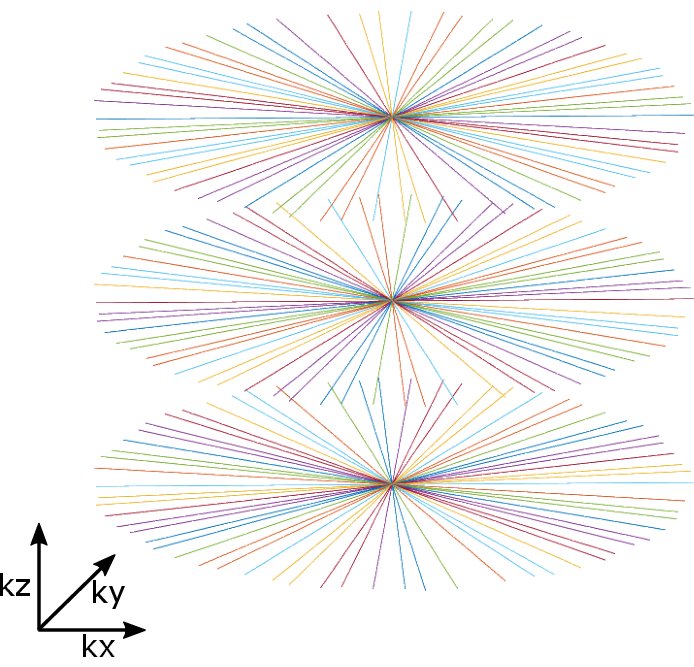
Figure 1: Golden ratio rotated stack of stars trajectory. Note radial sampling applied along in-plane dimension (kx-ky) and Cartesian sampling applied along slice direction (kz). This scheme results in cylindrical coverage of the acquired k-space. In this example, three partitions, including 32 radial projections per partition, are depicted. Please click here to view a larger version of this figure.
A list of typical MRI parameters used for 3D PREFUL imaging on 1.5 T scanner is presented in Table 1B. For the 3T scanner, the sequence parameters listed in Table 2 are proposed.
After the data acquisition and data transfer are completed, the image reconstruction part starts. This step is done by a MATLAB code that belongs to the intellectual property (IP) of a company (BioVisioneers GmbH) and cannot be shared openly. The script is fully automated once the path to the raw data is provided. A schematic overview of the reconstruction procedure is depicted in Figure 2.

Figure 2: Schematic overview of the 3D Phase Resolved Functional Lung (PREFUL) MRI method. At first, the data is acquired using an 8-minute-long free-breathing MR acquisition with a stack-of-stars trajectory. After the data is transferred from MR scanner to a computing unit, low-resolution 3D images with a temporal resolution of approximately 100 ms are reconstructed. The lung parenchyma of each image is segmented, and the lung volume is computed. The lung volume information is further used as a gating signal. Based on the amplitude and phase of the gating signal, the radial projections are sorted into respiratory bins that cover one respiratory cycle. The binning part is followed by the dynamic reconstruction of full-resolution images, which are subsequently registered to the end-inspiratory level. After several postprocessing steps, the regional ventilation (RVent) cycle is calculated, and the image analysis part, including parameter extraction, is performed. The RVent cycle is assessed by calculating the flow-volume loop (FVL) for each voxel. The FVL-CM ventilation maps are extracted through an assessment of each voxel FVL against healthy reference FVL, with similarity being evaluated using cross-correlation metric. For both RVent and FVL-CM, the global total ventilation defect percentage (VDP) values quantified. Furthermore, the dynamics of the RVent cycle is analyzed through time-to-peak analysis, resulting in a ventilation time-to-peak (VTTP) parameter map. Additionally, the deviation of the expected peak ventilation at 50% of the RVent cycle is quantified in the VTTPDev map. Please click here to view a larger version of this figure.
After the image reconstruction procedure, all images are spatially aligned to a single fixed state. The registration itself is performed on CPU using Advanced Normalization Tools (ANTs27) or Forsberg registration package28. While the ANTs package remains a gold standard for image registration tasks in MRI and CT imaging, the Forsberg registration facilitates a 10-fold faster registration procedure up to 9 minutes with comparable results19. The registration package might be chosen depending on the user priorities and available computing units. After the registration is done, the registered morphological images are again reinverted so that the lung appears dark in the grayscale image.
In Figure 3, the next step of the pipeline, which involves lung parenchyma segmentation, is depicted. First, the lung parenchyma is segmented from the end-inspiratory image using a convolutional neuronal network with nnUnet architecture29. The lung parenchyma segmentation is followed by a vessel recognition30, which is excluded from the final segmentation mask.

Figure 3: Exemplary results of deep learning-based segmentation for a 32-year-old male subject. The top row displays morphological images of eight representative coronal slices. In the second and third rows, one can observe the corresponding lung parenchyma mask and the final mask with the exclusion of vessels, respectively. Please click here to view a larger version of this figure.
An example of incorrect lung parenchyma segmentation is depicted in Figure 4. It is essential to visually inspect the deep-learning-based segmentations, and if deemed unsatisfactory, manual corrections should be considered to enhance the accuracy of the final lung parenchyma mask.

Figure 4: Exemplary results of incorrect deep learning-based segmentation for a 57-year-old male subject. The top row displays morphological images of eight representative coronal slices. In the second and third rows, one can observe the corresponding lung parenchyma mask and the final mask with the exclusion of vessels, respectively. As evident, several fibrotic regions are erroneously recognized as vessels or non-pulmonary structures. These inaccuracies have been corrected manually, as demonstrated in the fourth row. Please click here to view a larger version of this figure.
After several filtering steps outlined in the protocol, ventilation surrogates are calculated. 3D PREFUL MRI generates quantitative maps for static regional ventilation (RVent), dynamic flow-volume correlation metrics (FVL-CM), and two parameters based on ventilation time-to-peak (VTTP) analysis, as illustrated in Figure 5. This figure presents eight coronal slices of a 32-year-old healthy male. Note the expected homogenous distribution of all ventilation parameters.

Figure 5: 3D PREFUL MRI of a healthy volunteer (32-year-old male). Representative morphological (top row) and 3D PREFUL MRI ventilation parameters (second to fifth row) maps for a healthy volunteer (32-year-old male). The static regional ventilation is represented by regional ventilation (RVent), while the ventilation dynamics is assessed using the flow-volume loop correlation metric (FVL-CM), ventilation time-to-peak (VTTP), and deviation of VTTP (VTTPDev) represent ventilation parameters assessing the ventilation dynamics. As expected, homogenous ventilation values are observed for all ventilation parameter maps. Please click here to view a larger version of this figure.
To simplify the ventilation maps, ventilation defect (VD) maps are derived for RVent and FVL-CM, which enable faster interpretation of the results. The exemplary VD maps are presented in Figure 6. For both VDRVent and VDFVL-CM, the VDP values were found to be 3.6% and 3.0%, respectively, falling within the healthy normal range. Ideally, and depending on the age of the healthy volunteers, the VDP value should not exceed 10%. The above-mentioned parameters (RVent, FVL-CM, and their VD maps) were validated in several studies11,12,35,36 and are sensitive in the detection of disease as well as in the detection of therapy-induced effects20,34,37,38,39.

Figure 6: Representative RVent and FVL-CM maps, including their ventilation defect maps. The RVent (top row) and FVL-CM (second row) maps, including their ventilation defect maps (third and fourth row) derived by 3D PREFUL MRI for a healthy volunteer (32-year-old male), are depicted. In VD maps, healthy regions are green, and ventilation-deficit areas are marked in red. Please click here to view a larger version of this figure.
Several pulmonary MRI studies have been reported at both 1.5 T and 3 T magnetic field strengths. While there is the theoretical advantage of 3T due to increased signal-to-noise ratio (SNR), this advantage may be outweighed by more pronounced magnetic susceptibility effects at 3T. The exact influence of magnetic field strengths on the image quality of 3D PREFUL ventilation maps is currently unknown. Here, we present feasibility results (Figure 7) obtained for a healthy volunteer (35-year-old male) using a 3 T MR scanner. Note the more heterogeneous appearance of ventilation parameters at 3 T when compared to 1.5T (Figure 5).

Figure 7: 3D PREFUL MRI of a healthy volunteer (35-year-old male). Representative morphological (top row) and 3D PREFUL MRI ventilation parameters (second to fifth row) maps for a healthy volunteer (35-year-old male) at 3T. The static regional ventilation is represented by regional ventilation (RVent), while the ventilation dynamics is assessed using the flow-volume loop correlation metric (FVL-CM), ventilation time-to-peak (VTTP), and deviation of VTTP (VTTPDev) represent ventilation parameters assessing the ventilation dynamics. Please click here to view a larger version of this figure.
Comparison/validation of 3D PREFUL derived with more direct measurements is currently not published. There are several studies reporting a positive correlation between VDP values and spatial overlap of ventilation defects between 2D PREFUL technique and 129Xe11,12,14 and 19F MRI35. A recent comparison between 3D PREFUL-derived ventilation and direct ventilation measurements using 19F MRI in patients with chronic obstructive pulmonary disease (COPD), asthma, and healthy volunteers revealed a moderate to strong correlation at a global level40. Presented is an example comparison (Figure 8) for a patient diagnosed with chronic obstructive lung disease (54-year-old female, FEV1 = 42% predicted value), which was examined using 3D PREFUL and 19F wash-in MRI.

Figure 8: 3D PREFUL MRI of a 54-year-old female COPD patient. Morphological images (top row), ventilation parameters, and respective ventilation defect maps of a 54-year-old female COPD patient (FEV1 = 42 % pred., FVC = 102% pred.) obtained via 3D PREFUL MRI (2nd and 3rd row) and 19F MRI (4th and 5th row) are presented, along with a comparison of ventilation defect maps from both methods (last row). Overall, across all slices, the Sørensen-Dice coefficient was 25.5% in defective areas and 80.6% in healthy regions, resulting in a total spatial overlap of 69.2%. Notably, there's a visual correlation between matched ventilation areas in healthy and defective regions (depicted in dark green). Please click here to view a larger version of this figure.
3D PREFUL MRI can be used to measure regional responses to therapy20. As an example, Figure 9 shows a comparison of three slices from the lung of a cystic fibrosis subject (43-year-old female) at baseline (on the left,FEV1 = 94% predicted value) and after CFTR-modulator therapy (on the right, FEV1 = 112% predicted value). Because both measurements are spatially matched, 3D PREFUL enables regional treatment response analysis, as illustrated at the bottom of Figure 9. Please note the increased values of the flow-volume-loop correlation metric as well as the reduction in ventilation defects after therapy.

Figure 9: 3D PREFUL measurements of a 43-year-old female cystic fibrosis (CF) patient. Exemplary ventilation marker maps of baseline (left) and post-treatment (right) 3D PREFUL measurements of a 43-year-old female CF patient. VDPFVL-CM decreased from 18.0% (baseline) to 3.6% (post-treatment). FEV1 % pred. baseline: 94%, FEV1 % pred. post-treatment: 112%. LCI baseline: 10.48, LCI post-treatment: 9.39. The corresponding treatment response maps are depicted at the bottom. Please note the green areas indicating the resolved ventilation after the therapy. Please click here to view a larger version of this figure.
Table 1: List of typical MRI parameters used for localizer and 3D PREFUL acquisition on a 1.5T scanner. (A) Localizer and (B) 3D PREFUL acquisition. Please click here to download this Table.
Table 2: Proposed MRI parameters for 3D PREFUL acquisition on a 3T scanner. Please click here to download this Table.
Table 3: Exemplary statistical report of 3D PREFUL Parameters for a healthy volunteer (35-year-old male) Please click here to download this Table.
Discussion
One of the most critical pitfalls is the acquisition itself. Care must be taken to ensure that the MR sequence parameters are set properly. Importantly, echo time, repetition time, number of slices, matrix size, and pixel bandwidth are the crucial parameters. Deviations from the recommended settings may result in insufficient temporal resolution or prolonged acquisitions. Also, data transfer is important to ensure that the data are completely delivered to the selected computer or server for evaluation. The data evaluation proceeds entirely automatically once the path to the acquired data is set. Postprocessing commences with image reconstruction, where retrospective binning plays a crucial role. Verifying the binning signal is recommended to ensure a clear depiction of the breathing pattern.After inspecting the binning signal, no additional steps are necessary, as the algorithm itself handles poor breathing patterns by excluding outliers (data points above the 95th percentile and below the 10th percentile). After image reconstruction, the process of image registration occurs. This step should be verified as follows: the registered images should be free from breathing and cardiac motion. Specifically, the positions of the diaphragm and heart should be 'frozen'. The next step involves deep-learning-based segmentation of lung parenchyma and vessels. This segmentation process is highly time-consuming for the entire 3D lung volume; hence, the use of AI-based tools is beneficial. However, in certain situations, such as the occurrence of peripheral consolidations, these algorithms may not yield accurate results. Consequently, the segmentation mask should be thoroughly checked and manually corrected if necessary. All of these steps are critical for evaluating the ventilation parameters and may result in inaccurate calculations.
Since the original publication17, several developments have been made in the 3D PREFUL technique. The sorting algorithm of the acquired radial projections has been fully automated and improved so that the whole lung is segmented using Otsu's thresholding method and used as a navigator signal for binning data into respiratory phases. Further, the manual lung parenchyma and vessel segmentation have been replaced by fully automatic deep-learning-based algorithms to reduce time-consuming procedures. Additionally, the processing time of the image registration part might be reduced up to 10 minutes if the Forsberg registration toolbox is implemented19. Along with previous developments, the implemented code enables to coregister images of two-time points (follow-up measurements) and evaluate the voxelwise progression of the disease or therapy-induced ventilation changes20. The current version of the Matlab script does not require any user interaction and could be implemented in a pipeline for the automated processing of data with specific flags in the future.
The main disadvantage of 3D PREFUL is that no local blood flow measurement is feasible since the inflow effect cannot be captured when using a nonselective hard RF pulse for excitation. Secondly, currently, the whole postprocessing (including data transfer, image reconstruction, image registration, and ventilation analysis) requires 2 hours for each subject. Thirdly, currently, only a preliminary comparison of 3D PREFUL-derived ventilation parameters to more validated techniques was demonstrated40. Fourthly, the evaluation of acquired data is performed on a high-performance computer; therefore, the results are not directly available to the physician at the console. Fifthly, feasibility studies of 3D PREFUL on different field strengths and various scanner vendors are lacking.
3D Phase Resolved Functional Lung (PREFUL) MRI allows quantitative mapping of regional ventilation dynamics of the whole human lung during free breathing17. There are several cost-effective alternatives to 3D PREFUL, such as spirometry or multiple breath washout techniques; however, both lack spatial information and require breathing maneuvers, and they are therefore not feasible for young children or neonates. Alternative imaging methods expose patients to ionizing radiation, such as nuclear medicine methods CT, or are not widely available (hyperpolarized 129Xe or 19F gas imaging using MRI). 3D PREFUL provides an assessment of ventilation dynamics, can be performed using a standard clinical scanner, and does not require contrast agents, making it attractive to be translated to a clinical research setting. The fact that 3D PREFUL does not require the use of radiation or contrast agents and offers a patient-friendly, free-breathing acquisition makes it well-suited for repeat or longitudinal studies that quantitatively evaluate regional responses to therapy. Secondly, the 3D PREFUL assessment of lung ventilation may be especially valuable in young children, where radiation exposure should be avoided.
The capability of 3D PREFUL to generate functional ventilation images of the human lung holds the potential for early diagnosis. Specifically, the ability to produce repeatable and quantitative regional ventilation maps allows for longitudinal studies, e.g., disease progression or monitoring of therapy effects. Moreover, the regional information on ventilation dynamics can provide greater sensitivity to early changes related to lung disease that are not detectable by pulmonary function tests.
Disclosures
Filip Klimeš, Andreas Voskrebenzev, and Jens Vogel-Claussen are shareholders of BioVisioneers GmbH, a company interested in pulmonary magnetic resonance imaging methods.
Acknowledgements
This work was funded by the German Center for Lung Research (DZL). The authors profited from a number of beneficial discussions with colleagues, in particular with Marcel Gutberlet, Agilo Kern, Lea Behrendt, Arnd Obert, Julian Glandorf, Till Kaireit, Tawfik Moher Alsady, Gesa Pöhler, Maximilian Zubke, Robin Müller, Marius Wernz, Cristian Crisosto, Milan Speth, Julienne Scheller, and Sonja Lüdiger. The authors acknowledge Robert Grimm (Siemens Healthineers) for writing the MR imaging sequence, and further, the authors would also like to thank Frank Schröder and Sven Thiele from the Department of Radiology (Hannover Medical School) for outstanding technical assistance in performing the MRI examinations.
Materials
| Name | Company | Catalog Number | Comments |
|---|---|---|---|
| ANTs | Open source medical image analysis research community | Image registration toolbox | |
| BART | Open source imaging | https://www.opensourceimaging.org/project/berkeley-advanced-reconstruction-toolbox-bart/ | Image reconstruction toolbox |
| Body coil | Siemens / Philips / GE | https://www.siemens-healthineers.com/en-us/magnetic-resonance-imaging/options-and-upgrades/coils | At least 6-channel body coil; Philips [https://www.usa.philips.com/healthcare/solutions/magnetic-resonance/coils-overview ] |
| Forsberg | Image registration toolbox | https://github.com/fordanic/image-registration | Image registration toolbox |
| Image reconstruction code | BioVisioneers GmbH | www.biovisioneers.com | Software for the MR reconstruction and analysis |
| Matlab | Mathworks | Software | |
| MRI | Siemens / Philips / GE | https://www.siemens-healthineers.com/magnetic-resonance-imaging | Philips [https://www.philips.co.in/healthcare/solutions/magnetic-resonance], GE [https://www.gehealthcare.com/products/magnetic-resonance-imaging]; 1.5 T / 3 T |
| Sequence | Siemens / Philips / GE | MRI sequence, 3D gradient echo sequence with stack-of-stars trajectory and golden angle increment; 1. Siemens Grasp-Vibe Sequence - https://t.ly/P31kM , 2. Philips Multi Vane XD Sequence https://t.ly/wMWZZ , 3. GE Lava-Star, Disco-Star - https://t.ly/vimm2 |
References
- Chronic respiratory diseases. World Health Organization. , Available from: https://www.who.int/health-topics/chronic-respiratory-diseases#tab=tab_1 (2021).
- Musch, G., et al. Topographical distribution of pulmonary perfusion and ventilation, assessed by PET in supine and prone humans. J Appl Physiol. 93 (5), 1841-1851 (2002).
- Petersson, J., Sánchez-Crespo, A., Larsson, S. A., Mure, M. Physiological imaging of the lung: single-photon-emission computed tomography (SPECT). J Appl Physiol. 102 (1), 468-476 (2007).
- Mistry, N. N., et al. Evaluation of fractional regional ventilation using 4D-CT and effects of breathing maneuvers on ventilation. Int J Radiat Oncol Biol Phys. 87 (4), 825-831 (2013).
- Kirby, M., et al. Hyperpolarized 3 He and 129 Xe MR imaging in healthy volunteers and patients with chronic obstructive pulmonary disease. Radiology. 265 (2), 600-610 (2012).
- Kuethe, D. O., Caprihan, A., Fukushima, E., Waggoner, R. A. Imaging lungs using inert fluorinated gases. Magn Reson Med. 39 (1), 85-88 (1998).
- Ohno, Y., et al. Dynamic oxygen-enhanced MRI versus quantitative CT: Pulmonary functional loss assessment and clinical stage classification of smoking-related COPD. Am J Roentgenol. 190 (2), W93-W99 (2008).
- Bauman, G., et al. Non-contrast-enhanced perfusion and ventilation assessment of the human lung by means of fourier decomposition in proton MRI. Magn Reson Med. 62 (3), 656-664 (2009).
- Voskrebenzev, A., et al. Feasibility of quantitative regional ventilation and perfusion mapping with phase-resolved functional lung (PREFUL) MRI in healthy volunteers and COPD, CTEPH, and CF patients. Magn Reson Med. 79 (4), 2306-2314 (2018).
- Behrendt, L., et al. Validation of automated perfusion-weighted phase-resolved functional lung (PREFUL)-MRI in patients with pulmonary diseases. J Magn Reson Imaging. 52 (1), 103-114 (2020).
- Kaireit, T. F., et al. Flow volume loop and regional ventilation assessment using phase-resolved functional lung (PREFUL) MRI: Comparison with 129Xenon ventilation MRI and lung function testing. J Magn Reson Imaging. 53 (4), 1092-1105 (2021).
- Couch, M. J., et al. Comparison of functional free-breathing pulmonary 1H and hyperpolarized 129Xe magnetic resonance imaging in pediatric cystic fibrosis. Acad Radiol. 28 (8), e209-e218 (2020).
- Behrendt, L., et al. Validation of automated perfusion-weighted phase-resolved functional lung (PREFUL)-MRI in patients with pulmonary diseases. J Magn Reson Imaging. 52 (1), 103-114 (2019).
- Marshall, H., et al. 129Xe and free-breathing 1H ventilation MRI in patients with cystic fibrosis: A dual-center study. J Magn Reson Imaging. 57 (6), 1908-1921 (2022).
- Mendes Pereira, L., et al. UTE-SENCEFUL: first results for 3D high-resolution lung ventilation imaging. Magn Reson Med. 81 (4), 2464-2473 (2018).
- Boucneau, T., Fernandez, B., Larson, P., Darrasse, L., Maître, X. 3D magnetic resonance spirometry. Sci Rep. 10 (1), 16012(2020).
- Klimeš, F., et al. 3D phase-resolved functional lung ventilation MR imaging in healthy volunteers and patients with chronic pulmonary disease. Magn Reson Med. 85 (2), 912-925 (2021).
- Klimeš, F., et al. Repeatability of dynamic 3D phase-resolved functional lung (PREFUL) ventilation MR Imaging in patients with chronic obstructive pulmonary disease and healthy volunteers. J Magn Reson Imaging. 54 (2), 618-629 (2021).
- Klimeš, F., Voskrebenzev, A., Gutberlet, M., Grimm, R., Wacker, F., Vogel-Claussen, J. Evaluation of image registration algorithms for 3D phase-resolved functional lung ventilation magnetic resonance imaging in healthy volunteers and chronic obstructive pulmonary disease patients. NMR Biomed. 36 (3), e4860(2022).
- Klimeš, F., et al. Effect of CFTR modulator therapy with elexacaftor/tezacaftor/ivacaftor on pulmonary ventilation derived by 3D phase-resolved functional lung MRI in cystic fibrosis patients. Eur Radiol. 34 (1), 80-89 (2024).
- Rosenzweig, S., Holme, H. C. M., Uecker, M. Simple auto-calibrated gradient delay estimation from few spokes using Radial Intersections (RING). Magn Reson Med. 81 (1), 1898-1906 (2019).
- Uecker, M., et al. Berkeley advanced reconstruction toolbox. Proc Intl Soc Mag Reson Med. 23 (1), 2486(2015).
- Otsu, N. A threshold selection method from gray-level histograms. IEEE Trans Syst Man Cybern. 9 (1), 62-66 (1979).
- Song, H. K., Dougherty, L. k-Space weighted image contrast (KWIC) for contrast manipulation in projection reconstruction MRI. Magn Reson Med. 44 (6), 825-832 (2000).
- Song, H. K., Dougherty, L. Dynamic MRI with projection reconstruction and KWIC processing for simultaneous high spatial and temporal resolution. Magn Reson Med. 52 (4), 815-824 (2004).
- Voskrebenzev, A., Gutberlet, M., Kaireit, T. F., Wacker, F., Vogel-Claussen, J. Low-pass imaging of dynamic acquisitions (LIDA) with a group-oriented registration (GOREG) for proton MR imaging of lung ventilation. Magn Reson Med. 78 (4), 1496-1505 (2017).
- Avants, B. B., Tustison, N. J., Song, G., Cook, P. A., Klein, A., Gee, J. C. A reproducible evaluation of ANTs similarity metric performance in brain image registration. Neuroimage. 54 (3), 2033-2044 (2011).
- Forsberg, D. fordanicimage-registration. , Available from: https://github.com/fordanic/image-registration (2014).
- Isensee, F., Jaeger, P. F., Kohl, S. A. A., Petersen, J., Maier-Hein, K. H. nnU-Net: a self-configuring method for deep learning-based biomedical image segmentation. Nat Methods. 18 (2), 203-211 (2021).
- Wernz, M., et al. Influence of lung vessel segmentation on the reproducibility of PREFUL MRI. Proc IWPFI. 10 (1), 73(2022).
- He, K., Sun, J., Tang, X. Guided image filtering. IEEE Trans Pattern Anal Mach Intell. 35 (6), 1397-1409 (2013).
- Klimeš, F., et al. Free-breathing quantification of regional ventilation derived by phase-resolved functional lung (PREFUL) MRI. NMR Biomed. 32 (6), e4088(2019).
- Pöhler, G. H., et al. Repeatability of phase-resolved functional lung (PREFUL)-MRI ventilation and perfusion parameters in healthy subjects and COPD patients. J Magn Reson Imaging. 53 (3), 915-927 (2020).
- Moher Alsady, T., et al. MRI-derived regional flow-volume loop parameters detect early-stage chronic lung allograft dysfunction. J Magn Reson Imaging. 50 (6), 1873-1882 (2019).
- Kaireit, T. F., et al. Comparison of quantitative regional ventilation-weighted fourier decomposition MRI with dynamic fluorinated gas washout MRI and lung function testing in COPD patients. J Magn Reson Imaging. 47 (6), 1534-1541 (2018).
- Munidasa, S., et al. Inter- and intravisit repeatability of free-breathing MRI in pediatric cystic fibrosis lung disease. Magn Reson Med. 89 (5), 2048-2061 (2023).
- Lévy, S., et al. Free-breathing low-field MRI of the lungs detects functional alterations associated with persistent symptoms after COVID-19 infection. Invest Radiol. 57 (1), 742-751 (2022).
- Voskrebenzev, A., et al. Detection of chronic lung allograft dysfunction using ventilation-weighted Fourier decomposition MRI. Am J Transplant. 18 (8), 2050-2060 (2018).
- Voskrebenzev, A., et al. PREFUL MRI depicts dual bronchodilator changes in COPD: A Retrospective analysis of a randomized controlled trial. Radiol Cardiothorac Imaging. 4 (2), e210147(2022).
- Klimeš, F., et al. Comparison of free-breathing 3D phase-resolved functional lung (PREFUL) MRI with dynamic 19F ventilation MRI in patients with obstructive lung disease and healthy volunteers. J Magn Reson Imaging. , (2024).
Reprints and Permissions
