This protocol presents a modified mouse model of repetitive mild traumatic brain injury (rmTBI) induced via a closed-head injury (CHI) method. The approach features a thinned-skull window and fluid percussion to reduce the inflammation commonly caused by meninges exposure, along with improved reproducibility and accuracy in modeling rmTBI in rodents.
Method Article
Modified Mouse Model of Repetitive Mild Traumatic Brain Injury Incorporating Thinned-Skull Window and Fluid Percussion
* These authors contributed equally
Opens in a new tab
In This Article
Erratum Notice
Important: There has been an erratum issued for this article. View Erratum Notice
Summary
Loading...
$$\rightleftharpoonup{xx}$$
$$\longleftharp{xx}$$,
$$\longrightharp{xx}$$,
Abstract
Loading...
$$\rightleftharpoonup{xx}$$
$$\longleftharp{xx}$$,
$$\longrightharp{xx}$$,
Mild traumatic brain injury is a clinically highly heterogeneous neurological disorder. Highly reproducible traumatic brain injury (TBI) animal models with well-defined pathologies are urgently needed for studying the mechanisms of neuropathology after mild TBI and testing therapeutics. Replicating the entire sequelae of TBI in animal models has proven to be a challenge. Therefore, the availability of multiple animal models of TBI is necessary to account for the diverse aspects and severities seen in TBI patients. CHI is one of the most common methods for fabricating rodent models of rmTBI. However, this method is susceptible to many factors, including the impact method used, the thickness and shape of the skull bone, animal apnea, and the type of head support and immobilization utilized. The aim of this protocol is to demonstrate a combination of the thinned-skull window and fluid percussion injury (FPI) methods to produce a precise mouse model of CHI-associated rmTBI. The primary objective of this protocol is to minimize factors that could impact the accuracy and consistency of CHI and FPI modeling, including skull bone thickness, shape, and head support. By utilizing a thinned-skull window method, potential inflammation due to craniotomy and FPI is minimized, resulting in an improved mouse model that replicates the clinical features observed in patients with mild TBI. Results from behavior and histological analysis using hematoxylin and eosin (HE) staining suggest that rmTBI can lead to a cumulative injury that produces changes in both behavior and gross morphology of the brain. Overall, the modified CHI-associated rmTBI presents a useful tool for researchers to explore the underlying mechanisms that contribute to focal and diffuse pathophysiological changes in rmTBI.
Introduction
Loading...
$$\rightleftharpoonup{xx}$$
$$\longleftharp{xx}$$,
$$\longrightharp{xx}$$,
Mild TBI, including concussion and sub-concussion, account for the majority of all TBI cases (>80% of all TBI)1. Mild TBI commonly results from falls, traffic accidents, acts of violence, contact sports (e.g., football, boxing, hockey), and military combat2,3. Mild TBI can lead to neurobiological events that affect neurobehavioral functions throughout the patient's lifetime and increase the risk of neurodegenerative diseases4,5,6. Animal models provide an efficient and controlled means to study mild TBI, with the hope of further enhancing the diagnosis and treatment of mild TBI. Various models for mild TBI have been developed, such as the controlled cortical impact (CCI), weight drop (WD), fluid percussion injury (FPI), and blast-TBI models7,8. No single experimental model can mimic the entire complexity of TBI-induced pathology9,10. The heterogeneity of these models is advantageous for addressing the diverse features associated with mild TBI patients and investigating the corresponding cellular and molecular mechanisms. However, each animal model of TBI has its limitations3, limiting our current knowledge concerning animal mild TBI and their clinical relevance.
The WD and CCI models are utilized to replicate clinical conditions such as cerebral tissue loss, acute subdural hematoma, axonal injury, brain concussion, blood-brain barrier dysfunction, and even coma following TBI3,11,12. The WD model involves inducing brain damage by striking either the dura mater or skull with freely falling weights. The impact of a weighted object upon an intact skull can replicate mixed focal/diffuse injuries; however, this method is associated with poor accuracy and repeatability of the injury site, rebound injury, and a higher mortality rate due to skull fractures3,11,12. The CCI model involves applying air-driven metal to impact the exposed dura mater directly. Compared to the WD model, the CCI model is more accurate and reproducible, but it does not produce diffuse injury due to the small diameter of the impacting tip11. During FPI modelling, the brain tissue is briefly displaced and deformed by percussion. FPI can induce mixed focal/diffuse injury and replicate intracranial hemorrhage, brain swelling and progressive gray matter damage after TBI. However, FPI has a high mortality rate due to brainstem damage and prolonged apnea3,12. The craniotomy involved in conventional WD, CCI, and FPI models can lead to cortical contusion, hemorrhagic lesions, the damage of the blood-brain barrier, immune cell infiltration, glial cell activation, prolonged modeling time, and possible fatal outcomes3,12.
Mild TBI is characterized by a GCS (Glasgow coma scale, GCS) score within the range of 13 to 152. Mild TBI can be either focal or diffuse and is associated with both acute injuries, such as breakdown of cellular homeostasis, excitotoxicity, glucose depletion, mitochondrial dysfunction, blood flow disturbance, and axonal damage, as well as subacute injuries, including axonal damage, neuroinflammation, and gliosis2,3. Despite significant progress in delineating the intricate pathophysiology of TBI, the underlying mechanisms of mild TBI/rmTBI remain elusive and require further investigation9. Given that CHI is the most common type of TBI12, this protocol presents a novel approach to creating a more precisely controlled mouse model of rmTBI using a modified FPI device to perform impact in a thinned-skull window13. By avoiding craniotomy-induced injuries, variable skull thickness and shape-induced inaccuracies, and rebound injury, this approach aims to overcome the main disadvantages associated with the WD, CCI, and FPI models. Applying FPI impact on the thinned-skull window is convenient for evaluating cerebral vessel damage following rmTBI and helps minimize high mortality rates in some models, resulting in a closer resemblance to the clinical features of TBI patients.
Protocol
Loading...
$$\rightleftharpoonup{xx}$$
$$\longleftharp{xx}$$,
$$\longrightharp{xx}$$,
All procedures involved in this protocol were performed under the Institutional Animal Care and Use Committee approval (Zhejiang Normal University, Permit Number, dw2019005) and in compliance with the ARRIVE and the NIH Guide for the Care and Use of Laboratory Animals. Technical specifications can be found in the Table of Materials.
1. Animal handling procedure
- House mice in a controlled environment with a temperature of 22-24 °C, humidity ranging from 40%-60%, a 12 h light/dark cycle, and provide ad libitum access to water and standard mouse chow. For the purpose of this experiment, 25 ICR male mice (25-30 g, 8 weeks old) were used.
- Allocate randomly the mice into either the control group (n=12) or the rmTBI group (n=13). To prevent potential aggression from sham mice towards mice those that underwent rmTBI, separate them in distinct cages.
- Give mice at least 1 week to acclimate to their cage environment before beginning the experiment. This acclimation period ensures that the mice become familiar with their surroundings and minimizes the potential impacts of stress or anxiety on physiological or behavioral responses during the study.
2. Preparation of TBI device
- Fabricate the rmTBI model in mice using a modified FPI device (see Table of Materials; Figure 1A)13. Before using the FPI device, carefully inspect all connections for signs of leakage or cracking, paying special attention to the junctions between the cylinder and tubing, and between the three-way connector and tubing. To determine impact pressures accurately, a pressure transducer was installed to the point of impact on the fluid percussion injury device13.
- Conduct a careful inspection of the FPI device to ensure that the piston moves smoothly inside the cylinder and that impacts can be conducted effectively (Figure 1B). Verify that there are no air bubbles present within the system. If air bubbles are detected, carefully add distilled water to the system using a 50 mL syringe and expel the air bubbles by quickly pushing the cylinder rod through a nearby 3-way connector and/or through the syringe.
NOTE: The FPI system consists of distilled water within the cylinder and connected tubing. It is crucial to calibrate the device prior to operation to ensure accuracy and reliability of results.
3. Thinned-skull preparation
NOTE: The animal surgery and thinned-skull preparation should not be performed in view of other mice. The thinned-skull window is useful for evaluating cerebral vessel damage following an FPI procedure.
- Adhere to the requirements of the animal center by instructing the experimental operator to wear a sterile gown and mask during all animal handling procedures.
- Sanitize the lab bench top, FPI device, anesthetic tubing and adjacent counterspace before start experiment using a 70% ethanol spray.
- Weigh the mice in both the sham and rmTBI groups before surgery and compare their weights to those recorded 1 week prior to the experiment. Exclude from the study any mouse displaying poor health such as rough fur coat, diarrhea, weight loss, or lethargy. Additionally, exclude mice that weigh less than 20 g to ensure their ability to tolerate repeated impacts. These measures are crucial in maintaining animal welfare and ensuring reliable experimental outcomes.
- Anesthetize mice with 4%-5% isoflurane (in 100% oxygen at a flow rate of 1 L/min) for 3-4 min in an induction chamber. Administer an ophthalmic lubricant (see Table of Materials) to the animal's eyes to maintain lubrication throughout the surgery. To mitigate pain, administer buprenorphine subcutaneously (0.05 mg/kg) at the midpoint between their ears 20 min prior to anesthesia and subsequently every 6 h for a duration of 24 h. Furthermore, at the end of anesthesia, administer a single subcutaneous dose of 5 mg/kg carprofen to each animal.
- Disinfect the head after the mouse has lost its righting and pedal withdrawal reflexes. Trim the fur on the mouse's head using surgical scissors and use a shaver to remove the remaining fur. Disinfect the scalp with three sequential applications of 2% chlorhexidine, interspersed with 75% ethanol scrubs.
- Place a disposable sterile surgical pad under the animal and the surrounding area to ensure proper hygiene. Make a 1.5 cm incision using a fine small surgical scissor along the midline of the mouse's scalp to fully expose the surgical site (Figure 2A).
- Secure the mouse using nonterminal ear bars in a conventional stereotaxic frame (see Table of Materials). Adjust the mouse head position in a stereotaxic frame at a flat level or a slight tilted angle according to the specific target area that will be investigated. Clean fur from the surgical area to avoid inflammation later.
- Maintain the mouse's body temperature at 37 °C using a conventional isothermal heating pad (see Table of Materials).
- During the surgical and impact hub (female Luer Lock) installation process, maintain mouse anesthesia (with no response to toe or tail pinch) with a nose cone that delivers a continuous 2% isoflurane concentration, regulated by a calibrated vaporizer.
- Clean the surgical area around the thinned-skull window carefully using a sterile saline-soaked cotton swab.
- Create a thinned-skull window, approximately 2.5 mm in diameter and 20 µm in thickness, in the right frontal motor cortex using a flat-tipped micro-drill bit (see Table of Materials, Figure 2B) and a microsurgical blade. Locate the surgical site at 1.5 mm anterior to the bregma and 1.3-2.0 mm lateral to the midline (Figure 2C).
- To prevent the micro-drill from penetrating the skull during the creation of the thinned-skull window, intermittently moisten the skull with saline while grinding with the micro-drill.
- Confirm the thickness of the skull by gently probing the thinned-skull with the flattened tip of a fine syringe needle and assessing its softness. Estimate the clarity of the exposed cortical micro-vessels visually to determine the thickness of the skull.
- To verify the thickness of the skull, apply sterile saline to the thinned area and visually inspect using a conventional dissecting microscope (see Table of Materials). This technique can help ensure that the skull has been adequately thinned.
NOTE: Lubricate the mouse eye throughout the entire thinned-skull preparation and rmTBI modeling procedure to prevent drying out. Thinning the skull to less than 15 µm carries the risk of mild cortical trauma which may result in mild cortical inflammation14.
- Attach an adjusted female Luer Lock (2.2 mm inside diameter, created from a 19G needle hub, as shown in Figure 2D) to the thinned-skull site. Secure the Luer Lock with glue and dental cement (Figure 2E).
NOTE: When using glue to secure the female Luer lock to the area around the thinned-skull window, it is crucial to thoroughly dry the skull area, and prevent the adhesive from entering the window itself. Adhesive within the window can significantly reduce the impact force of the FPI.
4. CHI associated rmTBI modeling procedure
- Introduce rmTBI using the lateral fluid percussion method with a modified FPI device as described previously13,15.
- After completing the thinned-skull window and impact hub procedures, transfer the mouse from the stereotaxic apparatus to the impactor platform.
- Given the potential effects of anesthesia on animal righting reflex time and injury severity after percussion9,16, monitor the anesthesia depth by evaluating the palpebral and paw withdrawal reflexes (Figure 2F).
- Connect the female Luer Lock, which was glued onto the thinned-skull window, to the male Luer Lock at the end of the FPI device tubing (Figure 2G).
NOTE: In the rmTBI modeling, the isoflurane-induced anesthesia in mice was prolonged due to the induction of apnea and unconsciousness by percussion. - Introduce two mild TBI (48 h interval) with the modified device. Apply the first FPI impact immediately after completing the thinned-skull window surgery and installing the Luer Lock. Only administer the FPI impact once the mouse shows return of a withdrawal reflex to a paw pinch on each occasion (Figure 2H). Applying an FPI impact in deeply anesthetized mice can cause prolonged apnea and death.
- To apply the FPI impact, raise the pendulum to the designated degree along the protractor on the device and release the pendulum using software control13,15. The impact should achieve a percussion intensity of 2.0 ± 0.1 atm, following established protocols used in rodent studies10,17,18. Exclude animals from further tests if the impact did not register between 1.9-2.1 atm or if skull fracture occurred during FPI.
- For the sham mice, fix them onto the apparatus, but do not deliver the impact.
- Following impact, immediately detach the Luer Lock connection, and transfer mice to an isothermal heating pad for recovery. After the mouse regains alertness and consciousness, return it to its home cage without removing the female Luer lock. Administer the second FPI impact, in the same manner, 48 h later.
- After the rmTBI, carefully remove the female Luer lock and dental cement. Suture the scalp using tissue adhesive and use flat forceps to pinch the scalp to facilitate the adhesive process (see Table of Materials; Figure 2I).
- To prevent inflammation, infection, and alleviate post-surgical pain and discomfort, apply a mixture of erythromycin and sodium diclofenac ointment in a 1:1 ratio (see Table of Materials) to the wound. Transfer mice to an isothermal heating pad for recovery.
- Record the duration of the righting reflex, which starts when the mouse is removed from the stereotaxic apparatus and placed laterally on the impactor platform for FPI and continues until the mouse can stand upright independently.
- After the mouse regains alertness and consciousness, return it to its home cage. Mice are typically fully conscious and able to walk within 1.5 h after the injury.
- In the days following TBI modeling, observe the mice for various signs including breathing patterns, presence of mucus around the nose and mouth, and redness, swelling, exudates, or reopening of the wound area. Exclude animals from the study with one or more of the above abnormal symptoms.
NOTE: Pre-microinjection of AAV-GCaMP6s allows for observation of underlying neuronal Ca2+ homeostasis and excitability in the injured cortex through the thinned-skull window using two-photon laser scanning microscopy15.
5. Morris water maze (MWM) test
NOTE: The MWM (see Table of Materials) is a widely recognized method for evaluating spatial learning and memory deficits in mice following TBI.
- Conduct the MWM test starting from 7 days post injury (DPI). The circular pool of the MWM had a diameter of 120 cm and a height of 50 cm, with the water temperature maintained at 25 °C. Separate the circular pool into four quadrants, with the escape platform, a round platform with a diameter of 6 cm and a height of 30 cm, submerged 1 cm beneath the water surface in the northeast quadrant.
- Position a camera directly above the circular pool to record the movement trajectory of the mice. Mark the mice with black tape on their backs to facilitate recognition by the image acquisition software and for data recording, including the latency, swimming distance and the movement trajectory.
- Place the mice into the water, facing the interior wall of each of the four quadrants, one time for each quadrant. Once the mice find the platform, allow them to rest there for 10 s. If a mouse fails to find the platform within 60 s, ask the operator to guide the mouse to the platform, allow it to rest on the platform for 10 s, and then return the mouse to its home cage for rest.
- Repeat for each mouse the acquisition trial 4x daily. Following the acquisition trials, on 12 DPI, conduct a 60 s spatial probe experiment and record the number of times that the mice crossed the original platform area and the duration of the mouse stay in the quadrant where the platform was located.
- After each trial, quickly dry the mice with a towel or place under a warming lamp to maintain their body temperature and prevent hypothermia during the 60 s acquisition trial from DPI 7 to DPI 11.
- After the completion of the experimental procedures outlined above, anesthetize the mice with pentobarbital (45 mg/kg, i.p.) at 13 DPI. Perfuse isotonic saline transcardially, followed by perfusion with 4% paraformaldehyde in phosphate-buffered saline (pH 7.2). Retrieve the brains for conventional HE staining to evaluate gross cortical and hippocampal morphology alterations. A detailed description of the HE staining protocol can be found in prior publications13,15.
- After all experiments have been completed, euthanize mouse by injection of overdose pentobarbital (≥100 mg/kg, i.p.) if there are no mouse samples needed. Before harvesting tissues or disposing of the carcass, monitor the mouse until there is no heartbeat for at least 60 s.
Results
Loading...
$$\rightleftharpoonup{xx}$$
$$\longleftharp{xx}$$,
$$\longrightharp{xx}$$,
The protocol described in this study outlines a method for inducing rmTBI through a thinned-skull window, which offers a solution to the brain injury caused by craniotomy preparation during conventional percussion TBI modeling. By utilizing this modified fluid percussion procedure with the modified device, improved precision and reproducibility of FPI impact were achieved13. The modified impactor has the versatility to be used for both CHI and FPI modeling, with or without a skull craniotomy. Furthermore, the severity of the injury is modulated by adjusting injury parameters, such as the falling angle of the impact pendulum, or by adding additional closed-cell ethylene-vinyl acetate foam pads of varying hardness to the end plate of the piston pole.
The modified rmTBI model provides significant advantages, such as producing focal and diffuse pathology without exposing the cortical dural, which minimizes inflammation from meningeal exposure and/or direct FPI on parenchyma. Moreover, this model reduces variations in skull bone thickness and shape to produce reliable injury outcomes. Therefore, the modified rmTBI model is effective and reliable in simulating clinically relevant post-concussive symptoms (PCS)-related neuropathological and behavioral deficits across different injury degrees. Particularly, this model is useful for investigating TBI pathological mechanisms that rely on animal TBI models' accuracy and reproducibility, especially for investigating mild TBI-related mechanisms.
The frontal lateral branch of the mouse middle cerebral artery and caudal rhinal vein19, situated beneath the thinned-skull, allowed for clear visualization under the camera. Following two rmTBI percussions, each at a pressure of approximately 2.0 atm, all mice exhibited subdural hematomas at 0 DPI. Although the integrity of the thinned-skull did not appear to be compromised; however, a reduction in the number of microvessels was observed alongside changes in microvasculature morphology (Figure 2H), as previously reported15. By 2 DPI, the hematomas largely resolved. Mortality primarily results from impact while the mouse is under deep anesthesia, which may significantly prolong apnea. Regularly assessing the depth of anesthesia before impact through the palpebral and paw withdrawal reflexes can substantially reduce mortality. Additional factors that can impact mortality rates after fluid percussion include mouse strain, skull hardness, sex, and age. In a previous study using the same rmTBI protocol, one C57BL/6J mouse had died15. In this protocol, only male ICR mice were utilized to introduce the whole procedures.
Both human and animal studies have shown that even repetitive subconcussive head impacts can cause widespread microstructural white matter injuries20,21,22, which are associated with worse cognitive performance21,22. At 7-12 DPI, rmTBI can produce impairments in spatial learning and memory, which were examined using the MWM paradigm. Figure 4 illustrates the results obtained from this assessment.
Analysis of the last acquisition trial in the MWM demonstrated a significant increase (p< 0.05) in the latency by rmTBI mice to reach the submerged platform, compared to the control group. In the probe trial, the analysis of the percentage of time spent in the original platform quadrant demonstrated a significant reduction (p<0.01) in the rmTBI group relative to the control group, indicating a decline in spatial reference learning and memory capabilities in mice with rmTBI.
The method described here was utilized in an earlier publication15 using the C57BL/6J mice. Apart from the MWM three additional analyses were conducted as described below.
The OFT was utilized to assess locomotion and exploration capabilities by measuring the mean travel speed, total distance traveled, and percentage of distance traveled in the center zones. Conduct an Open-field test (OFT) at 6 DPI to evaluate locomotion, exploration, and anxiety in mice. The test device measuring 40 x 40 x 40 cm, which was divided into 16 zones (each measuring 18 x 18 cm). The mouse was placed in the center of the device and allowed to freely explore for 5 min. Recording the distance traveled in the center 4 zones, total distance traveled, mean moving speed, and time spent in the border zones was done. Anxiety levels were evaluated based on the percentage of distance traveled in the central zones and the time spent by rodents in the bordering zones during a 5 min observation period. At 6 DPI, rmTBI may not have a significant impact on the mice's general locomotive abilities, it can induce significant anxiety and alter exploratory behavior, as shown in Figure 415. Moreover, the modified rmTBI model induces diffuse axonal injuries, which can be evaluated through additional behavioral tests, such as the cognitive ability test described in this protocol.
RmTBI has been shown to impair spatial working and reference memory in mice, as illustrated in Figure 515. These cognitive functions were assessed using the Y-maze test. The test was performed at 8 DPI to measure short-term working memory deficits in mice. For spontaneous alternation behavior: an acrylic Y-maze device (20 cm high, 50 cm long, and 10 cm in width at the bottom) was used. After placing the mouse in the center of the device and allowing it to explore for 8 min, the arm entries were recorded. Spontaneous alternation behavior is defined as the successive entry of the mouse into the three arms on triplet sets. Calculate the spontaneous alternation rate (%) as (successive triplet sets / total number of arm entries minus 2) x 100. For spatial reference memory, during the 8 min training, randomly close off one arm of the Y-maze device. After 1 h after the initial exposure, the mouse is reintroduced into the maze with all three arms open and allow it to explore freely for 3 min. The time spent exploring the novel arm versus the other two arms is recorded. Calculate the preference index as time spent in the novel arm versus time spent in all three arms.
Furthermore, we suggest evaluating gross structural lesions in the brain using simple HE staining (Figure 6)15 upon completing all behavioral tests. Use cortical region coronally sectioned from 1 mm anterior to the lesion site to the posterior margin of the lesion, and the hippocampal region coronally sectioned at the typical crescent-shaped zone (Bregma: -1.7 to -2.2 mm). Counting neurons in each slide from six randomized fields using an ocular grid (magnification 400x) and averaging the neuronal number provided the numeral density per visual field (numeral density). The brain regions affected by rmTBI were found to exhibit varying degrees of neuron injuries15. Specifically, the motor cortex demonstrated a more potent and varied extent of such injuries than the hippocampus. HE staining showed a considerable shift towards pyknotic morphology from normal neurons (Figure 6A,B,E,F). Furthermore, the extracellular matrix was observed to become loosened specifically in the region of the lesion (Figure 6F). Besides the observed matrix-loosened areas, rmTBI mice also showed a significant increase in hyperchromic staining, seen as a darker red color, in a significant number of subgranular neurons in the dentate gyrus and some cortical and CA1 neurons. Intriguingly, these staining patterns did not present any accompanying signs of cytoplasmic shrinkage or pyknotic nucleus (Figure 6C,D,G,H,K)15. The behavioral (except for WMM test) and HE staining methods mentioned above were detailed in a recent publication, which introduced the modified rmTBI model15.

Figure 1: The modified FPI device and the software screenshot. (A) The modified FPI device. (B) The screenshot displays the FPI pressure waveform and the automatic measurement and exportation of real-time impact pressure parameters such as rise time, fall time, and half width duration. Please click here to view a larger version of this figure.
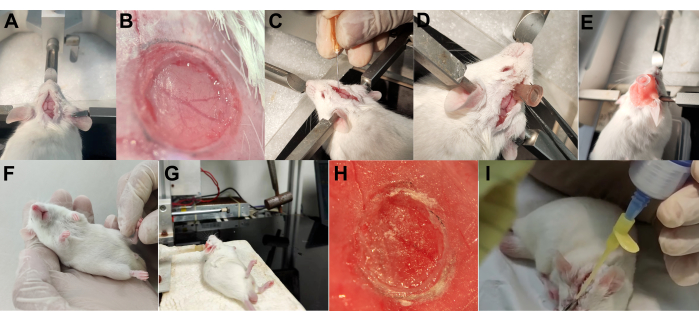
Figure 2: The modified mouse model of rmTBI in ICR mice. (A) A midline incision is made to expose the surgical area. (B) A thinned-skull window was fabricated on the motor cortex. The clarity of the exposed cortical micro-vessels is used to determine the thickness of the skull. (C) The thickness of the skull can also be verified by gently probing the thinned-skull with the flattened tip of a fine syringe needle and assessing its softness. (D) The female Luer Lock was glued to the thinned-skull window. (E) The attached female Luer Lock was secured by applying the dental cement. (F) The depth of the anesthesia was monitored by checking the palpebral and paw withdrawal reflexes. (G) The FPI impact was delivered after the return of a withdrawal reflex to a paw pinch. (H) Post-rmTBI image of thinned-skull window at 0 DPI. (I) The scalp was sutured with tissue adhesive. Please click here to view a larger version of this figure.

Figure 3: The effects of rmTBI on spatial reference learning and memory in ICR mice. (A) The navigation trace for mice during the last acquisition trial recorded at 11 DPI, (B) the spatial probe route in the probe trial recorded at 12 DPI, and (C) the escape time it took mice to locate the platform during the last acquisition trial. The results revealed that the rmTBI group took significantly longer to reach the hidden platform than the control group (p<0.05). (D) The percentage of time mice spent in the original platform quadrant relative to the total navigation time during the probe trial was significantly lower in the rmTBI group than in the control group (p<0.01). n=8. *p<0.05, **p<0.01 vs. control by unpaired t-test. Please click here to view a larger version of this figure.

Figure 4: The effects of rmTBI on locomotion, exploration, and anxiety in C57BL/6J mice. (A) Representative traces of control and rmTBI mice movement during 5 min OFT. (B-E) Summarized data show distance traveled in the center zones, total traveled distance, mean travel speed and time spent in the periphery zones, respectively. Control, n=13; rmTBI, n =12. ***p<. 01 vs. control by unpaired t-test. This figure has been modified from15. Please click here to view a larger version of this figure.
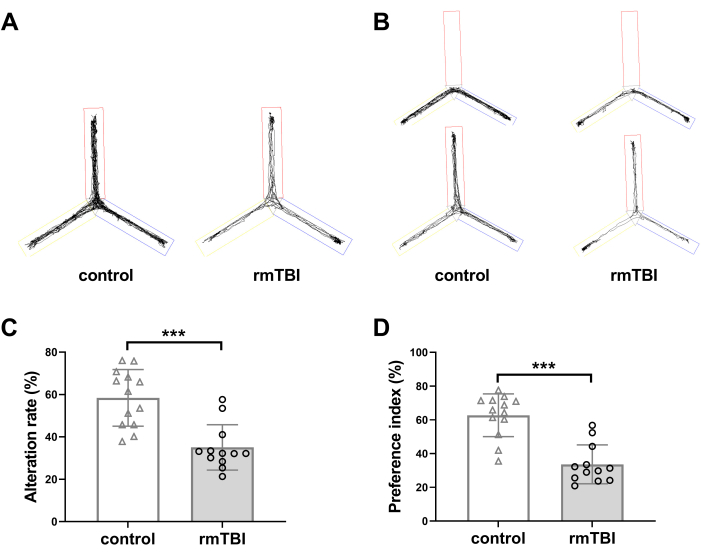
Figure 5: The effects of rmTBI on spatial working and reference memory in C57BL/6J mice. (A, B) Representative traces of control and rmTBI mice movement during the spatial working and reference memory assessments in Y maze. The Y maze spontaneous alternation test is a commonly used method for assessing short-term memory in rodent models15. (C) Summary of spontaneous alternation rates of control and rmTBI mice during spatial working assessment. Rodents usually prefer exploring a new arm of the maze rather than revisiting one they have already explored. A preference index is calculated based on the time rodent spend in the novel arm compared to the time spent in all three arms, and this index is then analyzed. (D) Summary of preference index of control and rmTBI mice during the spatial working assessment. Control, n=13; rmTBI, n=12. ***p<. 01 vs. control by unpaired t-test. This figure has been modified from15. Please click here to view a larger version of this figure.
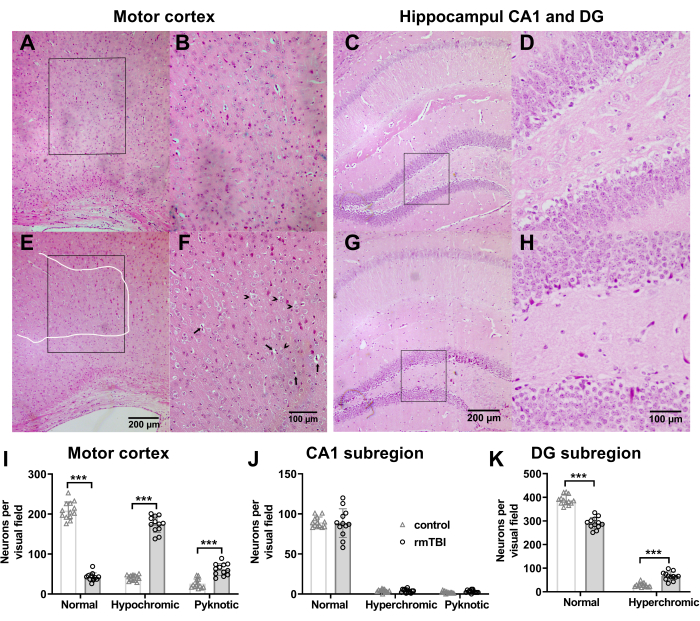
Figure 6: Comparison of HE staining of the ipsilateral injured motor cortex and hippocampal dentate gyrus subregion between control and rmTBI in C57BL/6J mice. (A, B) Normal motor cortex; and (C, D) the hippocampal region of control mice in different magnifications. (E, F) Injured motor cortex and (G, H) hippocampal regions of rmTBI mice. Hyperchromic neurons in the cortex and CA1 may have been slightly affected by either surgery preparation or sustained rmTBI; however, hypochromic (possibly intermediate injured) and pyknotic (apoptotic neurons) neurons were observed in the motor cortex of rmTBI mice when compared to normal neurons in the control mice. These neuronal apoptosis features included neuronal cytoplasmic and nucleus shrinkage, accompanied by apparent vacuolation. Notably, the demarcation white line in (E) represents the boundary between the lesioned and the surrounding tissue. Additionally, the hyperchromic neurons in the DG subregion (H) possibly referred to newly generated immature and mature granular neurons. The bar graphs below show the distribution of normal and rmTBI-affected neurons in the (I) motor cortex and hippocampal (J) CA1 and (K) DG subregions. Control, n=13; rmTBI, n=12, ***p<. 001 vs. control by unpaired t-test. This figure has been modified from15. Please click here to view a larger version of this figure.
Discussion
Loading...
$$\rightleftharpoonup{xx}$$
$$\longleftharp{xx}$$,
$$\longrightharp{xx}$$,
TBI refers to two primary types, closed and penetrating, with the latter characterized by a disruption of the skull and dura mater. Clinical data suggest that CHIs are more prevalent than penetrating injuries1,2. After a single mild TBI, most patients experience PCS symptoms that typically resolve in a short period of time, and there is controversy regarding the proportion of patients whose PCS develop into long-term sequelae23,24. Consequently, researchers have shifted their focus to repetitive CHI models to better understand the cumulative effects of multiple concussions25, which commonly occur in falls, traffic accidents, and contact sports. These repeated impacts may lead to more severe and long-term effects26,27. By using repetitive CHI models, researchers can explore the potential additive or synergistic effects of multiple concussions and gain a better understanding of the underlying mechanisms that contribute to PCS. Such models may facilitate the development of targeted therapeutic interventions to mitigate the long-term consequences of repeated head impacts.
Although some CHI models attempt to simulate both focal single and rmTBI by incorporating both linear and rotational forces, these models can result in rebound injury and inaccuracies in injury severity due to factors such as skull fracture, skull morphology and thickness, extended animal apnea10, and variability in mechanical input parameters, particularly when rotational head movement is incorporated9. Piston-controlled impact and weight-drop methods are commonly used to induce rmTBI in animal models of CHI25. Piston-controlled impact allows for precise and adjustable setting of impact parameters through the use of electromagnetic or pneumatic driven impactor devices, thereby enabling high impact reproducibility. However, the use of piston-controlled impact, whether onto the exposed cortex as in CCI or onto the closed-skull, still requires stringent immobilization of the animal's head in a stereotaxic frame during impact. Conversely, weight-drop methods require simple and cost-effective materials that are easy to set up, but the trade-off is a somewhat high variability in the severity of the injury25.
The FPI model typically induces mixed focal and diffuse injuries, allowing for fabrication of TBI of varying severities. Despite its advantages, the FPI model also has potential limitations. Like the CCI model, FPI still requires craniotomy, a surgical procedure that may induce inflammation in the brain tissue17. Moreover, even mild FPI frequently penetrates the dura at varying depths, which can introduce confounds in the interpretation of data. Thus, CCI and FPI models have limitations in replicating the clinical features observed in mild TBI patients9. Hence, we present a protocol that combines the thinned-skull window and FPI methods, which can be utilized to produce a more precise mouse model of CHI associated rmTBI. The objective of this protocol is to closely mirror the clinical features of mild TBI patients. A highly reproducible model would be an invaluable tool for investigating the mechanisms underlying the pathophysiology of mild TBI and evaluating potential therapeutic interventions.
Our research findings on rmTBI align with previous publications that utilized thinned-skull windows for mild TBI investigations28,29. For example, Ren et al. created a thinned-skull window with a thickness of approximately 30 µm in the left parietal association cortex, inducing mild TBI by gently pressing the window using a blunt end with a diameter of 1 mm from a surgical stereotaxic instrument29. Their study showed a notable expansion of cell death and reactive oxidative species (ROS) expression in the injured cortex29. To investigate rmTBI, Nguyen et al. applied three CCIs with a modified impactor tip (3-mm-diameter round silicone tip of 1.5 mm thickness) on a mouse thinned-skull window (20-40 µm in thickness) in the parietal association cortex28. To protect and maintain the transparency of the thinned-skull area for long-term imaging, they covered the thinned-skull window with a thin layer of cyanoacrylate glue. The three CCIs were performed once a week for 3 weeks, with impact parameters of 4 m/s in speed and 2 mm in depth. As a result of the three CCIs, the mice showed evident astrogliosis and microglial activation28. Given that the usage of thinned-skull window as a model for mild TBI/rmTBI is relatively recent, further research is required to examine the relationship between injury severity/progression and different impact techniques. For example, in a previous study, we were able to observe obvious changes in cell morphology after two FPIs that were administered with a 2 day interval15. Meanwhile, in other studies, a single gentle compression to the thinned-skull window induced mild TBI with evident cell death and reactive oxidative species expression29, and three weekly-CCIs resulted in robust astrogliosis and microglial activation28.
Several steps should be cautiously proceeded to fabricate a consistent injury model using the described method. During the thinned-skull window operation, based on different target area (e.g., we focused on motor cortex), the mouse head should be fixed in a stereotactic frame at horizonal level or at a slight lateral angle toward opposite side of the thinned-skull window in this protocol. This specific positioning can facilitate the creation of the thinned-skull window in the area corresponding to the motor cortex. Accurately placing the ear bars is one of the most challenging aspects of this procedure, and it can take time and practice to master. Before attempting the thinned-skull window operation or inducing CHI, it is essential to ensure that the skull is level. If the skull is not positioned correctly, the head should be adjusted accordingly. Due to the uneven shape and thickness of the skull bone, skull growth is variable even within a specific bone30, it is critical to adjust the head positioning before undertaking the thinned-skull window procedure or CHI. Failure to do so increases the risk of skull fractures, which can significantly impact the CHI accuracy and reliability. For more comprehensive guidance on the thinned-skull window procedure, refer to the protocol outlined by Guang et al.14.
The choice of TBI modeling area varies among researchers based on their research focus. Given the significant variability in the actual location of the injury in CHI, despite most studies reporting the impact site to be centrally located between bregma and lambda, it is recommended to vary the impact location in future experimental studies, as noted in a review of CHI animal models25. To validate the modified CHI thinned-skull injury model, we recommend starting with the motor cortex, as outlined in this protocol. The rmTBI can cause focal motor cortex injuries, which can be easily evaluated using locomotor assessment approaches such as the OFT in this protocol. The incision made during this procedure requires time to heal, and this can potentially trigger a peripheral immune response, ultimately introducing variability into the experiment. To minimize the risk of inflammation, infection, and post-surgical pain and discomfort, we recommend applying a topical ointment containing a combination of erythromycin and sodium diclofenac to the wound. This approach has been shown to be effective in reducing inflammation and pain associated with surgical procedures in animals.
The thinned-skull-based fluid percussion protocol is a promising method for modeling rmTBI in rodents since it reduces the inflammation commonly caused by exposing the meninges to FPI. This technique, featured in the thinned-skull window, can effectively generate clinically relevant PCS at varying degrees, providing a potential alternative for researchers studying rmTBI. Moreover, the thinned-skull window facilitates the observation of Ca2+ homeostasis and neuronal hyperexcitability in the cortex in vivo15. Using this technique can improve our understanding of the underlying mechanisms of PCS progression in the short/moderate/long terms, thereby enhancing the ability to predict its development and develop more effective therapeutic treatments.
Disclosures
Loading...
$$\rightleftharpoonup{xx}$$
$$\longleftharp{xx}$$,
$$\longrightharp{xx}$$,
The authors have no conflicts of interest to disclose.
Acknowledgements
Loading...
$$\rightleftharpoonup{xx}$$
$$\longleftharp{xx}$$,
$$\longrightharp{xx}$$,
This work was supported by the Key Social Development Foundation of Jinhua Municipality (No. 2020-3-071), Zhejiang College Student Innovation and Entrepreneurship Training Program (No: S202310345087, S202310345088) and Zhejiang Provincial College Students' Science and Technology Innovation Activity Plan Project (2023R404044). The authors thank Miss Emma Ouyang (first-year student of Johns Hopkins University, Bachelor of Science, Baltimore, USA) for language editing the article.
Materials
| Name | Company | Catalog Number | Comments |
|---|---|---|---|
| 75% ethanol | Shandong XieKang Medical Technology Co., Ltd. | 220502 | |
| Buprenorphine hydrochloride | Tianjin Pharmaceutical Research Institute Pharmaceutical Co., Ltd | H12020272 | Solution, Analgesic |
| Carprofen | Shanghai Guchen Biotechnology Co., Ltd | 53716-49-7 | Powder, Analgesic |
| Chlorhexidine digluconate | Shanghai Macklin Biochemical Co.,Ltd. | 18472-51-0 | 19%-21% aqueous solution, Antimicrobial |
| Dental cement and solvent kit | Shanghai New Century Dental Materials Co., Ltd. | 20220405, 3# | Powder reconsituted in matching solvent |
| Dissecting microscope | Shenzhen RWD Life Science Inc. | 77019 | |
| Erythromycin ointment | Wuhan Mayinglong Pharmaceutical Group Co.,Ltd. | 220412 | Antibiotic |
| Fiber Optic Cold Light Source | Shenzhen RWD Life Science Inc. | F-150C | |
| Flat-tipped micro-drill bit | Shenzhen RWD Life Science Inc. | HM31008 | 2 mm, steel |
| FPI device software | Jiaxing Bocom Biotech Inc. | Biocom Animal Brain Impactor V1.0 | |
| ICR mice | Jinhua Laboratory Animal Center | Stock#2023091 | 25 Male mice, 25-30g, 8 weeks old |
| Isoflurane | Shandong Ante Animal Husbandry Technology Co., Ltd. | 2023090501 | |
| Isothermal heating pad | Wenzhou Repshop Pet Products Co., Ltd. | ||
| Luer Loc hup | Custom made using a 19G needle hub | ||
| Micro hand-held skull drill | Shenzhen RWD Life Science Inc. | 78001 | Max: 38,000rpm |
| Modified FPI device | Jiaxing Bocom Biotech Inc. | ||
| Morris water maze | Shenzhen RWD Life Science Inc. | 63031 | Evaluate mouse spatial learning and memory abilities |
| Open field | Shenzhen RWD Life Science Inc. | 63008 | Evaluate mouse locomoation and anxiety |
| Ophthalmic lubricant | Suzhou Tianlong Pharmaceutical Co., Ltd. | SC230724B | |
| Sodium diclofenac ointment | Wuhan Mayinglong Pharmaceutical Group Co.,Ltd. | 221207 | nonsteroidal anti-inflammatory drug |
| Small animal anesthesia system-Enhanced | Shenzhen RWD Life Science Inc. | R530IP | |
| Smart video-tracking system | Panlab Harvard Apparatus Inc., MA, USA | V3.0 | Animal tracking and analysis |
| Stereotactic frame | Shenzhen RWD Life Science Inc. | 68043 | |
| Vetbond Tissue Adhesive | 3M, St Paul, MN, USA | 202402AX | Suture the animal wound |
| Y maze | Shenzhen RWD Life Science Inc. | 63005 | Evaluate mouse spatial working memory |
References
Loading...
$$\rightleftharpoonup{xx}$$
$$\longleftharp{xx}$$,
$$\longrightharp{xx}$$,
- Jiang, J. Y., et al. Traumatic brain injury in china. Lancet Neurol. 18 (3), 286-295 (2019).
- Naumenko, Y., Yuryshinetz, I., Zabenko, Y., Pivneva, T. Mild traumatic brain injury as a pathological process. Heliyon. 9 (7), e18342(2023).
- Zhao, Q., Zhang, J., Li, H., Li, H., Xie, F. Models of traumatic brain injury-highlights and drawbacks. Front Neurol. 14, 1151660(2023).
- Grant, D. A., et al. Repeat mild traumatic brain injury in adolescent rats increases subsequent β-amyloid pathogenesis. J Neurotrauma. 35 (1), 94-104 (2018).
- Clark, A. L., et al. Repetitive mtbi is associated with age-related reductions in cerebral blood flow but not cortical thickness. J Cereb Blood Flow Metab. 41 (2), 431-444 (2021).
- Mcallister, T., Mccrea, M. Long-term cognitive and neuropsychiatric consequences of repetitive concussion and head-impact exposure. J Athl Train. 52 (3), 309-317 (2017).
- Xiong, Y., Mahmood, A., Chopp, M. Animal models of traumatic brain injury. Nat Rev Neurosci. 14 (2), 128-142 (2013).
- Pham, L., et al. proteomic alterations following repeated mild traumatic brain injury: Novel insights using a clinically relevant rat model. Neurobiol Dis. 148, 105151(2021).
- Fehily, B., Fitzgerald, M. Repeated mild traumatic brain injury: Potential mechanisms of damage. Cell Transplant. 26 (7), 1131-1155 (2017).
- Ma, X., Aravind, A., Pfister, B. J., Chandra, N., Haorah, J. Animal models of traumatic brain injury and assessment of injury severity. Mol Neurobiol. 56 (8), 5332-5345 (2019).
- Freeman-Jones, E., Miller, W. H., Work, L. M., Fullerton, J. L. Polypathologies and animal models of traumatic brain injury. Brain Sci. 13 (12), 1709(2023).
- Petersen, A., Soderstrom, M., Saha, B., Sharma, P. Animal models of traumatic brain injury: A review of pathophysiology to biomarkers and treatments. Exp Brain Res. 239 (10), 2939-2950 (2021).
- Ouyang, W., et al. Modified device for fluid percussion injury in rodents. J Neurosci Res. 96 (8), 1412-1429 (2018).
- Yang, G., Pan, F., Parkhurst, C. N., Grutzendler, J., Gan, W. B. Thinned-skull cranial window technique for long-term imaging of the cortex in live mice. Nat Protoc. 5 (2), 201-208 (2010).
- Liu, Y., Fan, Z., Wang, J., Dong, X., Ouyang, W. Modified mouse model of repeated mild traumatic brain injury through a thinned-skull window and fluid percussion. J Neurosci Res. 101 (10), 1633-1650 (2023).
- Bolton-Hall, A. N., Hubbard, W. B., Saatman, K. E. Experimental designs for repeated mild traumatic brain injury: Challenges and considerations. J Neurotrauma. 36 (8), 1203-1221 (2019).
- Aleem, M., Goswami, N., Kumar, M., Manda, K. Low-pressure fluid percussion minimally adds to the sham craniectomy-induced neurobehavioral changes: Implication for experimental traumatic brain injury model. Exp Neurol. 329, 113290(2020).
- Katz, P. S., Molina, P. E. A lateral fluid percussion injury model for studying traumatic brain injury in rats. Methods Mol Biol. 1717, 27-36 (2018).
- Xiong, B., et al. Precise cerebral vascular atlas in stereotaxic coordinates of whole mouse brain. Front Neuroanat. 11, 128(2017).
- Hoogenboom, W. S., et al. Evolving brain and behaviour changes in rats following repetitive subconcussive head impacts. Brain Commun. 5 (6), 316(2023).
- Lipton, M. L., et al. Soccer heading is associated with white matter microstructural and cognitive abnormalities. Radiology. 268 (3), 850-857 (2013).
- Rubin, T. G., et al. Mri-defined white matter microstructural alteration associated with soccer heading is more extensive in women than men. Radiology. 289 (2), 478-486 (2018).
- Mcinnes, K., Friesen, C. L., Mackenzie, D. E., Westwood, D. A., Boe, S. G. Mild traumatic brain injury (mtbi) and chronic cognitive impairment: A scoping review. PLoS One. 12 (4), e0174847(2017).
- Marschner, L., et al. Single mild traumatic brain injury results in transiently impaired spatial long-term memory and altered search strategies. Behav Brain Res. 365, 222-230 (2019).
- Hoogenboom, W. S., Branch, C. A., Lipton, M. L. Animal models of closed-skull, repetitive mild traumatic brain injury. Pharmacol Ther. 198, 109-122 (2019).
- Cunningham, J., Broglio, S. P., O'grady, M., Wilson, F. History of sport-related concussion and long-term clinical cognitive health outcomes in retired athletes: A systematic review. J Athl Train. 55 (2), 132-158 (2020).
- Fidan, E., et al. Repetitive mild traumatic brain injury in the developing brain: Effects on long-term functional outcome and neuropathology. J Neurotrauma. 33 (7), 641-651 (2016).
- Nguyen, T., et al. Repeated closed-head mild traumatic brain injury-induced inflammation is associated with nociceptive sensitization. J Neuroinflammation. 20 (1), 196(2023).
- Ren, H., et al. Enriched endogenous omega-3 fatty acids in mice ameliorate parenchymal cell death after traumatic brain injury. Mol Neurobiol. 54 (5), 3317-3326 (2017).
- Lillie, E. M., Urban, J. E., Lynch, S. K., Weaver, A. A., Stitzel, J. D. Evaluation of skull cortical thickness changes with age and sex from computed tomography scans. J Bone Miner Res. 31 (2), 299-307 (2016).
Reprints and Permissions
Request permission to reuse the text or figures of this JoVE article
Request PermissionErratum
Loading...
$$\rightleftharpoonup{xx}$$
$$\longleftharp{xx}$$,
$$\longrightharp{xx}$$,
Formal Correction: Erratum: Modified Mouse Model of Repetitive Mild Traumatic Brain Injury Incorporating Thinned-Skull Window and Fluid Percussion
Posted by JoVE Editors on 6/04/2025. Citeable Link.
This corrects the article 10.3791/66440