In-vitro thrombolysis assays have often struggled to replicate in-vivo conditions whether in the model thrombus being digested or in the environment in which thrombolysis is occurring. Herein, we explore how coupling the Chandler loop and Real-Time Fluorometric Flowing Fibrinolysis Assay (RT-FluFF) is used for high-fidelity, ex-vivo, clot lysis monitoring.
Method Article
Tracking Fibrinolysis of Chandler Loop-Formed Whole Blood Clots Under Shear Flow in An In-Vitro Thrombolysis Model
Opens in a new tab
In This Article
Summary
Loading...
$$\rightleftharpoonup{xx}$$
$$\longleftharp{xx}$$,
$$\longrightharp{xx}$$,
Abstract
Loading...
$$\rightleftharpoonup{xx}$$
$$\longleftharp{xx}$$,
$$\longrightharp{xx}$$,
Thromboembolism and related complications are a leading cause of morbidity and mortality worldwide and various assays have been developed to test thrombolytic drug efficiency both in vitro and in vivo. There is increasing demand for more physiologically relevant in-vitro clot models for drug development due to the complexity and cost associated with animal models in addition to their often lack of translatability to human physiology. Flow, pressure, and shear rate are important characteristics of the circulatory system, with clots that are formed under flow displaying different morphology and digestion characteristics than statically formed clots. These factors are often unrepresented in conventional in-vitro clot digestion assays, which can have pharmacological implications that impact drug translational success rates.
The Real-Time Fluorometric Flowing Fibrinolysis (RT-FluFF) assay was developed as a high-fidelity thrombolysis testing platform that uses fluorescently tagged clots formed under shear flow, which are then digested using circulating plasma in the presence or absence of fibrinolytic pharmaceutical agents. Modifying the flow rates of both clot formation and clot digestion steps allows the system to imitate arterial, pulmonary, and venous conditions across highly diverse experimental setups. Measurements can be taken continuously using an in-line fluorometer or by taking discrete time points, as well as a conventional end point clot mass measurement. The RT-FluFF assay is a flexible system that allows for the real-time tracking of clot digestion under flow conditions that more accurately represent in-vivo physiological conditions while retaining the control and reproducibility of an in-vitro testing system.
Introduction
Loading...
$$\rightleftharpoonup{xx}$$
$$\longleftharp{xx}$$,
$$\longrightharp{xx}$$,
Diseases fundamentally stemming from thrombo-embolic etiologies present a major source of morbidity and mortality in present-day society. Manifestations of thrombo-embolic pathogenesis include, but are not limited to, myocardial infarctions, ischemic strokes, deep venous thromboses, and pulmonary emboli1. A tremendous amount of ongoing research, spanning multiple disciplines, revolves around the development of safe and effective methods for dealing with pathogenic thrombosis. Variations in arterial and venous manifestations of thrombosis and varying anatomic locations have resulted in the development of different treatment approaches. However, acute treatment generally relies on the use of pharmacologic thrombolysis via plasminogen activators with the potential for mechanical thrombectomy under certain clinical circumstances2.
The development of novel pharmacologic treatment strategies fundamentally relies on both in-vivo animal models and in-vitro digestion models for preclinical testing3,4. In-vivo models naturally benefit from their ability to capture the complex interaction of various physiologic parameters on treatment efficacy that include clearance of pharmaceutical agents as well as cellular interactions with drugs. However, this same complexity often makes such models quite costly and introduces additional issues when attempting to isolate underlying pharmaco-dynamics/kinetics in animals that significantly differ from human physiology. The development of in-vitro models has helped by facilitating a distilled testing setting in which drug development and screening can be performed but often lacks the fidelity necessary to recapitulate the disease state being studied.
Commonly found in-vitro protocols for testing novel thrombolytics rely on the utilization of clots formed and lysed under static conditions whereby the residual clot mass serves as the primary endpoint5,6. Unfortunately, such techniques fail to account for the mechanical aspects of clot lysis such as turbulent flow and trans-thrombus pressure drops that can significantly alter the pharmacodynamics of test drugs. Additionally, clots formed under static conditions contain microarchitecture that differs from physiologic clots. The presence of shear during clot formation has reproducibly been shown to impact the resulting clot characteristics such as platelet activation and fibrin-crosslinking. Clots being produced under shear flow exhibit complex heterogeneity from tip-to-tail that is absent in statically formed clots7,8. Such departures from physiologic clot architecture may impact important drug development characterization that includes drug penetration within a thrombus and subsequent lysis efficiency9.
To address some of these limitations associated with the use of static clotting/clot-lysis models, the adoption of the Chandler loop for both clot formation and clot lysis in the presence of shear has seen a resurgence10. Although such systems allow for a better representation of flow dynamics and generate clots with more physiologically relevant architecture compared to relatively static assays, their simplified flow conditions still represent a deviation from physiologic conditions. Lastly, microfluidic approaches have also been undertaken due to their ease of imaging and uniform flow patterns; however, they remain a significant removal from the physiologic conditions expected within the larger vessels primarily affected in most clinically relevant thrombo-embolic disorders11,12.
With the above discussion in mind, we developed a high-fidelity, in-vitro thrombolysis model for preclinical thrombolytic drug screening. The model aims at addressing some of the current pitfalls detailed above in the realm of novel thrombolytic therapy screening and was validated for reproducibility and sensitivity at varying concentrations of tissue plasminogen activator (tPA). The system described herein offers physiological shear flows utilizing a peristaltic pump, a pressure dampener, a heated reservoir, two pressure sensors, an in-line fluorometer, and a fluorescently labeled Chandler loop shear-formed clot analog to facilitate real-time tracking of fibrinolysis13. Taken together, the overall system is called the Real-Time Fluorometric Flowing Fibrinolysis Assay (RT-FluFF Assay)14 and this manuscript will discuss the intricacies of successfully setting up and running assays in this high-fidelity in-vitro thrombolysis model.
Protocol
Loading...
$$\rightleftharpoonup{xx}$$
$$\longleftharp{xx}$$,
$$\longrightharp{xx}$$,
All methods mentioned below are in accordance with institutional review board (IRB) protocols and the institutional human research ethics committee. All healthy volunteers provided written and informed consent prior to blood donation. Of note, all materials referenced within the protocol can be found in the Table of Materials. While human WB and plasma are discussed throughout this protocol, the use of research animal blood and factor-depleted blood products can be purchased and substituted.
1. Whole blood collection
- Collect venous whole blood (WB) from consenting healthy volunteers using standard phlebotomy techniques.
CAUTION: Ensure that universal precautions are followed to reduce the risk of contact with blood or other potentially infectious materials throughout this protocol. The use of gloves, a laboratory coat, and a face shield are necessary. - Collect ~50 mL of WB directly into 3.2% sodium citrate tubes and immediately pool into 50 mL tubes for subsequent use.
NOTE: A discard tube prior to blood collection into the citrate tube is necessary in addition to ensuring that tubes are filled to their manufacturer-recommended volume. Freshly collected WB will best recapitulate the clotting dynamics of the host. Short-term storage of WB at room temperature (≤4 h prior to use) is allowable. WB is not stored overnight as this has been shown to impact clotting dynamics when examined via thromboelastography15.
2. Clot formation
- Into 3 mL of citrated whole blood, add fluorescently (fluorescein isothiocyanate [FITC]) tagged fibrinogen (FITC-Fg) to a final concentration of 60 µg/mL (ratio of 1:50 fluorescently tagged fibrinogen to unmodified fibrinogen assuming an endogenous plasma fibrinogen concentration of 3 mg/mL).
NOTE: This ratio can be increased to as high as 1:10 with minimal impact on clot morphology.13, 14 Fluorescently tagged fibrinogen can be purchased or generated by reacting fibrinogen with fluorescein isothiocyanate (FITC). Fibrinogen mixing should be done ≤5 min before the run begins.- If fibrinogen had been previously aliquoted and frozen, inspect the thawed FITC-Fg to ensure polymerization has not begun prematurely thus rendering it unusable (ensure the absence of particulates or fibers in the solution).
- Prepare the Chandler loop setup with a 120 mm diameter drum in a 37 °C water bath (Figure 1). Ensure that the Chandler loop device is capable of rotating at a fixed rotational rate of 0-90 rpm during the entire clot formation process.
NOTE: Additional Chandler loop setup and modifications can be found in Zeng et al.16. - Cut tubing (internal diameter 5/32", outer diameter 7/32") and form loops that fit firmly but not tightly around the drum. For the recommended tubing size discussed here, cut a standard 200 µL PCR tube for use as a fitting to connect the ends of the tubing to form the closed loop.
NOTE: Different tubing sizes can be utilized to produce different-sized clots16. - Initiate clotting of blood by adding 200 mM Calcium Chloride solution in a ratio of 1:17 calcium solution to whole blood. Load the blood into the tubing (fill ~50% of the tube volume) using a 3 mL syringe. Immediately place the loop onto the Chandler loop drum connecting the ends and begin rotation.
- Ensure proper mixing with gentle inversion before loading to avoid any issues stemming from the settling of WB components.
- Ensure that an equal amount of blood is added to each tube every run as this can impact the clot size if not held consistent.
- As bubbles within the column of blood can also impact blood clotting, remove them by gently moving the tube in a "see-saw" like manner to facilitate the escape of bubbles before loading them onto the drum.
- Rotate the drum partially submerged in the water bath at a rotational rate of 40 RPM to achieve a calculated shear rate of ~450 s-1.
NOTE: Refer to Zeng et al. for information on calculated shears based on tubing size and rotation speed (20 to 60 RPM)16. Typical venous and arterial shear rates are 20-200 s-1 and 300-1,000 s-1, respectively, with ~400-500 s-1 being representative of the pulmonary artery. - Allow clots to form for 40-60 min under low light conditions to minimize photobleaching of the fluorescently tagged fibrinogen.
- After the desired clotting time is reached, remove the clots from the tubing and use them immediately. To ensure gentle removal of the clots without compromising structure, gently invert the tubing to allow the clot to slowly slide out of the tube into a small container.
NOTE: Storing formed clots in citrated plasma or PBS overnight at 4 °C may impact subsequent analysis of clot digestion in the flow loop.
3. RT-FluFF instrument setup
- Ensure the flow loop apparatus is connected as seen in Figure 2 and that all connections are secure. In short, the flow loop apparatus includes, in the order of the direction of flow: Pump > Dampener > Inlet Pressure Sensor > Clot > Outlet Pressure Sensor > Fluorometer > Heated Reservoir > Pump. Adjust the selection of pump capacity, experimental flow rate, tubing diameter and length, temperature, reservoir volume, and clot size/geometry to suit the experimental needs unique to each study.
NOTE: For this example, the same diameter tubing used in the Chandler loop was used for RT-FluFF. The tubing can be used for multiple runs on the same day but needs to be monitored for degradation or leaking and changed/rinsed as needed. Rinsing is recommended with warm distilled water between runs. Depending on the experimental design, it may be necessary to replace the tubing after every run. - Once all tubing is secured, turn on the pressure monitor. Check that the pressure monitor reads 0 mmHg for both the inlet and outlet sensors. If it does not, open the valves to ensure that the pressure sensors are open to atmospheric pressure and zero the sensors.
- Turn on the heating block or water bath being used and monitor the temperature over the course of the experiment. Keep the temperature close to 37 °C to mimic physiologic human body temperature.
- Turn on the pump to the desired flow rate to check for leaks and verify that the pressure sensors are functioning.
NOTE: A flow rate of ~160 mL/min in this tubing size will represent a shear rate of ~500 s-1. - Turn off the pump to facilitate clot loading.
4. Loading the clot into the flow loop
- If a previously made clot that was stored is being used be sure to bring the clot to room temperature before loading it into the flow loop system.
- Clot mass loss is an important endpoint measurement for thrombolysis assays. It is best practice to measure clot mass just before loading it into the flow loop instead of relying on prior measurements.
- Clot mass measurements should always be done in the same fashion every time to ensure consistency across samples and across assay days as liquid content within and on the clots can significantly impact their mass. The best practice is to gently blot clots on laboratory wipes until they no longer release a significant amount of liquid onto the wipe being careful not to compress the clot throughout the measurement process.
- Submerge the clot in the plasma (autologous or type-matched), or other mobile phase solution used in the flow loop (such as PBS or defined media) in a shallow container such as a weighing dish. The mobile phase solution should be taken directly from the 50 mL system reservoir to control for total system volume. No thrombolytic or pharmaceutical testing agent should be present during the clot-loading stage. The total volume of the mobile phase for running the flow loop is recommended to be ≥50 mL and should be consistent across all samples.
- Remove the central section of the flow loop tubing (between inlet and outlet sensors) and attach a 10 mL syringe to one end of the tubing.
- Using the free end of the tubing, place it in the plasma (or mobile phase) and take up a small volume of the solution to prime the tubing. Then place the tubing inlet near the clot carefully examining the clot to identify the head (typically the slightly thicker end of the clot) and tail (end opposite the head). The head of the clot should be positioned towards the inlet pressure sensor and away from the outlet. Place the tubing at the "tail" end of the clot and aspirate it into the tubing with the syringe.
NOTE: in cases where clot head/tail directionality cannot be visually determined, directionality can best be assigned based on knowing the direction of rotation from the Chandler loop-the clot head faces in the opposite direction of the drum rotation. - Attach the tubing back to the main apparatus such that the clot is closest to the outlet pressure sensor (the head of the clot should be facing away from the outlet sensor). Secure the clot in its position by puncturing the tubing and the clot head with two 30 G needles in an "X" pattern. Leave these needles in for the duration of the run.
NOTE: Depending on the dampener and pump settings, additional needles may be necessary to ensure the clot does not fragment prematurely. If necessary, a screen can be added to the tubing downstream of the clot to prevent clot fragments from circulating in the system. Once a set number of needles has been established to hold the clot, keep this consistent across conditions. - Take the remainder of the mobile phase solution and put it into a 50 mL tube as the reservoir.
- Place the reservoir in the water bath and put in the inlet and outlet tubing (the outlet is from the fluorometer and the inlet goes into the pump head).
- Check that the fluorometer being used is connected and monitored. Check that the initial value is appropriate compared to a mobile phase-only system baseline at the start of the experiment.
NOTE: If an in-line fluorometer is not available, serial periodic sampling of the reservoir can be carried out at defined intervals throughout the flow loop analysis period. Collected fractions can be read using a 96-well plate immediately following the completion of the experiment on any commercially available spectrophotometer. - Add 500 µL of 100,000 ng/mL tPA directly to the reservoir volume to achieve a final 1,000 ng/mL tPA concentration in 50 mL. The volume, concentration, and specific drug added will depend upon the desired target circulating concentration and system reservoir volume.
- Check the following before starting the pump:
- All junctions are secure.
- The two valves above the pressure sensors are in the appropriate closed position.
- Any residual plasma (or fluid) has been replaced in the reservoir.
- The thrombolytic has been added to the reservoir and properly mixed.
- The inlet tubing is near the bottom of the reservoir (this ensures minimal bubbles).
- Outlet tubing is secure and at the appropriate height for the desired pressure (dependent upon which vessel location is being modeled).
- The pump rotation direction is correct (Flow order: Pump > Dampener > Clot > Fluorometer > Reservoir > Pump).
- If pump RPMs are set very high (>150 rpm), start at a slower speed and ramp up to ensure the rapid change in pressure does not fragment the clot or cause tubing leakage.
- Ensure the system is recording the data appropriately from the fluorometer and/or supplies are prepared for periodic sampling of the mobile phase for post experiment time point reads.
- Turn on the pump and set it to achieve the desired volumetric flow rate of 160 mL/min or increase the flow rate until the desired pressure is achieved. The system will fill with fluid and bubbles. The bubbles will artificially raise the fluorometric readings, so watch for the bubbles to clear. Once they do, turn off the lights and begin data acquisition.
- Leave the pump running until the clot is significantly degraded or the desired experimental time has elapsed (≥60 min). Add reagents, as needed, to the system throughout the experiment via the reservoir to create unique experimental conditions testing a variety of thrombolytic variations.
NOTE: The experimental time will depend on the pump flow rate (shear level) and concentration of thrombolytic. - Once the assay has been completed, reduce the volumetric flow rate, and remove the inlet tubing while the pump is still running to push most of the fluid in the system into the reservoir (some mobile phase will remain in the tubing). Disconnect the clot-containing tubing section at the outlet pressure sensor side of the tubing and lower it into a weigh boat.
- Remove the needles that hold the clot in place to collect the remnant fluid from within the system and clot/clot fragments. Use a syringe to help clear the system as needed.
- Weigh and process the remaining clot for additional analysis such as the calculation of percent mass lost or for histology.
5. Cleaning the system
- Between samples, rinse the entire system with warm water at a high rpm (>150 rpm). Load the water into the reservoir and run through the system for at least 2 min, empty, and run again for two complete system rinses. After these rinses, if the fluorometer reading does not return to baseline, repeat the rinse process for an additional cycle. If it still has not returned to baseline, completely change the tubing before assaying the next sample.
NOTE: During the experiments, tubing can be reused between samples; however, due to the perforation with needles used to hold the clot in place, the tubing section between the inlet and outlet pressure sensors should be replaced after each run. Under some experimental conditions, replacing the entire tubing set after each run or clustering assays may be necessary to eliminate any sample crosscontamination. - After all samples have been run for that day's experimentation, remove all tubing and discard. Scrub the T-junctions with hot water and a bristle brush until clean and leave to dry and rinse the syringe dampeners with hot water. Use 70% EtOH to help with sterility.
Results
Loading...
$$\rightleftharpoonup{xx}$$
$$\longleftharp{xx}$$,
$$\longrightharp{xx}$$,
Chandler loop clot formation
In forming clots, we generally aimed for quadruplicates to ensure that if any clot outliers (based on gross morphology and mass) existed, we still had the ability to run triplicate thrombolysis assays. Assuming optimal loading conditions, clots should all be quite uniform in length (~3.3 cm), weight (~100 mg), and appearance as is represented in Figure 3. When employing FITC-Fg, we also aimed to examine clots under UV light to ensure relatively uniform dispersion of fluorescence as opposed to irregular areas of hyper-fluorescent labeling within the clot. Varying the degree of FITC-Fg within the whole blood should not alter clot weights or appearances within our explored concentrations; however, micro clot architecture was impacted at the highest FITC-Fg concentrations (1:5 FITC-Fg to unmodified Fg). Prior work done by Zeng et al. captures the wide range of clot phenotypes expected in the Chandler loop depending on the shear level chosen16.
At times, aberrant clotting can occur. The most common clot formation issues fall into one of two categories: (i) premature clotting and (ii) impaired clotting. In premature clotting, the entire volume of blood will solidify within the Chandler loop tubing. This will become apparent when the drum rotation is turned on as the blood will not "flow" but rather stick to the walls of the tubing and rotate in unison. In such circumstances, these clots are not usable and must be discarded. To avoid this, ensure that once clotting is activated with the addition of calcium chloride the loop is immediately closed and placed on the rotating drum for clotting to ensue. The second circumstance, or impaired clotting, occurs when samples have not been adequately mixed or if the blood has started to clot before the rotation is started but not quite as significant as in circumstance (i). Clots with the above issues will tend to appear stringy and flimsy when handled and often have significantly elevated clot masses. Phenotypically, they will approximate clots seen at very low venous shears as this essentially represents clotting in the setting of stasis. Irregular clots should be expected on occasion and discarded.
RT-FluFF fluorometer calibration
An important feature of the RT-FluFF system is the fluorometer, or spectrophotometer, used to track thrombolysis over the elapsed clot digestion period. Prior to any experiments being run, ensuring the proper functioning of the fluorometer, or spectrophotometer, is critical. For our purposes, since we designed our fluorometer specifically for the RT-FluFF apparatus, we needed to ensure it correlated well with the spectrophotometer in the presence of known amounts of FITC-Fg dilutions in a static solution (Figure 4A). Once we were able to confidently determine the linear range of our fluorometer, we next aimed to see how the fluorometer would behave in the presence of flow. We verified functionality by incrementally injecting fluorescein into the flowing solution to monitor a stepwise increase in fluorescence to better understand fluorometer reading reproducibility and determine how rapidly fluorescence equilibrated within the flowing system (Figure 4B). Follow-up experiments were performed by steadily injecting both fluorescein and FITC-Fg into the solution in a continuous manner to better mimic the continuous fluorescent release expected from the fibrinolysis experiments (Figure 4C). The differences in slope depicted between FITC-Fg and FITC are thought to arise from the effects of quenching that occurs when FITC is conjugated in proximity to itself, such as when many FITC molecules are conjugated to a single protein (fibrinogen in this case). Naturally, the stepwise increases and slopes will differ not only based on the concentrations of FITC/FITC-Fg utilized but also the number of FITC molecules per fibrinogen. By extension, it becomes pivotal to control for the degree of FITC to fibrinogen conjugation when performing experiments utilizing the RT-FluFF if the hope is to compare data across numerous clot batches. Through extensive experimentation, we have found that ~14 FITC conjugations per fibrinogen provide for good fluorescent signal to track clot digestion while remaining stable in solution (limited premature aggregation) and with minimal impact on the resulting clot microstructure. It is important to note that anytime pure, non-clotted, FITC-Fg is run through the RT-FluFF apparatus, the exposure of FITC-Fg to high shear may promote its aggregation. This phenomenon is most often observed at the junctions of tubing connections and within the pump head tubing and over time can impact available in-solution fluorescence.
When collecting samples from the flow loop at discrete time points to read fluorescence on a spectrophotometer many of these considerations associated with fluorometer calibration are not necessary. However, it is still necessary to explore the dynamic range of the specific spectrophotometer being utilized to ensure FITC-Fg labeling, the amount of FITC-Fg in the Chandler loop formed clot, and the size of the clot are all optimized in your system. It is recommended that samples are either read immediately following isolation from the system or placed in a 96-well plate for multiplex reads following the experiment's completion. If necessary, samples can be acidified directly following collection to eliminate further enzymatic activity prior to being analyzed.
RT-FluFF clot lysis
To validate the RT-FluFF system utilizing clots formed under arterial shears in the Chandler loop, we employed human plasma as the mobile phase in the apparatus with tPA (Alteplase) as a fibrinolytic agent. Concentrations of tPA explored ranged from 0 to 1,000 ng/mL. To mimic human pulmonary flow conditions, the temperature of the plasma reservoir was maintained at 37 °C and physically raised to 8 cm above the clot level to give an average flow pressure of 12 mmHg with the pump rate adjusted to generate an ~500 s-1 shear flow in the absence of clot. Pulsatile flow dampeners were added to the system to ensure minimal variation between peak and trough pressures from the peristaltic pump to achieve a nearly constant shear rate (Figure 4D). In the absence of a pressure dampener, the output pressure of the peristaltic pump fluctuates significantly due to the nature of how it produces flow by ejecting small packets of liquid through the system as the pump head rotates. Clot lysis was observed over the course of 60 minutes. As expected, rising concentrations of tPA made for increased rates of clot lysis (RFU/minute) and heightened mass loss compared to conditions with less or no tPA. At a tPA concentration of 1,000 ng/mL, ~85% clot lysis was achieved over a 60 min digestion period. Examining gross images of clots undergoing lysis one can appreciate that lysis will primarily occur in the tail regions of the clot before impacting the more densely structured head as seen both by physical degradation of clot architecture and loss of surface fluorescence. Expected stretching of clots will also occur based on loss of mechanical integrity over time in a shear rate-dependent manner.
Although significant differences in clot lysis rates can be appreciated, grossly and based on fluorescence release, there is no perfectly linear correlation between fluorescence release and the amount of fibrinolytic present. This is best appreciated in Figure 5. Fibrinolysis in WB-based clots naturally leads to the release of not only FITC-Fg fragments but also red blood cells (RBCs) that are entrapped within the fibrin networks during clot formation. Release of these RBCs into circulation within the RT-FluFF apparatus will begin to noticeably tinge the circulating plasma red as a result. This colorimetric change in the circulating plasma can negatively impact the fluorescent emission from circulating FITC-Fg being read by the fluorometer sensor. As fibrinolytic concentrations reach the upper limits, the degree of FITC-Fg release into solution overpowers the RBC effects on the fluorescence emissions.

Figure 1: Schematic representation of the Chandler Loop setup. Blood-filled tubes loaded on the Chandler loop drum are submerged in a 37 °C water bath throughout the clot formation process with the lights dimmed. The drum is rotated at a constant rotational rate via a DC motor, drive shaft, and control board. This figure has been modified from Zeng et al14. Please click here to view a larger version of this figure.

Figure 2: Schematic representation of the RT-FluFF system. Important components of the system are identified on the image. A single large-volume dampener is pictured in the image to minimize pulsations in the flow associated with the use of a peristaltic pump. In the absence of an in-line fluorometer, two additional options for periodic sampling include: 1) sampling directly from the reservoir; or 2) incorporating an in-line sampling port to extract the mobile phase from. This figure has been modified from Zeng et al14. Abbreviation: RT-FluFF = Real-Time Fluorometric Flowing Fibrinolysis Assay. Please click here to view a larger version of this figure.
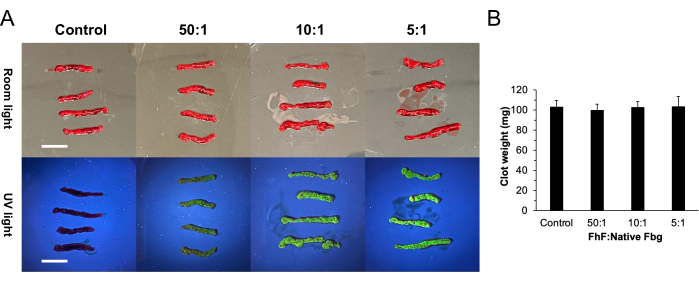
Figure 3: Gross Chandler loop FITC-Fg-tagged WB clot characteristics, including mass and physical appearance under ambient and UV light. (A) Consistent clot formation under diverse clotting conditions is achievable through fine-tuning of the Chandler loop clot formation protocol. It is important to note that clot masses and appearances will vary significantly depending on the tubing diameter, rotation speed, and length of clot formation time. Clots pictured were formed at 37 °C for 1 h at a shear rate of 506 s-1. Scale bars = 20 mm. (B) Masses of clots formed in the Chandler loop utilizing respective ratios of FITC-Fg. The data represents the mean ± standard deviation for greater than or equal to triplicate data points. This figure has been modified from Zeng et al14. Abbreviations: FITC-Fg = fluorescein isothiocyanate-tagged fibrinogen; WB = whole blood. Please click here to view a larger version of this figure.

Figure 4: Fluorometer characterization. (A) RT-FluFF in-line fluorometer comparison against a spectrophotometer in the context of known amounts of FITC-Fg dilutions. (B) Stepwise introduction of fluorescein into the RT-FluFF system to determine fluorometer reproducibility and fluorescence equilibration time in flowing human plasma. (C) Continuous infusions comparing fluorescein and FITC-Fg in the RT-FluFF platform. The differences in slope likely stem from fluorescence quenching in the FITC-Fg group. (D) Outlet pressure sensor (post clot) waveforms associated with the use of different-sized dampeners under the same volumetric flow rate conditions. This figure has been modified from Zeng et al14. Abbreviations: FITC-Fg = fluorescein isothiocyanate-tagged fibrinogen; RT-FluFF = Real-Time Fluorometric Flowing Fibrinolysis Assay. Please click here to view a larger version of this figure.

Figure 5: Thrombolysis in the RT-FluFF platform. (A) Representative slopes of fluorescence rise over the course of 60 min of clot digestion in the presence of circulating tPA. Note the initial thrombolysis lag time as tPA activation of plasminogen and clot digestion is not instantaneous. (B) Percent clot mass lost at various concentrations of tPa and varying thrombolysis modalities that include: the RT-FluFF system, Chandler loop clot digestion under constant shear, and static (no shear) clot digestion. The data represents the mean ± standard deviation for greater than or equal to triplicate data points with double asterisks denoting a p-value < 0.01 and triple asterisks signifying a p-value < 0.001. (C) Gross characteristics of thrombolysis at 200 ng/mL of tPA. This figure has been modified from Zeng et al.14. Abbreviations: RT-FluFF = Real-Time Fluorometric Flowing Fibrinolysis Assay; tPA = tissue plasminogen activator. Please click here to view a larger version of this figure.
Discussion
Loading...
$$\rightleftharpoonup{xx}$$
$$\longleftharp{xx}$$,
$$\longrightharp{xx}$$,
Clot formation and labeling
The Chandler loop has been demonstrated to provide an easy and effective means of reproducibly generating clots that mimic in-vivo thrombi16. Fine-tuning parameters such as tubing size, rotational speeds, drum diameter, and clotting time allow for the rapid generation of clots under differing shear conditions that can capture architectural features appreciated in a range of thrombi mimicking both arterial and venous sources. The additional flexibility of being able to introduce markers such as FITC-Fg expands the potential uses of these thrombi as we have demonstrated in the RT-FluFF system. As rudimentary as the underlying principles of the Chandler loop are, there remains a steep initial learning curve associated with consistent clot formation while simultaneously handling blood and blood products throughout the clot formation process. This stems from the fact that coagulation of WB is extremely sensitive to handling in the moments preceding and following the initiation of clotting. Of particular importance is the selection of the tubing used during the clot formation step in the Chandler loop as blood surface interactions can impact clot formation progression. Tubing should be of medical or surgical grade (non-pyrogenic and non-hemolytic) exhibiting low bio-reactivity. As discussed in our results, variation in formed clots is expected in the initial learning phases of the technique while developing one's optimal workflow based on experimental scale and unique assay modifications. The eventual achievement of reproducibility is pivotal given the impact of clot architecture on a clot's behavior when undergoing fibrinolysis. Lastly, variation in coagulation, even amongst healthy volunteers, is also to be expected and should be factored in during experimental design.
RT-FluFF assay
Fluorometric/spectrophotometric quantification of fibrinolysis with FITC-Fg as a marker provides numerous benefits over classic techniques that have primarily relied on endpoint clot mass assessment. The ability to monitor, in real time or near-real time, fibrinolysis dynamics in an environment that approximates physiologic flow parameters represents a significant improvement from traditional fibrinolytic drug screening assays. This assay was intentionally designed at the presented scale to more closely resemble clinically relevant clot sizes, flow field, volumetric flow rate, and clot mass burden rather than taking a fully miniaturized microfluidic approach. Scaling down RT-FluFF apparatus would mean that either smaller diameter tubing and/or shorter distances of tubing would have to be utilized. As a result, the system would begin to deviate from the desired flow patterns and physiologic relevance. Similar to the Chandler loop, the RT-FluFF system allows for the control of parameters such as shear rate by modulating flow pressures under constant flow and control over which flowing media is utilized. Additionally, the RT-Fluff system can also accommodate pulsatile flow and unique clot digestion geometries while still allowing for periodic sampling of mobile phase throughout the digestion process which is not possible in a Chandler loop due to its rotating closed digestion setup. The impact of these parameters on clot lysis has been explored in-depth as part of Zeng et al.14.
Taken together, the Chandler loop-formed clots and the RT-FluFF assay tubing can be of the same diameter or varied at both the clot formation and clot digestion steps to achieve differing levels of occlusion, modeling up through nearly full vessel occlusion to mimic thromboembolism. All assays described herein utilized the same tubing diameter in both the Chandler loop and the RT-FluFF system. With increased tubing diameter in the RT-FluFF system, the mobile phase reservoir volume may need to be increased to accommodate the additional volume needed to fill the system. Increasing the reservoir volume may also increase the necessary amount of thrombolytic/drug needed to be added to the system and would also increase the plasma or mobile phase needs. While the use of autologous plasma would be ideal, it would require exceedingly large amounts of blood to be drawn from individual donors to accommodate for the Chandler loop clot formation and the RT-FluFF mobile phase volumes across all assays and replicates needed to complete an entire experiment. For this reason, type-matched pooled plasma acquired either from a blood donation center or purchased from a commercial vendor was commonly employed. While the overall RT-FluFF assay tubing can be shortened to some degree, there are limitations such that all of the components have enough space to remain in the loop to run the digestion experiments. Of particular importance is the long portion of tubing utilized upstream of the clot itself needing to exceed a minimum length, calculated based on tubing diameter and flow rate, such that laminar flow is achieved by the time flow reaches the suspended clot. Regardless of tubing size selection, the same tubing considerations detailed in the Chandler loop clot formation step should also be applied to the RT-FluFF system tubing. It is important to reiterate that the tubing between the pressure sensors, where the Chandler loop formed clot is fixed in place via two inserted needles in an "X" pattern, must be replaced after every assay to prevent leaks from occurring at the needle puncture sites. The use of needles to hold the clot in place during digestion under flow limits clot bunching and provides clot orientation capabilities relative to the flow direction to improve assay-to-assay consistency. While a single representative clot digestion trial using tPA is described herein, the Chandler loop and RT-FluFF assay provide a high degree of customizability to accommodate a wide variety of clot structures, reporter molecules, shear rates, and digestion conditions to test novel fibrinolytics.
Limitations
As with any of the current platforms or methods utilized to screen fibrinolytic drugs, the RT-FluFF assay also suffers from certain weaknesses that must be acknowledged. First, clots formed in the Chandler loop, although exhibiting motifs commonly present in in-vivo clots, are still formed in a different environment than in-vivo clots where pulsatile flow and the interaction with endothelium exists17 Additionally, even though FITC-Fg concentrations were optimized to minimize the effects on clot architecture, the addition of the modified fibrinogen still represents a departure from physiologic conditions. The mobile phase media choice of plasma can impact the use of a fluorometer as there will be a small amount of background signal that is associated with the protein and lipid content of the plasma that may vary from donor to donor. A potentially significant limitation of the RT-FluFF setup is the negative impact of RBCs on fluorometric reads which restricts the use of WB as a mobile phase when utilizing FITC as a fluorescent clot-digesting marker. A feasible method to mitigate this is to introduce a centrifugation step to pellet RBCs prior to reading discrete time points on a spectrophotometer or to utilize a different clot digestion reporter tag that is less impacted by the presence of RBCs18. Careful consideration should be taken based on assay design to ensure that important variables are controlled for. For example, if plasma is the mobile phase of choice, then it is best to pool plasma across many donors to minimize donor-to-donor clotting and fibrinolysis variability. Lastly, as with any fluorescently tagged protein, the issue of quenching naturally arises due to the FITC tag being present in relative proximity to one another on the surface of the fibrinogen19.
Conclusions and future directions
Studying a dynamic process such as thrombolysis requires an equally dynamic environment in which physiologic conditions can be replicated and multiple parameters are able to be controlled simultaneously. The high-fidelity RT-FluFF system fills this gap and will serve as an important tool in the future development and screening of novel thrombolytics prior to their translation into animal models. RT-FluFF is a highly versatile platform, with multiple abilities that have not been discussed herein but could certainly be incorporated into protocols depending on the unique needs of pharmaceutical drug design, mode of action, or replication of diverse clotting disease states. The benefits we have been able to appreciate within the RT-FluFF system are as follows: (a) variable tubing geometries and configurations, (b) pressure monitoring in real-time correlating to the degree of lumen occlusion, (c) fluorescence measurements in real-time requiring no user intervention, (d) assay duration and sample frequency flexibility, (e) use of a reservoir to mimic in-vivo conditions, (f) in-vivo like shear flow-patterns, (g) option to include pulsatile flow, (h) significant flexibility in the Chandler loop formation of distinct disease representative clot analogs, (i) the ability to test drug impacts on clot formation or clot digestion, and (j) direct clot substrate imaging to track bulk clot digestion through the clear tubing additionally allows for post digestion, longitudinal video analysis.
Disclosures
Loading...
$$\rightleftharpoonup{xx}$$
$$\longleftharp{xx}$$,
$$\longrightharp{xx}$$,
The authors have no conflicts of interest to disclose.
Acknowledgements
Loading...
$$\rightleftharpoonup{xx}$$
$$\longleftharp{xx}$$,
$$\longrightharp{xx}$$,
Research reported in this publication was supported by the National Heart, Lung, And Blood Institute of the National Institutes of Health under Award Number R01HL167877. The content is solely the responsibility of the authors and does not necessarily represent the official views of the National Institutes of Health.
Materials
| Name | Company | Catalog Number | Comments |
|---|---|---|---|
| 30 G Disposable Hypodermic Needles | Exel International | 26439 | Other Consumables |
| 6 mm HSS Lathe Bar Stock Tool 150 mm Long | uxcell | B07SXGSQ82 | Chandler loop, |
| 96-Well Clear Flat Bottom UV-Transparent Microplate | Corning | 3635 | Other Consumables, Non-treated acrylic copolymer, non-sterile |
| Air-Tite Luer-lock Unsterile 60 mL Syringes | Air-Tite | MLB3 | RT-FluFF Apparatus , dampeners |
| Arium Mini Plus Ultrapure Water System | Sartorius | NA | DI water source |
| Calcium Chloride | Millipore Sigma | C5670 | Other Consumables |
| Disposable BP Transducers | AD Instruments | MLT0670 | RT-FluFF Apparatus |
| Drager Siemans HemoMed Pod | Drager | 5588822 | RT-FluFF Apparatus |
| Drager Siemans Patient Monitor | Drager | SC 7000 | RT-FluFF Apparatus |
| Drum (cylinder, diameter 120 mm, width 85 mm) | Chandler loop, | ||
| Face Shield | Moxe | SHIELDS10 | Chandler loop, |
| Fibrinogen From Human Plasma, Alexa Fluor 488 Conjugate | Thermo Scientific | F13191 | Other Consumables |
| Fitting, Polycarbonate, Four-Way Stopcock, Male Luer Lock, Non-Sterile | Masterflex | 30600-04 | RT-FluFF Apparatus |
| Fluorescein (FITC) | Thermo Scientific | 119245000 | Other Consumables |
| General-Purpose Water Bath | Thermo Scientific | 2839 | Chandler loop, |
| Hotplate 4 × 4 | Fisher Scientific | 1152016H | RT-FluFF Apparatus |
| Human Source Plasma Fresh-Frozen | Zen-Bio | SER-SPL | Other Consumables, CPDA-1 anticoagulant |
| Human Whole Blood | Zen-Bio | SER-WB-SDS | Other Consumables, CPDA-1 anticoagulant |
| L/S Easy-Load II Pump Head for High-Performance Precision Tubing, PPS Housing, SS Rotor | Masterflex | 77200-62 | RT-FluFF Apparatus, Pump Head |
| L/S Variable-Speed Digital Drive Pump with Remote I/O, 6 to 600 rpm; 90 to 260 VAC | Masterflex | 7528-10 | RT-FluFF Apparatus, Pump |
| Motor Speed Controller | CoCocina | ZK-MG | Chandler loop, |
| Nalgene Tubing T-Type Connectors | Thermo Scientific | 6151-0312 | RT-FluFF Apparatus |
| Peristaltic pump tubing | Masterflex | 06424-15 | Other Consumables |
| Phosphate buffered saline | Millipore Sigma | P3813 | Other Consumables, Powder, pH 7.4, for preparing 1 L solutions |
| Switching Power Supply | SoulBay | UC03U | Chandler loop, |
| Thermo Scientific National Target All-Plastic Disposable Syringes 10 mL | Thermo Scientific | S751010 | Other Consumables |
| Tissue plasminogen activator, human | Millipore Sigma | T0831 | Other Consumables |
| Tubing ID 1/4'', OD 3/8'' | Fisher Scientific | AGL00017 | Other Consumables, cut into 1.5cm sections use to connect tubing to T-type connectors |
| Tubing ID 5/32", OD 7/32" | Tygon | ND-100-65, ADF 00009 | Other Consumables |
| V3 365 nm Mini - Black Light UV Flashlight | uvBeast | uvB-V3-365-MINI | Chandler loop, used to check completed clots |
| ZGA37RG ZYTD520 DC Motor, 12 V, 100 rpm | Pangyoo | ZGA37RG | Chandler loop, |
References
Loading...
$$\rightleftharpoonup{xx}$$
$$\longleftharp{xx}$$,
$$\longrightharp{xx}$$,
- Ali, M. R., et al. Aspect of thrombolytic therapy: a review. Scientific World Journal. 2014, 586510(2014).
- Bhogal, P., Andersson, T., Maus, V., Mpotsaris, A., Yeo, L. Mechanical thrombectomy-A brief review of a revolutionary new treatment for thromboembolic stroke. Clin Neuroradiol. 28 (3), 313-326 (2018).
- Fluri, F., Schuhmann, M. K., Kleinschnitz, C. Animal models of ischemic stroke and their application in clinical research. Drug Des Devel Ther. 9, 3445-3454 (2015).
- Kaiser, E. E., West, F. D. Large animal ischemic stroke models: replicating human stroke pathophysiology. Neural Regen Res. 15 (8), 1377-1387 (2020).
- Elnager, A., et al. In vitro whole blood clot lysis for fibrinolytic activity study using d-dimer and confocal microscopy. Adv Hematol. 2014, 814684(2014).
- Prasad, S., et al. Development of an in vitro model to study clot lysis activity of thrombolytic drugs. Thromb J. 4, 14(2006).
- Robbie, L. A., Young, S. P., Bennett, B., Booth, N. A. Thrombi formed in a Chandler loop mimic human arterial thrombi in structure and RAI-1 content and distribution. Thromb Haemost. 77 (3), 510-515 (1997).
- Mutch, N. J., et al. Model thrombi formed under flow reveal the role of factor XIII-mediated cross-linking in resistance to fibrinolysis. J Thromb Haemost. 8 (9), 2017-2024 (2010).
- Blinc, A., Kennedy, S. D., Bryant, R. G., Marder, V. J., Francis, C. W. Flow through clots determines the rate and pattern of fibrinolysis. Thromb Haemost. 71 (2), 230-235 (1994).
- Mutch, N. J., et al. The use of the Chandler loop to examine the interaction potential of NXY-059 on the thrombolytic properties of rtPA on human thrombi in vitro. Br J Pharmacol. 153 (1), 124-131 (2008).
- Herbig, B. A., Yu, X., Diamond, S. L. Using microfluidic devices to study thrombosis in pathological blood flows. Biomicrofluidics. 12 (4), 042201(2018).
- Jigar Panchal, H., Kent, N. J., Knox, A. J. S., Harris, L. F. Microfluidics in haemostasis: A review. Molecules. 25 (4), 833(2020).
- Zeng, Z., et al. Fluorescently conjugated annular fibrin clot for multiplexed real-time digestion analysis. J Mater Chem B. 9 (45), 9295-9307 (2021).
- Zeng, Z., Christodoulides, A., Alves, N. J. Real-time tracking of fibrinolysis under constant wall shear and various pulsatile flows in an in-vitro thrombolysis model. Bioeng Transl Med. 8 (3), e10511(2023).
- Christodoulides, A., Zeng, Z., Alves, N. J. In-vitro thromboelastographic characterization of reconstituted whole blood utilizing cryopreserved platelets. Blood Coagul Fibrinolysis. 32 (8), 556-563 (2021).
- Zeng, Z., Nallan Chakravarthula, T., Christodoulides, A., Hall, A., Alves, N. J. Effect of Chandler loop shear and tubing size on thrombus architecture. J Mater Sci Mater Med. 34 (5), 24(2023).
- Touma, H., Sahin, I., Gaamangwe, T., Gorbet, M. B., Peterson, S. D. Numerical investigation of fluid flow in a chandler loop. J Biomech Eng. 136 (7), (2014).
- Wojdyla, M., Raj, S., Petrov, D. Absorption spectroscopy of single red blood cells in the presence of mechanical deformations induced by optical traps. J Biomed Opt. 17 (9), (2012).
- Wu, J. H., Diamond, S. L. A fluorescence quench and dequench assay of fibrinogen polymerization, fibrinogenolysis, or fibrinolysis. Anal Biochem. 224 (1), 83-91 (1995).
Reprints and Permissions
Request permission to reuse the text or figures of this JoVE article
Request Permission