Preterm birth (delivery < 37 weeks) is an urgent global health issue with suboptimal prevention and treatment options. We present a mouse model of ascending vaginal bacterial infection-induced preterm birth and outline how to analyze the resulting neonatal morbidity and mortality.
Method Article
Modeling Ascending Vaginal Infection, Preterm Birth, and Neonatal Morbidity in Mice
In This Article
Summary
Abstract
Preterm birth continues to be a primary cause of neonatal mortality and morbidity globally, with limited preventative therapies. There is an imperative need for clinically
relevant and reproducible animal models for the translation of innovative interventions
to become a reality. Various mouse models of preterm birth exist. However, they do not recapitulate human neonatal morbidities, including neuropathological changes and
lung injury, which are characteristic sequelae of ascending infection and preterm birth. We have characterized a model which, to our knowledge, is the only one that mimics the human scenario whereby these neonatal morbidities are present following the induction of preterm birth by a live bacterium that ascends from the vagina. This paper demonstrates the intravaginal administration of a bioluminescent strain of Escherichia coli and details the assessment of neuropathological outcomes and lung injury using immunohistochemistry and histology techniques.
Introduction
Preterm birth (PTB; delivery < 37 weeks) is the main contributor to neonatal mortality worldwide1,2. Accounting for 11% of all births, it is a major global health problem with a complex etiology that is poorly understood, making it difficult to predict and prevent3,4,5. Neonatal survivors of PTB may experience adverse neurodevelopmental outcomes, including cerebral palsy, respiratory disorders, such as bronchopulmonary dysplasia (BPD), and gastrointestinal disturbances such as necrotizing enterocolitis (NEC)6,7,8. Therefore, there is an urgent need for clinically relevant, reproducible animal models to address the biological pathways contributing to PTB and develop innovative interventions.
There are a number of possible mechanisms underlying spontaneous PTB, such as decidual senescence, a breakdown of maternal-fetal tolerance, stress, short cervical length, or cervical damage9. However, at least 40% of spontaneous PTBs are reported to be associated with microbial infection10,11. Microbes ascending from the vaginal canal through the cervix to the uterus are hypothesized and widely accepted as a common route of infection due to the correlation between the microbes isolated from the amniotic fluid and those resident in the vaginal microbiota12,13,14. Microorganisms often associated with preterm delivery include species of Mycoplasma, Ureaplasma, Fusobacterium, and Streptococcus, and most cases are polymicrobial15,16.
Mice are often used to model PTB, with the most common approach being the administration of the bacterial toxin lipopolysaccharide (LPS), which can be delivered via intrauterine, intraperitoneal, or intra-amniotic routes to induce levels of inflammation necessary to initiate parturition17. However, LPS does not model live microbial infection, and importantly, neonatal outcomes cannot be measured in these models as LPS induces fetal death18. In recent years, animal models of ascending vaginal bacterial infection have been developed but recapitulating both preterm birth and the associated neonatal outcomes has been a challenge19,20,21,22,23,24.
Our group has established a novel model of ascending vaginal bacterial infection, preterm birth, and neonatal morbidity that recapitulates the pathophysiology of human PTB25. Here, we demonstrate how to assess neonatal neuropathology and lung injury in pups exposed to maternal ascending vaginal infection with a pathogenic Escherichia coli (E. coli) strain that has been linked to human neonatal meningitis. This model offers a unique opportunity to explore the pathophysiology of ascending infection, as well as providing the means to evaluate the effectiveness of preterm labor interventions in improving neonatal outcomes.
Protocol
Procedures were conducted under a UK Home Office License (PAD4E6357) in accordance with the Animal Scientific Procedures Act (1986) and the ARRIVE guidelines. Temperature (19-23 °C), humidity (~55%), and 12 h light/dark cycles were tightly controlled. Virgin female C57BL/6 Tyrc-2J mice (aged 6-12 weeks) were time mated overnight for 16-18 h. Evidence of the copulatory plug was assigned as embryonic day (E) 0.5.
Pathogenic E. coli O18:K1 (A192PP)26, a rat passaged strain of A192 (DSM. No. 10719)27, was modified to contain the lux operon (luxCDABE), originating from the nematode symbiont Photorhabdus Luminescens ATCC29999 (Hb strain), and including a kanamycin resistance cassette (Km2)28. This strain is categorized as Hazard Group 2 by the UK Government Advisory Committee on Dangerous Pathogens (ACDP). Wear appropriate personal protective equipment (PPE) and follow local guidelines when handling and disposing of biological agents.
1. Mouse model of ascending vaginal bacterial infection
- Preparation of E. coli cultures
- Prepare Luria-Bertani (LB) broth by dissolving the powder in distilled water (dH2O) to make a 20% solution and autoclave. Once the LB has cooled to room temperature, add 50 µg/mL kanamycin. Store at 4 °C for up to 1 week.
- Prepare a 20% Pluronic gel F127 solution by dissolving the solid in sterile phosphate-buffered saline (PBS). Vortex to mix and agitate at 4 °C overnight.
- Add 10 mL of antibiotic-treated LB broth to a sterile 30 mL universal container. Remove a frozen glycerol stock of E. coli from -80 °C storage. Using a sterile pipette tip, scrape the frozen glycerol stock of E. coli to lightly coat the end of the tip and eject the tip directly into the LB broth. Secure the universal container with parafilm, label it as a biohazard, and place it in an orbital shaker overnight (200 rpm) at 37 °C.
- The following morning, dilute the bacterial culture 1:100 (0.1 mL of culture + 9.9 mL of fresh LB broth) and return it to the orbital shaker for 1.5-3 h (200 rpm at 37 °C), regularly checking the growth of the culture by measuring the absorbance at 600 nm. Pipette 100 µL of the culture in duplicate into a clear, flat-bottomed 96-well plate. Measure the absorbance on a spectrophotometer with pathlength correction activated. An OD600 between 0.5 and 0.7 signifies the midlogarithmic-phase of growth.
- When OD600 0.5-0.7 is reached (~108-9 colony-forming units [CFU]), remove 100 µL from the bacterial culture and dilute in 900 µL of sterile PBS. Centrifuge at 14,000 × g for 1 min to wash the bacterial pellet and remove the LB broth. Remove the supernatant, resuspend the bacterial pellet in sterile PBS, and dilute 1:10,000 in sterile PBS (to 102-3 CFU).
- Disinfect all tips and containers exposed to bacteria prior to disposal.
- Anesthesia
- On E16.5, anesthetize pregnant mice by the inhalation of isoflurane (5% for induction, 1.5% for maintenance in oxygen). Transfer the flow of anesthesia and then the animal to the nose cone, placing the female in the prone position. Confirm anesthesia via the absence of a toe-pinch reflex and maintain isoflurane at the minimum percentage required for the procedure.
CAUTION: Isoflurane is an eye and skin irritant and central nervous system toxicant. Wear appropriate PPE. Always use a scavenging system. - Administer 20 µL of midlogarithmic-phase E. coli (1 × 10²-3 CFU resuspended in sterile PBS) or sterile PBS (vehicle control) into the vagina using a sterile 200 µL pipette tip (Figure 1). Using a fresh sterile 200 µL pipette tip, deliver 20 µL of 20% Pluronic gel F127 gel into the vagina to prevent bacterial leakage. Using sterile gauze, dab quinine powder onto the introitus to deter the mice from cleaning the bacterial suspension. Record the date and time of the treatment.
NOTE: CFU used were based on titration experiments to achieve the desired phenotype (preterm birth with live pups). CFU can be determined by performing serial dilutions and plating on LB agar plates29. - Singly cage animals in individually ventilated cages (IVC) and allow them to recover from the anesthesia before returning the cage to the holding room; clearly mark the cage as a biohazard. Monitor the animals until their normal behavior has resumed.
NOTE: This procedure should take no more than 5 min, and animals should recover quickly (within 2-5 min).
- On E16.5, anesthetize pregnant mice by the inhalation of isoflurane (5% for induction, 1.5% for maintenance in oxygen). Transfer the flow of anesthesia and then the animal to the nose cone, placing the female in the prone position. Confirm anesthesia via the absence of a toe-pinch reflex and maintain isoflurane at the minimum percentage required for the procedure.
- Measurement of gestational outcomes
- Set up CCTV by attaching one camera to the outside of each cage to monitor the mice for signs of parturition and pup delivery. Record the time taken until delivery as the number of hours from the time of intravaginal administration of E. coli or PBS (step 1.2.2) to the delivery of the first pup.
- Record the number of live/dead pups at delivery and calculate a percentage of survival per litter. Observe the dam and pups daily, recording the survival of pups up to 7 postnatal days and ensuring the recovery of the dams. Take other measurements, such as pup weight and length, during this period.
NOTE: Signals of parturition include increased grooming, spinning in circles, and stretching and kicking out their hind legs. As this is a live bacterial infection, the dams will develop symptoms over time (usually 24 h after treatment). The female should recover from the infection but if she is still exhibiting symptoms of infection after delivery, has not built a nest, or fed her pups within the first day, then humanely sacrifice the animals using Schedule 1 methods (such as exposure to CO2 in a rising concentration and confirming death by cervical dislocation).
- Bioluminescence imaging
- Following bacterial inoculation, image the females at 24 h and 48 h to track the spread of infection, as described below. Image the pups on postnatal day (P)0 up to P14 without the need for anesthesia.
- After opening the imaging software, click Initialize and wait for the camera to reach operating temperature (the temperature bar will turn green and "lock"). Check the box for Luminescent imaging, and confirm that the Excitation Filter is set to Block and the Emission Filter is set to Open.
- Anesthetize adult females by the inhalation of isoflurane (5% for induction, 1.5% for maintenance in oxygen). Place the animals in the supine position in the bioluminescence imaging machine (with a heated stage) while maintaining the anesthesia to the mice. Select Auto exposure time or manually set the exposure time (exposure range: 1 min - 5 min). After imaging, return the animals to their cages to recover from the anesthesia before returning them to the holding room.
- To measure the photon radiance quantitatively, select regions of interest (ROIs) on the mouse images and record the photons per second per centimeter squared per steradian (photons∙(second-cm2)-1∙sr-1).
2. Fetal and neonatal tissue analyses
- Perinatal tissue collection
- On E18.5, sacrifice the dam by exposure to rising CO2 concentration and confirming death by cervical dislocation and perform a mini laparotomy to remove the uterus; then, make an incision in the uterus using scissors.
- If collecting amniotic fluid, make a small incision in the membranes and collect the fluid using a Pasteur pipette or a needleless syringe.
- Using forceps, with one hand hold the outside of the uterus at the point where the placenta is attached and, with curved forceps in the other hand, gently detach the placenta from the inner uterine wall by teasing the tissues apart, carefully guiding the fetus, with the membranes and placenta attached, out of the uterus. Again, with forceps in each hand, gently hold down the placenta and grasp and pluck the membranes at the point where they meet the placenta (ensure that these come off cleanly).
- Now that the tissues are separated, collect the required gestational tissues (e.g., uterus, placenta, fetal membranes, cervix, and vagina) and dissect fetal tissues (e.g., brain, lungs, and gut).
- Immediately snap-freeze the tissues on dry ice or in liquid nitrogen and/or fix tissues in paraformaldehyde (PFA; 4% in PBS).
- Store snap-frozen tissue at -80 °C and fix the tissues for 24-48 h; then, store in 30% sucrose at 4 °C.
CAUTION: PFA is flammable and may cause eye, skin, and respiratory irritation. Prepare 4% solution in a biosafety cabinet and wear appropriate PPE when handling.
- Postnatal tissue collection
- On P7, anesthetize the pups using isoflurane (5% for induction, 1.5% for maintenance in oxygen).
- Perform exsanguination and tissue perfusion by incising the right atrium and inject 10 mL of PBS into the left ventricle. Decapitate the carcass and remove the brain and lungs using sterile scissors and forceps. Process and store tissue as described above.
NOTE: Maternal and fetal snap-frozen tissue can be analyzed for inflammatory and other mediators by qPCR, ELISA, and western blot. Protocols for these techniques are readily available from the reagent manufacturers or in other publications25,30,31.
- Cryosectioning of fetal and neonatal brains
- Using a blade, remove the cerebellum to create a flat surface and freeze the tissue on dry ice. Mount the frozen tissue on the specimen holder using optimal cutting temperature (OCT) compound, and cover the tissue in a thin layer of OCT. Allow to freeze (1-2 min).
- Using a cryostat set to -20 °C, ensure the lever is locked and load the specimen holder. Finely adjust the tissue position and lock in place. Trim the tissue and begin collecting tissue sections on microslides from the fusion of the corpus callosum, immediately freezing the sections on dry ice. Cut 50 serial 40 µm sections of each tissue.
CAUTION: Be careful with the sharp blade. - Store the frozen sections on microslides at -80 °C.
- Immunohistochemistry
NOTE: The protocol below can be used to identify astrocytes (glial fibrillary acidic protein; GFAP), microglia (allograft inflammatory factor 1; IBA-1), and neutrophils (lymphocyte antigen 6 family member G; Ly6G). Antibody information can be found in Table 1.- Select five sections per brain, 400 µm apart, which will allow the assessment of different brain regions at variable depths of the brain. Rehydrate frozen sections with a drop of dH2O and spread and unfold the tissue using two fine brushes. Dry the tissue under a fan for 20-30 min. Using a hydrophobic (PAP) pen, carefully draw around the tissue without touching it.
- On day 1, prepare 4% formaldehyde (FA) by adding 5.4 mL of formaldehyde in 50 mL of 0.1 M phosphate buffer (PB) for one 50 mL cuvette (15 slide capacity). Immerse the slides in FA for 5 min to fix the cryosections, allowing adhesion to the slides, and to immobilize antigens.
CAUTION: FA is flammable and can cause eye, skin, and respiratory irritation. Prepare a 4% solution in a biosafety cabinet and wear appropriate PPE when handling. - Prepare 0.1% bovine albumin serum (BSA) by adding 0.4 g of BSA to 400 mL of 0.1 M PB. Wash the sections 2x by immersing them in 0.1 M PB, followed by one wash in BSA (~3 s per wash). Store slides in
cuvettes containing BSA until needed. - Prepare humidity chambers by wetting tissue paper with dH2O and place these in the chamber, draining any excess water.
- Prepare 5% goat serum (50 μL of goat serum in 1 mL of 0.1 M PB). Carefully dry the slide around the tissue section with tissue paper, ensuring the PAP pen border is intact, then apply 50 μL of the solution per tissue section. Incubate in the humidity chamber for 30 min.
- Remove the serum by tapping the slide on clean tissue paper and add the primary antibody diluted in BSA (antibodies and dilutions are presented in Table 1). Incubate overnight at 4 oC.
- On day 2, incubate the secondary antibody in mouse serum (see Table 1) for 30 min at 37 oC, and add to BSA (1:100 dilution) (e.g., 5 mL BSA + 100 µL mouse serum + 50 µL secondary antibody).
- Wash the slides 2x by immersing them (~3 s) in BSA and then once in 0.1 M PB. Hold the slides in cuvettes containing BSA, and dab dry the border around each tissue section. Apply 50 µL of the secondary antibody solution per tissue section and incubate for 1 h in the humidity chamber.
- Prepare avidin biotin complex (ABC) (0.1% dilution) by adding 10 µL of A and 10 µL of B in 1 mL of 0.1 M PB. Immerse (~3 s) the slides 2x in BSA and once in 0.1 M PB, then place the slides in a cuvette containing 0.1 M PB. Dab dry the slides, apply 50 µL of ABC solution per slide, and incubate for 1 h in the humidity chamber.
- Prepare diaminobenzidine (DAB) solution. Weigh 25 mg of DAB per cuvette, dissolve in 50 mL of 10 mM PB, and filter with No. 4 filter paper.
CAUTION: DAB is a health hazard with possible germ cell mutagenicity and carcinogenicity. Wear appropriate PPE and dispose of safely. - Wash the slides 3 x 3 s with 10 mM PB and place them in cuvettes containing 10 mM PB. Add hydrogen peroxide (H2O2) to DAB solution before immediately pouring the solution into fresh cuvettes (16.7 µL of H2O2 per cuvette). Move the slides into the DAB cuvettes and leave for ~3 min (maximum 5 min), while constantly checking for staining intensity under the microscope.
CAUTION: H2O2 can irritate eyes, skin, and throat. Wear appropriate PPE. - Wash the slides (3 s) once in 10 mM PB and 2x in dH2O and allow the slides to dry. Immerse the dry slides 3x in xylene. Apply a drop of DPX mounting medium onto a coverslip and place over the tissue section, being careful to avoid air bubbles.
CAUTION: Xylene and DPX are flammable and may cause eye, skin, and respiratory irritation. Handle in a biosafety cabinet and always wear gloves when handling.
- Nissl staining
- On day 1, rehydrate and spread the tissue in dH2O. Prepare 4% FA by adding 5.4 mL of FA in 50 mL of 0.1 M PB and use immediately. Incubate the slides in 4% FA overnight.
- On day 2, move the slides from 4% FA to 70% ethanol (EtOH) and incubate overnight.
- Prepare Nissl stain by dissolving 4 g of Cresyl Violet in 40 mL of 100% EtOH in a closed 50 mL conical tube. Invert for 15 min, add the solution to 360 mL of warm dH2O, and mix on a stirring plate for 20 min. Filter the solution before use.
- On day 3, follow the staining procedure outlined in Table 2, and coverslip the tissue sections with DPX.
- Terminal deoxynucleotidyl transferase dUTP nick end labeling (TUNEL)
- Rehydrate and spread the tissue in dH2O, then incubate the slides in 4% FA for 5 min. Move the slides into a solution of H2O2 and methanol (CH3OH) (1:10) and incubate for 15 min. Wash the slides for 2 x 3 s in 0.1 M PB and place them in cuvettes containing 0.1 M PB.
- Prepare TUNEL solution on ice according to the manufacturer's instructions. Add the solution to the slides (50 µL per tissue section) and incubate in a humidity chamber at 37 oC for 2 h.
- After 1 h incubation, prepare the ABC solution as described in step 2.4.9 and incubate at room temperature.
- After 2 h, move the slides into the TUNEL STOP solution (300 mM NaCl, 30 mM Sodium Citrate) for 10 min and immerse the slides to wash 3 x 3 s in 10 mM PBS solution. Incubate the slides in ABC solution for 1 h.
- Prepare cobalt sulfate (1.55 g of anhydrous CoSO4 in 100 mL of dH2O) and nickel chloride hexahydrate (2.38 g of NiCl2·6H2O in 100 mL of dH2O). Prepare DAB Co-Ni solution (10 mM PB + 25 mg DAB + 1 mL/100 mL of Co + 1 mL/100 mL of Ni). Filter the solution under vacuum and keep it in the dark. Immediately before pouring the DAB solution into the cuvettes, add 16.7 µL of H2O2 per 50 mL cuvette.
- After 1 h, move the slides into the DAB cuvettes and incubate for ~3 min at room temperature, checking constantly for staining intensity. Stop the reaction by moving the slides to cuvettes containing 10 mM PB. Wash by immersing 2 x 3 s in dH2O and allow the tissue sections to dry before coverslipping them with DPX.
- Hematoxylin and Eosin staining (H&E)
- Rehydrate and spread the tissue in dH2O and allow the sections to air dry.
- Immerse the slides in hematoxylin for 2 min.
CAUTION: Hematoxylin can cause eye and skin irritation. Wear appropriate PPE. - Rinse the slides in running tap water for 5 min, decolorize in acid alcohol for 1 s, and rinse in tap water.
- Counterstain in 0.5% eosin (1.5 g dissolved in 300 mL of 95% EtOH) for 30 s.
CAUTION: Eosin is flammable and can cause eye and skin irritation. Prepare the solutions in a biosafety cabinet and wear appropriate PPE. - Dehydrate the tissue sections in a gradient of EtOH: 50%, 70%, 95% and finally 100% EtOH, each for 3 min. Move the slides into xylene for 2 x 5 min. Coverslip with DPX.
3. Histology and immunohistochemistry assessments for neuropathology and lung injury
NOTE: Assessments can be performed on the following regions: cortex, pyriform cortex, external capsule, striatum, hippocampus, and thalamus (Figure 2). For E18.5 brains, the corpus callosum can also be included as the differentiation of cells is not yet complete and glial cells have not migrated to all brain regions. The assessor should be blinded to the treatment groups.
- TUNEL+ cell death
- Using a conventional microscope, count the cells positive for TUNEL staining bilaterally at 20x magnification in all brain regions (Figure 2).
- Assess three randomly selected optical fields per brain region and calculate the average number of cells per brain region.
- Nissl morphology assessment
- Capture whole-tissue images using a color camera at 1x magnification and save as a TIFF file or other desired format. Import the images to ImageJ for further analysis.
- Outline the brain regions of interest (e.g., cortex and hippocampus) and measure using the freehand tool (Figure 2).
- To obtain the tissue measurement, apply the formula: (mm2 × 400 µm) = volume × 100 (revised32).
- Microglial ramification index
- Using a microscope with a 0.049 mm x 0.049 mm square grid feature, at 40x magnification count the number of IBA-1+ cell bodies within the grid (C) and the average number of branches crossing the gridlines (B). Perform this in three randomly selected fields (see Figure 3) for each brain region shown in Figure 2.
- Use the formula (B2/ C) to calculate the microglial ramification index.
- Optical luminosity for GFAP staining intensity
- Using the referenced software (Table of Materials) and a color camera at 40x magnification, capture three randomly selected fields per brain region (Figure 2). Press Ctrl+H to obtain a histogram displaying the mean and standard deviation (SD). Record the mean and SD values in a spreadsheet. Capture a control image of the surrounding glass only (i.e., no tissue) and record the mean and SD values as before
- Use the following formula to calculate the optical luminosity values (OLV) in a spreadsheet:
OLV = (mean of the glass − standard deviation of the glass) − (mean of [mean per image − standard deviation per image])
NOTE: For example:
Surrounding glass
Mean ± SD = 143.5 ± 8.56
Brain region (e.g., cortex)
1. 136.7 ± 10.6
2. 140.6 ± 10.4
3. 137.4 ± 11.3
OLV = (143.5 - 8.56) - (mean of [136.7 - 10.6], [140.6 - 10.4], [137.4 - 11.3])
OLV = 134.94 - 127.47
OLV = 7.47 - Average each value per region, per animal, and then per experimental group.
- Lung morphology assessments
- Capture H&E sections at 40x magnification (three optical fields per slide, measure airspaces per field), save as TIFF (or equivalent), and import images to ImageJ. Randomly select fields that are representative of the whole lung section.
- Using the freehand tool, outline the airspaces and record the measurement (Figure 4A). Find the average of three airspaces per field, then between the three fields per section and, ultimately, between the three sections per sample.
- Neutrophil influx in lungs
- Capture sample images using a color camera at 40x magnification, three times per lung tissue section, and save the original file as a TIFF file or other desired format. Import the images to ImageJ and manually count individual neutrophils in three fields of the same lung. Calculate the average of neutrophils per lung.
Results
This protocol presents a mouse model of ascending vaginal infection and describes methods for assessing neonatal neuropathology and respiratory outcomes. The procedure to induce ascending vaginal infection should be rapid (within 5 min) and mice should recover within a couple of minutes. Dams developed symptoms of infection after approximately 24 h25. This includes slow movement, piloerection, and a hunched posture. The approximate average delivery time in the infected mice was 40.3 h after E. coli administration (PBS control group mean 52.7 h), occurring on E18.5 compared to term delivery of the PBS control group on E19.531. The percentage of live born pups per litter was reduced (from 100% to 71.4%) with infection, as was their survival over 7 days postnatally (Figure 5)25. When bioluminescent bacteria are used, imaging can track the spread of infection in dams and pups. Bacteria were observed in the uterus, fetal membranes, placenta, and in some fetuses within 18 h of administration (Figure 6), and inflammatory mediators, measured by qPCR and ELISA, were upregulated in these tissues, as well as in the perinatal pup tissues, such as the brain, lungs, and gut25,29,31.
A battery of neuropathology assessments, such as assessing morphology, cell death, microglial activation and astrocyte activation, was performed on the fetuses and neonates using histology and immunohistochemistry25,31,33. Lung tissue can also be evaluated (Figure 4 and Figure 7). Positive staining for TUNEL suggests DNA degradation, a later stage of cell death34. We see a significant increase in TUNEL staining in the cortex, pyriform cortex, external capsule, hippocampus and the thalamus in the brains of pups exposed to E. coli infection during pregnancy (Figure 8A,B)31. IBA-1-labeled microglia, the resident immune cells of the brain, can be categorized by their morphological state, whereby ramification suggests a resting phenotype, while activated and phagocytic cells become amoeboid or rounded in shape35. Therefore, rather than quantifying microglial cells, we present a strategy to assess their phenotype as an indication of their state. We see an increase in IBA1+ ramification in the external cortex and striatum of E. coli pups, compared to the PBS group (Figure 8C,D)31. GFAP-labeled reactive astrocytes, which can be associated with inflammation and neurological injury, were increased in the pyriform cortex and the external capsule in E. coli pups (Figure 8E,F)31,36,37. Nissl staining allows for the assessment of gross morphological changes to the structure of the brain; Cresyl violet is a standard histological stain for neurons and labels both extra nuclear RNA granules and cell nuclei. In the E. coli group, we see reduced thickness of the cortex (Figure 9)31. Similarly, H&E, which respectively stain the nucleus and cytoplasm of cells, allows for assessment of lung morphology (Figure 4)31. We see increased airspaces in E. coli exposed mice, as well as an increase in the number of Ly6G+ neutrophils, an indication of inflammation (Figure 7)31.
For data analyses, time to delivery was analyzed by an unpaired t-test if the data were normally distributed. For the percentage data for live-born pups, an arcsine square root transformation was first required to transform a proportion distribution (bounded by the range 0 to 1) to a normal distribution, which is one of the requirements to be able to perform a t-test. Pup survival was analyzed by a Log-rank (Mantel-Cox) test. For histology and immunohistochemistry, either Mann-Whitney U test or multiple t tests with Welsh's correction were used, depending on the type of data and whether they were distributed normally. For sufficient statistical power, we recommend using a minimum of five dams per treatment group.
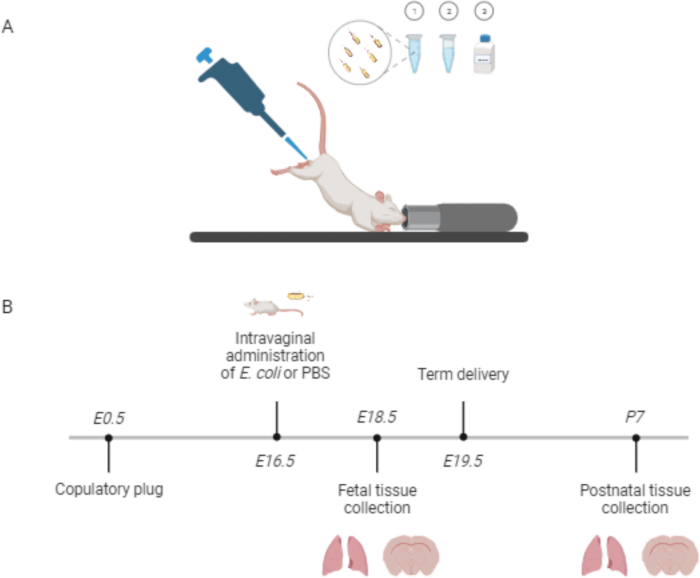
Figure 1: Intravaginal administration of Escherichia coli and the treatment timeline to induce preterm birth and neonatal morbidity in mice. (A) E. coli [1], followed by 20% Pluronic gel F127 [2], is administered into the mouse vagina using a sterile 200 µL pipette tip. Quinine powder is added to the introitus [3]. (B) E. coli is delivered into vagina on embryonic day 16.5. Tissues, such as the lungs and brain, can be collected during the fetal or neonatal period. Abbreviation: EN = embryonic day N; PN = postnatal day N; PBS = phosphate-buffered saline. Please click here to view a larger version of this figure.
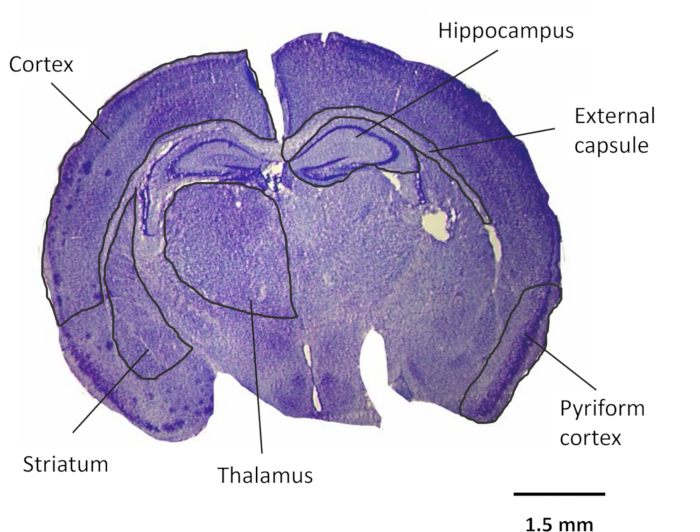
Figure 2: Brain regions assessed for neuropathology. An example of Nissl staining of a neonatal pup brain and the regions that could be assessed for neuropathology. All brain regions can be assessed for TUNEL, IBA-1, and GFAP. We chose to assess the cortex and hippocampus morphology using Nissl. Magnification: 1x. Scale bar = 1.5 mm. Abbreviations: TUNEL = terminal deoxynucleotidyl transferase dUTP nick end labeling; IBA-1 = allograft inflammatory factor 1; GFAP = glial fibrillary acidic protein. Please click here to view a larger version of this figure.
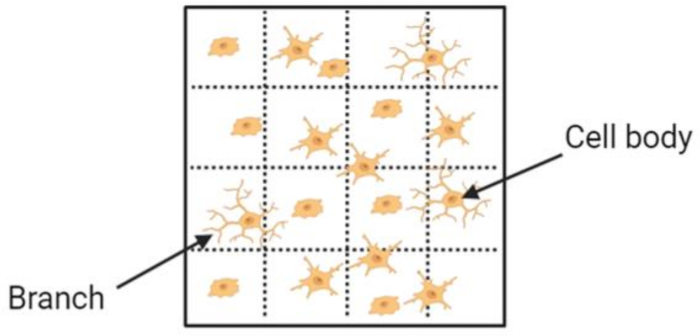
Figure 3: Positive IBA-1 staining and ramification index assessment. To quantify the ramification index of IBA-1+ cells, count the number of cell bodies within the grid and the average number of branches crossing the horizontal and vertical gridlines. Abbreviation: IBA-1 = allograft inflammatory factor 1. Please click here to view a larger version of this figure.
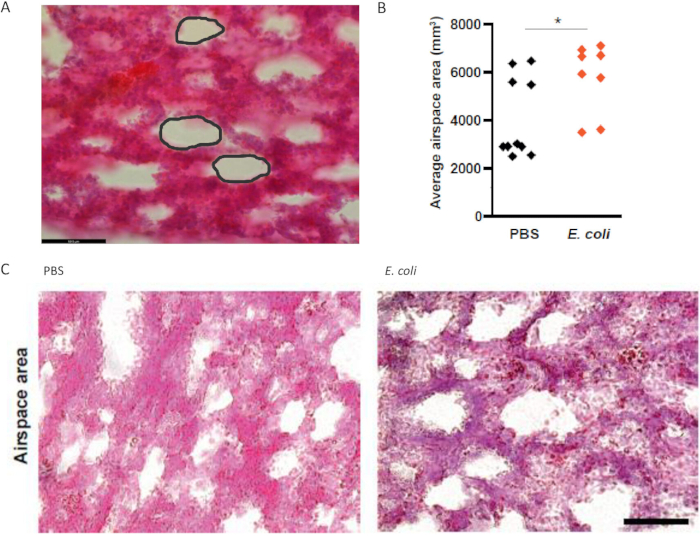
Figure 4: Airspace measurements in pup lungs (H&E staining). (A) Outline the airspaces and measure using the freehand tool in ImageJ. (B) Average airspace area is increased in pups exposed to E. coli compared to PBS. (C) Representative H&E images of pup lungs exposed to PBS and E. coli in utero. Magnification: 40x. Scale bar = 59.5 µm. Abbreviations: H = hematoxylin; E = eosin. n = 2 from 4 litters. *p < 0.05. This figure was adapted from Boyle et al.31. Please click here to view a larger version of this figure.
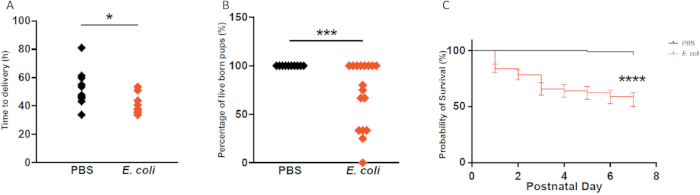
Figure 5: Effects of intravaginal E. coli on time to delivery and pup survival. (A) Time to delivery is reduced in the presence of E. coli. (B) The percentage of pups born alive is significantly reduced and (C) pup survival is reduced in E. coli-exposed pups. Time to delivery: n = 8-10 litters per group; live born pups: n = 10-17 litters per group; pup survival: n = 10-12 litters per group. *p < 0.05, ***p < 0.001. This figure was adapted from Boyle et al.31. Please click here to view a larger version of this figure.
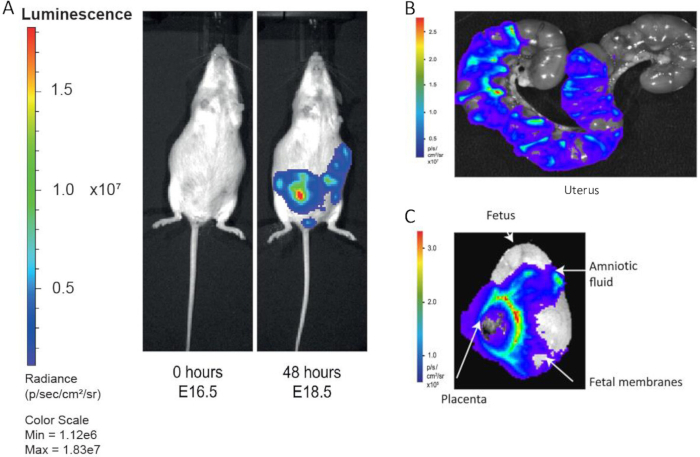
Figure 6: Bioluminescence imaging to monitor E. coli spread. (A) Bioluminescent E. coli ascends from the vagina into the uterine horns within 48 h. (B) Dissected uterine horns show infection with E. coli within 18 h, (C) as do the placenta and fetal membranes. This figure was adapted from Suff et al.25 and Boyle et al.31. Please click here to view a larger version of this figure.
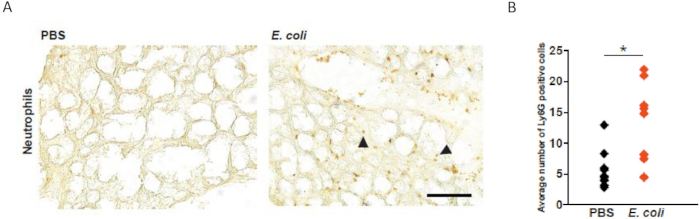
Figure 7: Ly6G staining for neutrophils in fetal lungs. (A) Staining for Ly6G (positive: arrowheads), to assess neutrophil influx, in PBS and E. coli exposed fetuses. (B) The average number of Ly6G+ cells is significantly increased in E. coli fetuses. Magnification: 40x. Scale bar = 59.5 µm. n = 10 from 5 litters per group. *p < 0.05. Abbreviations: Ly6G = Lymphocyte antigen 6 complex locus G6D. This figure was adapted from Boyle et al.31. Please click here to view a larger version of this figure.
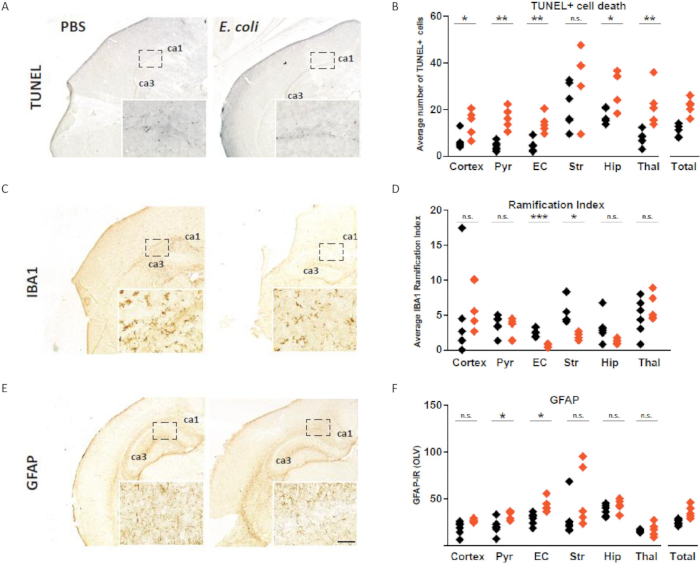
Figure 8: Examples of TUNEL, IBA1, and GFAP staining. (A) TUNEL staining for cell death in the postnatal pup brain exposed to PBS or E. coli. (B) The average number of TUNEL+ cells is increased in the cortex, pyriform cortex, external capsule, hippocampus, and thalamus. (C) IBA1 immunohistochemistry for microglia in PBS and E. coli groups. (D) Ramification index, as a measure of microglia activation, is increased in the external capsule and striatum in E. coli pups. (E) GFAP staining for astrocytes, (F) which is increased in the pyriform cortex and external capsule in E. coli pups. Scale bar = 59.5 µm. Abbreviations: GFAP = glial fibrillary acidic protein; TUNEL = terminal deoxynucleotidyl transferase dUTP nick end labeling; Pyr = Pyriform cortex; EC = external capsule; Str = striatum; Hip = hippocampus; thal = thalamus; total = all regions; CA = cornu ammonis; OLV = optical luminosity values. Immunohistochemistry analyses: n = 5-7 from 5 litters per group. *p < 0.05, **p < 0.01, ***p < 0.001, n.s. - non-significant. This figure was adapted from Boyle et al.31. Please click here to view a larger version of this figure.
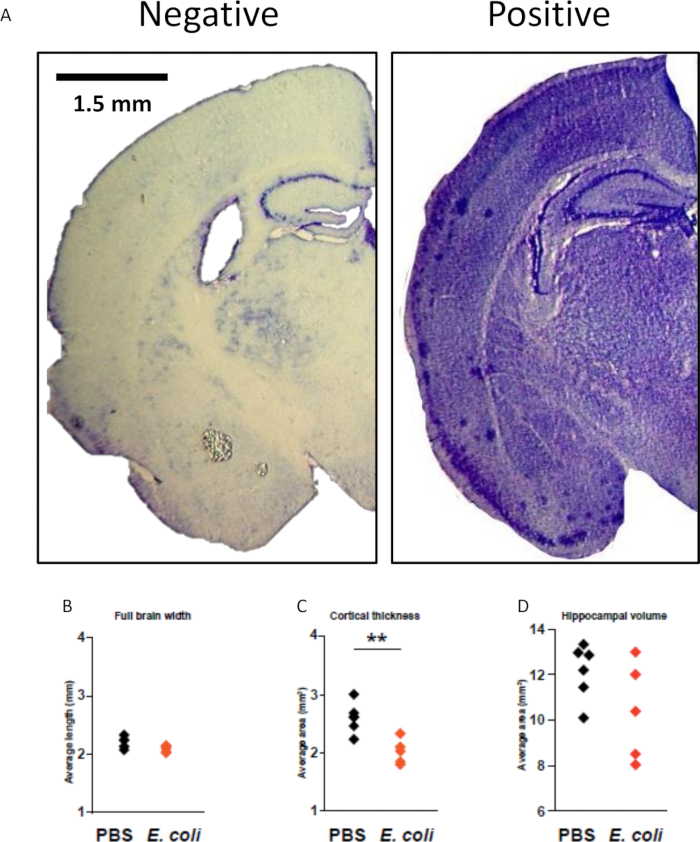
Figure 9: Example of positive and negative Nissl staining and morphology assessments. (A) Nissl staining of the postnatal pup brain to assess tissue structure and morphology. (B) There is no impact on brain width but (C) cortical thickness is reduced in pups exposed to E. coli. (D) There is no difference in hippocampal volume. Magnification: 1x. Scale bar = 1.5 mm. n = 5-7 from 5 litters per group. **p < 0.01. This figure was adapted from Boyle et al.31. Please click here to view a larger version of this figure.
| Primary Antibody | Dilution | Secondary Antibody/Dilution | Dilution |
| Rabbit anti-GFAP | 1:6000 | Goat anti-rabbit | 1:100 |
| Rabbit anti-IBA1 | 1:1000 | Goat anti-rat | 1:100 |
| Mouse anti-Ly6G | 1:1000 | Goat anti-rabbit | 1:100 |
Table 1: Antibodies for immunohistochemistry.
| Step | Reagent | Time (min) |
| 1 | NISSL stain | 10 |
| 2 | Fresh Distilled Water | 2 |
| 3 | Fresh Distilled Water | 2 |
| 4 | 70% EtOH | 2 |
| 5 | 90% EtOH | 2 |
| 6 | 96% EtOH | 2 |
| 7 | 96% EtOH with 3-5 drops glacial acetic acid | 2-5 (CHECK CONSTANTLY) |
| 8 | 100% EtOH | 2 |
| 9 | Isopropanol | 2 |
| 10 | Xylene | 2 |
| 11 | Xylene | 2 |
| 12 | Xylene | 2 |
Table 2: Nissl procedure.
Discussion
Here, we describe the induction of a novel mouse model of preterm birth and neonatal morbidity via bacterial vaginal ascension. We chose E. coli K1 as it is a common cause of neonatal sepsis and meningitis and is vertically transmitted from the mother to the fetus38,39,40. Key to the success of this model is the use of Pluronic thermosensitive gel, which prevents the leakage of the bacterial suspension from the vagina, allowing for infection to establish and ascend to the uterus. As this model uses live bacteria derived from a septicemia isolate, it is crucial to monitor the dams closely27. If the animals refuse to move or eat or do not care for their pups (e.g., neglect nesting and feeding), they must be humanely sacrificed immediately.
Mostly, symptoms associated with infection dissipate within 24 h of delivery. It is also essential to be aware that different serotypes of E. coli and other strains of bacteria will have varying effects on gestational length, the extent of infection/inflammation, and neonatal outcome. We suggest performing preliminary dose experiments with different CFUs when using new bacterial serotypes/strains to determine the minimum concentration needed for the desired phenotype and setting strict humane end points to prevent suffering. Extreme caution should be used when delivering a live pathogen; allow the literature to guide the appropriate use of these organisms when modeling ascending infection.
The mouse strain is also important, as their immune systems differ. For example, the timing and CFUs used in this model do not have the same outcomes when performed in C57BL/6 mice. We chose to use the C57BL/6 Tyrc-2J mice as time course experiments showed significantly more infection in this strain compared to CD-1, BALB/c, and C57BL/6. In addition, there is evidence of black fur quenching bioluminescent signals, which is a useful measurable outcome in this model29. The optimal gestational day for bacterial administration may also differ with pathogen and mouse strain. There is huge heterogeneity in preclinical PTB models; therefore, it is important to consider these variables in order to develop reproducible results17.
Another consideration is the length of time the animals are exposed to anesthesia. As excessive exposure during pregnancy is associated with neurotoxicity in pups, it is essential to keep the time spent under anesthesia to a minimum (e.g., maximum 5 min) and to always include controls exposed to the same environment and treated with a vehicle substance41,42,43. Additional control groups useful for this model include untreated, intravaginal delivery of Pluronic gel only, and anesthesia only.
Immunohistochemistry is widely used as an experimental tool to identify different proteins and cells, and it can be used to characterize structure and connectivity in the brain. Here, we describe how to analyze key cells of the central nervous system that are associated with neuroinflammation and neurological injury. We also present methods to assess cellular apoptosis and histological stains that are useful for measuring brain and lung morphology. Important considerations to ensure the success of these protocols begin with the careful use of the PAP pen; if the PAP pen touches the tissue, the staining will fail but if the parameter is too wide, the sections could dry out overnight. Similarly, the humidity chamber must be kept damp to avoid drying out the sections.
When performing the Nissl staining, the glacial acetic acid step is the most critical; the sections need to be checked constantly. When the main structures of the brain become visible, the sections need to be moved immediately into EtOH to stop the reaction. We chose to assess the cortex and the hippocampus, as reduced cortical thickness and reduced hippocampal volume have been reported in human premature neonates and other animal models but other regions could be assessed for morphology changes44,45,46,47. Close attention must also be paid to the development of DAB staining. This should be timed and kept consistent between experiments.
Data analysis is the most common limitation of immunohistochemistry due to the difficulty in quantifying the results, which are often considered to be subjective. While GFAP analysis is performed using computer-assisted optical luminosity measurements, inconsistent staining can affect these measurements. In addition, the brain and lung morphology assessments involve manual, freehand measurements relying on the observer's judgment. To avoid inconsistency, we repeat these assessments twice and in a short period of time. To further reduce any bias, it is important that the assessor is blinded to the treatment groups. Low immunoreactivity can also be a limiting factor. Lack of signal could suggest that the antigen of interest is absent or it could be due to a protocol failure. To address this, we include a tissue sample that can act as a positive control where possible and repeat the staining procedure when we observe a low or absent signal to ensure this was not the result of an experimental error.
In addition to the protocols described, immunological analyzes of the maternal, fetal, and neonatal tissues can be performed by qPCR and ELISA. We have observed increased inflammatory mRNA and protein levels in animals exposed to infection25,31,48. We hypothesize that the neonatal neuropathology we demonstrate histologically could be the result of fetal brain, lung, and gut inflammation25,31. Other neuropathology assessments we have performed include myelin basic protein (MBP) to investigate myelination and NeuN to stain neuronal nuclei25,31. Further to this, other markers can be assessed for neutrophils and microglia to better understand the phenotype and behavior of these cells following exposure to infection in utero49,50. Additionally, behavioral tests could be performed to determine the long-term impact on offspring.
This model is not without limitations. For example, we see variation in pathology both between and within litters. This could be the result of using a live bacterium, where the spread of infection cannot be controlled. Consequently, the pattern and reach of ascending infection into the uterine horns vary and are often asymmetrical. Another limitation is the pathogenicity of the E. coli, which can sometimes cause the dams to become too unwell to care for their pups. Mice are also not the best model of lung injury, due to alveologenesis taking place postnatally, rather than prenatally, as in humans51. We failed to inflate our lung tissues when the samples were collected, which could have impacted on our results. However, our results are consistent with the changes observed in neonatal BPD animal models52,53.
This model recapitulates the postulated human condition whereby bacterial infection ascends from the vagina into the uterus, stimulating early delivery. Following our initial publication of this model, others have replicated or produced similar models, further emphasizing the reproducibility and relevance of this methodology19,54. Crucially, this model exhibits the common morbidities experienced by premature neonates, where other models have failed. This could be due to the use of a bacterial strain that is specifically associated with neonatal sepsis. LPS, which is most commonly used to induce preterm labor in animal models, is lethal to pups, so neonatal outcomes cannot be measured18. Other models of ascending infection have also struggled with producing surviving pups or in demonstrating neonatal morbidity19,20,21,22,23,24,55,56. Clinically relevant animal models, like the one we describe, are fundamental for understanding the pathophysiology of preterm birth and for developing innovative interventions that will improve neonatal outcomes.
Disclosures
The authors have no relevant disclosures.
Acknowledgements
Escherichia coli K1 A192PP-luxABCDE was kindly gifted by Professor Peter Taylor, University College London. Figure 1 and Figure 3 were created in BioRender.com. This research was supported by the Wellcome Clinical Research Career Development Fellowship 222970/Z/21/Z (N.S.), Action Medical Research and Borne grant GN2647 (N.S., S.N.W., and D.P.); and Wellbeing of Women grant RG2365 (A.K.B., N.S., M.H., S.N.W., and D.P.).
Materials
| Name | Company | Catalog Number | Comments |
|---|---|---|---|
| Anti-GFAP, rabbit | Agilent Technologies | Z033429-2 | |
| Anti-IBA1, rabbit | Wako | 019-19741 | |
| Anti-Ly6G, mouse | BioLegend | 127601 | |
| AVT-Horn 184 3CCD camera | Sony | ||
| Biotin-16-DUTP | Merck | 11093070910 | |
| Borosilicate Glass Rectangular Coverslips | FisherScientific | 12363128 | |
| Cresyl Violet acetate | ThermoFisher Scientific | 405760100 | |
| Cryostat CM1900 | Leica | ||
| Glass cuvette | Merck | BR472700 | |
| Diaminobenzidine (DAB) | Generon | 40480004-3 | |
| Dissecting Forceps, Stainless Steel, 10 cm, Serrated, Curved | World Precision Instruments Ltd | 15915 | |
| Dissecting Forceps, Stainless Steel, 10 cm, Serrated, Straight | World Precision Instruments Ltd | 15914 | |
| Dissecting Scissors, 10 cm long, Straight | World Precision Instruments Ltd | 14393 | |
| DPX | Merck | 100579 | |
| Eosin | Sigma-Aldrich | HT110116 | |
| Formaldehyde solution 4% buffered | Merck | 100496 | |
| Goat Anti-Rabbit IgG Antibody (H+L), Biotinylated | Vector Laboratories | BP-9100-50 | |
| Goat Anti-Rat IgG Antibody (H+L), Biotinylated | Vector Laboratories | BA-9400-1.5 | |
| GraphPad Prism v.8 | GraphPad Software | ||
| H2O2 | Sigma-Aldrich | 7722-84-1 | |
| Hematoxylin | Sigma-Aldrich | MHS16 | |
| ImageJ | National Institutes of Health | ||
| Isoflurane (IsoFlo) | Zoetis | 50019100 | |
| IVIS Lumina II In Vivo Imaging System/Living Image Software | Perkin Elmer/Revvity | ||
| Microslides | VWR | ISO8037/I | |
| Optimas 6.51 | Media Cybernetics Inc. | ||
| Paraformaldehyde | Sigma-Aldrich | 158127 | |
| Phosphate-buffered saline (PBS) | Thermo Fisher Scientific (Life Technologies) | 14190094 | |
| Pluronic F-127 | Sigma-Aldrich | P2443 | |
| Quinine | Scientific Laboratory Supplies | Q0132 | |
| ReadyProbes Hydrophobic Barrier Pap Pen | Thermo Fisher Scientific | R3777 | |
| Sodium hydroxide | Honeywell | S8045 | |
| Sodium Phosphate Monobasic Anhydrous | FisherScientific | BP329-1 | |
| Sucrose | Merck | S9378 | |
| Terminal transferase | Merck | 3333574001 | |
| VECTASTAIN ABC-HRP Kit, Peroxidase | Vector Laboratories | PK-4000 | |
| Xylenes (histological grade) | Sigma-Aldrich | 534056 |
References
- WHO. WHO: recommended definitions, terminology and format for statistical tables related to the perinatal period and use of a new certificate for cause of perinatal deaths. Modifications recommended by FIGO as amended October 14, 1976. Acta Obstet Gynecol Scand. 56 (3), 247-253 (1977).
- Liu, L., et al. Global, regional, and national causes of under-5 mortality in 2000–15: an updated systematic analysis with implications for the sustainable development goals. Lancet. 388 (10063), 3027-3035 (2016).
- Chawanpaiboon, S., et al. regional, and national estimates of levels of preterm birth in 2014: a systematic review and modelling analysis. Lancet Glob Health. 7 (1), e37-e46 (2019).
- Unicef. Levels and trends in child mortality report 2017. , Unicef. (2017).
- Blencowe, H., et al. National, regional, and worldwide estimates of preterm birth rates in the year 2010 with time trends since 1990 for selected countries: a systematic analysis and implications. Lancet. 379 (9832), 2162-2172 (2012).
- Jung, E., et al. The fetal inflammatory response syndrome: the origins of a concept, pathophysiology, diagnosis, and obstetrical implications. Semin Fetal Neonatal Med. 25 (4), 101146(2020).
- Humberg, A., et al. Preterm birth and sustained inflammation: consequences for the neonate. Semin Immunopathol. 42 (4), 451-468 (2020).
- Boyle, A. K., Rinaldi, S. F., Norman, J. E., Stock, S. J. Preterm birth: inflammation, fetal injury and treatment strategies. J Reprod Immunol. 119, 62-66 (2017).
- Romero, R., Dey, S. K., Fisher, S. J. Preterm labor: one syndrome, many causes. Science. 345 (6198), 760-765 (2014).
- Goldenberg, R. L., Culhane, J. F., Iams, J. D., Romero, R. Epidemiology and causes of preterm birth. Lancet. 371 (9606), 75-84 (2008).
- Jones, H. E., et al. Differing prevalence and diversity of bacterial species in fetal membranes from very preterm and term labor. PLoS One. 4 (12), e8205(2009).
- Cobo, T., et al. Characterization of vaginal microbiota in women with preterm labor with intra-amniotic inflammation. Sci Rep. 9 (1), 18963(2019).
- Romero, R., et al. Microbial invasion of the amniotic cavity in patients with suspected cervical incompetence: prevalence and clinical significance. Am J Obstet Gynecol. 167 (4 Pt 1), 1086-1091 (1992).
- Mendz, G. L., Kaakoush, N. O., Quinlivan, J. A. Bacterial aetiological agents of intra-amniotic infections and preterm birth in pregnant women. Front Cell Infect Microbiol. 3, 58(2013).
- DiGiulio, D. B., et al. Prevalence and diversity of microbes in the amniotic fluid, the fetal inflammatory response, and pregnancy outcome in women with preterm pre-labor rupture of membranes. Am J Reprod Immunol. 64 (1), 38-57 (2010).
- DiGiulio, D. B. Diversity of microbes in amniotic fluid. Semin Fetal Neonatal Med. 17 (1), 2-11 (2012).
- Miller, F. A., Sacco, A., David, A. L., Boyle, A. K. Interventions for infection and inflammation-induced preterm birth: a preclinical systematic review. Reprod Sci. , (2022).
- Migale, R., et al. Specific lipopolysaccharide serotypes induce differential maternal and neonatal inflammatory responses in a murine model of preterm labor. Am J Pathol. 185 (9), 2390-2401 (2015).
- Spencer, N. R., et al. Development of a mouse model of ascending infection and preterm birth. PLoS One. 16 (12), e0260370(2021).
- Pavlidis, I., et al. Cervical epithelial damage promotes Ureaplasma parvum ascending infection, intrauterine inflammation and preterm birth induction in mice. Nat Commun. 11 (1), 199(2020).
- Vornhagen, J., et al. Group B streptococcus exploits vaginal epithelial exfoliation for ascending infection. J Clin Invest. 128 (5), 1985-1999 (2018).
- Bernardini, R., et al. Neonatal protection and preterm birth reduction following maternal group B streptococcus vaccination in a mouse model. J Matern Fetal Neonatal Med. 30 (23), 2844-2850 (2017).
- Tantengco, O. A. G., et al. Modeling ascending Ureaplasma parvum infection through the female reproductive tract using vagina-cervix-decidua-organ-on-a-chip and feto-maternal interface-organ-on-a-chip. Faseb J. 36 (10), e22551(2022).
- Randis, T. M., et al. Group B streptococcus β-hemolysin/cytolysin breaches maternal-fetal barriers to cause preterm birth and intrauterine fetal demise in vivo. J Infect Dis. 210 (2), 265-273 (2014).
- Suff, N., et al. Ascending vaginal infection using bioluminescent bacteria evokes intrauterine inflammation, preterm birth, and neonatal brain injury in pregnant mice. Am J Pathol. 188 (10), 2164-2176 (2018).
- Mushtaq, N., Redpath, M. B., Luzio, J. P., Taylor, P. W. Treatment of experimental Escherichia coli infection with recombinant bacteriophage-derived capsule depolymerase. J Antimicrob Chemother. 56 (1), 160-165 (2005).
- Achtman, M., et al. Six widespread bacterial clones among Escherichia coli K1 isolates. Infect Immun. 39 (1), 315-335 (1983).
- Winson, M. K., et al. Engineering the luxCDABE genes from Photorhabdus luminescens to provide a bioluminescent reporter for constitutive and promoter probe plasmids and mini-Tn5 constructs. FEMS Microbiol Lett. 163 (2), 193-202 (1998).
- Suff, N. The use of cervical gene therapy for the prevention of infection-related preterm birth [Ph. D. Thesis]. , University College London. (2017).
- Boyle, A. K., Rinaldi, S. F., Rossi, A. G., Saunders, P. T. K., Norman, J. E. Repurposing simvastatin as a therapy for preterm labor: evidence from preclinical models. Faseb J. 33 (2), 2743-2758 (2019).
- Boyle, A. K., et al. Ascending vaginal infection in mice induces preterm birth and neonatal morbidity. Am J Pathol. 195 (5), 891-906 (2025).
- Kendall, G. S., Robertson, N. J., Iwata, O., Peebles, D., Raivich, G. N-methyl-isobutyl-amiloride ameliorates brain injury when commenced before hypoxia ischemia in neonatal mice. Pediatr Res. 59 (2), 227-231 (2006).
- Rocha-Ferreira, E., et al. Curcumin: novel treatment in neonatal hypoxic-ischemic brain injury. Front Physiol. 10, 1351(2019).
- Kyrylkova, K., Kyryachenko, S., Leid, M., Kioussi, C. Detection of apoptosis by TUNEL assay. Methods Mol Biol. 887, 41-47 (2012).
- Lier, J., Streit, W. J., Bechmann, I. Beyond activation: characterizing microglial functional phenotypes. Cells. 10 (9), (2021).
- Schmidt-Kastner, R., Wietasch, K., Weigel, H., Eysel, U. T. Immunohistochemical staining for glial fibrillary acidic protein (GFAP) after deafferentation or ischemic infarction in rat visual system: features of reactive and damaged astrocytes. Int J Dev Neurosci. 11 (2), 157-174 (1993).
- Pekny, M., Pekna, M. Astrocyte reactivity and reactive astrogliosis: costs and benefits. Physiol Rev. 94 (4), 1077-1098 (2014).
- Witcomb, L. A., Collins, J. W., McCarthy, A. J., Frankel, G., Taylor, P. W. Bioluminescent imaging reveals novel patterns of colonization and invasion in systemic Escherichia coli K1 experimental infection in the neonatal rat. Infect Immun. 83 (12), 4528-4540 (2015).
- Obata-Yasuoka, M., Ba-Thein, W., Tsukamoto, T., Yoshikawa, H., Hayashi, H. Vaginal Escherichia coli share common virulence factor profiles, serotypes and phylogeny with other extraintestinal E. coli. Microbiology (Reading). 148 (Pt 9), 2745-2752 (2002).
- Bonacorsi, S., Bingen, E. Molecular epidemiology of Escherichia coli causing neonatal meningitis. Int J Med Microbiol. 295 (6-7), 373-381 (2005).
- Hartling, L., Liang, Y., Lacaze-Masmonteil, T. Chorioamnionitis as a risk factor for bronchopulmonary dysplasia: a systematic review and meta-analysis. Arch Dis Child Fetal Neonatal Ed. 97 (1), F8-F17 (2012).
- Liang, G., et al. Isoflurane causes greater neurodegeneration than an equivalent exposure of sevoflurane in the developing brain of neonatal mice. Anesthesiology. 112 (6), 1325-1334 (2010).
- Yang, B., et al. Comparison of neurodegeneration and cognitive impairment in neonatal mice exposed to propofol or isoflurane. PLoS One. 9 (6), e99171(2014).
- Schmitz-Koep, B., et al. Decreased cortical thickness mediates the relationship between premature birth and cognitive performance in adulthood. Hum Brain Mapp. 41 (17), 4952-4963 (2020).
- Nagy, Z., Lagercrantz, H., Hutton, C. Effects of preterm birth on cortical thickness measured in adolescence. Cereb Cortex. 21 (2), 300-306 (2011).
- Dimitrova, R., et al. Preterm birth alters the development of cortical microstructure and morphology at term-equivalent age. Neuroimage. 243, 118488(2021).
- Dada, T., et al. Mouse model of intrauterine inflammation: sex-specific differences in long-term neurologic and immune sequelae. Brain Behav Immun. 38, 142-150 (2014).
- Suff, N., et al. Cervical gene delivery of the antimicrobial peptide, human beta-defensin (HBD)-3, in a mouse model of ascending infection-related preterm birth. Front Immunol. 11, 106(2020).
- McKenna, E., et al. Neutrophils: need for standardized nomenclature. Front Immunol. 12, 602963(2021).
- Jurga, A. M., Paleczna, M., Kuter, K. Z. Overview of general and discriminating markers of differential microglia phenotypes. Front Cell Neurosci. 14, 198(2020).
- Jackson, C. M., et al. Pulmonary consequences of prenatal inflammatory exposures: clinical perspective and review of basic immunological mechanisms. Front Immunol. 11, 1285(2020).
- Durrani-Kolarik, S., et al. miR-29b supplementation decreases expression of matrix proteins and improves alveolarization in mice exposed to maternal inflammation and neonatal hyperoxia. Am J Physiol Lung Cell Mol Physiol. 313 (2), L339-L349 (2017).
- Nguyen, L., et al. Sex-differences in LPS-induced neonatal lung injury. Sci Rep. 9 (1), 8514(2019).
- Zhang, Y., Edwards, S. A., House, M. Cerclage prevents ascending intrauterine infection in pregnant mice. Am J Obstet Gynecol. , (2023).
- Kammala, A. K., et al. Extracellular vesicles-mediated recombinant IL-10 protects against ascending infection-associated preterm birth by reducing fetal inflammatory response. Front Immunol. 14, 1196453(2023).
- Tantengco, O. A. G., et al. Inflammatory response elicited by Ureaplasma parvum colonization in human cervical epithelial, stromal, and immune cells. Reproduction. 163 (1), 1-10 (2021).
Reprints and Permissions
