Electrical Impedance Tomography is a non-invasive, radiation-free, real-time pulmonary ventilation monitoring tool. By measuring impedance changes in the thorax, it can visualize the distribution of air on a breath-by-breath basis. Initially intended for ventilation monitoring, electrical impedance tomography can also measure perfusion via intravenous injection of a saline solution.
Method Article
Monitoring Lung Function with Electrical Impedance Tomography in the Intensive Care Unit
* These authors contributed equally
In This Article
Summary
Abstract
Electrical Impedance Tomography (EIT) is a groundbreaking, non-invasive, and radiation-free imaging technique for continuous, real-time ventilation monitoring. It also has an application in pulmonary perfusion monitoring. EIT quantifies ventilation and perfusion patterns across the lung from the measurement and processing of impedance changes in the thorax. It is a powerful tool for clinicians to visualize breath-by-breath changes in pulmonary function.
An innovative application of EIT is its ability to assess pulmonary perfusion using the kinetic analysis of a hypertonic solution injection during a breath-hold. The solution generates an impedance change in the thorax as it circulates through the pulmonary vasculature. This indirect method allows for the estimation of perfusion patterns, contributing significantly to our understanding of pulmonary blood flow dynamics at the bedside.
EIT is not just a tool for monitoring but also can be critical for the diagnosis of respiratory pathologies such as pneumothorax and bronchial intubation. It can help identify the etiology of ventilation/perfusion (V/Q) mismatch in patients receiving invasive mechanical ventilation, which is not possible with other diagnostic tools. Moreover, EIT can assist in the individual optimization of ventilator settings, such as Positive End-Expiratory Pressure (PEEP) titration and tidal volume improving oxygenation and lung health in critical care.
In summary, EIT represents a paradigm shift in bedside pulmonary monitoring and diagnostics. Its non-invasive nature and immediacy of data make EIT an indispensable tool in modern respiratory medicine. With its growing applications, EIT will be pivotal in advancing our understanding of and approach to respiratory care, particularly in intensive care settings.
Introduction
Electrical Impedance Tomography (EIT) is a lung monitoring technique that translates variations in impedance over time into topographic images. This is achieved by injecting a low electrical alternate current (5-10 mA) from electrodes positioned circumferentially across the torso (Figure 1A). Impedance reflects a tissue's opposition to the flow of this electric current. During inspiration, impedance increases, whereas it decreases during expiration. A similar change in impedance occurs in the presence of intravenous fluids. For instance, when fluids that have higher electrical conductivity compared to the blood are injected via a central catheter, there is a corresponding decrease in electrical impedance1,2,3,4.
For practicality, EIT's electrodes (either 16 or 32 in number) are placed on a belt, which is then positioned around the patient's thorax, specifically between the 4th and 5th intercostal spaces. This placement provides an optimal view of the lungs and reduces diaphragm interference. In the measurement process, two different electrodes inject a preset current sequentially while the remaining electrodes act as receivers for the corresponding voltage readings. This process is rapidly repeated for every pair of electrodes, rotating around the thorax at a frequency of 20-50 Hz. This rapid rotation is why EIT has a high temporal resolution. A thoracic EIT device calculates the distribution of electrical impedance in the chest's cross-section from each measurement cycle and converts these values into a two-dimensional image. This image is then displayed in real time on a dedicated monitor.
EIT has several clinical applications. Based on impedance technology, it is possible to monitor the distribution of air inside the thorax and the distribution of perfusion, especially when a contrast agent is administrated to create variations in lung impedance. Determining the PEEP settings for mechanically ventilated patients is both challenging and essential to minimize lung injury. Furthermore, its capability to track ventilation and perfusion changes over time offers invaluable data for longitudinal patient monitoring. This aspect is crucial in dynamic clinical environments where patient conditions can rapidly evolve5.
EIT facilitates visualization not only of global mechanics obtained through the flow sensor or the data from the ventilator if the EIT device is connected with the ventilator but also provides crucial information on overdistension and regional collapse6,7,8,9. The images generated provide functional information about the lungs but are not intended for anatomical diagnosis and do not emit radiation. In the United States of America, the EIT device ENLIGHT 2100 is currently the only one approved by the U.S. Food and Drug Administration (FDA). Other companies are now in the process of obtaining FDA approval for EIT use in the adult, children, and newborn populations. For this paper, we used hardware (e.g., belts and screen), ventilation, and perfusion maps from the ENLIGHT 2100 device.
The EIT set setup includes three essential pieces of equipment, aside from the monitor itself, which are a belt of electrodes, the flow sensor, and the reference cable. The belt of electrodes is used to obtain a tomographic bi-dimensional image. The EIT lung image is constructed into a two-dimensional representation with varying resolutions, such as 32 x 32, 24 x 24, or 16 x 16 pixels, depending on the chest perimeter size and the manufacturer's specifications. Images are generated from voltage measurements using reconstruction algorithms. The flow sensor is designed for single-patient use and comes in two sizes: one for adults and pediatric patients, and another for neonates. The adult-pediatric flow sensor cannot measure tidal volume less than 40 mL, while the neonatal sensor can record tidal volume from 0 to 100 mL. Without the flow sensor, the EIT only displays impedance data. Once the flow sensor is connected to a patient, it becomes possible to synchronize the data from the impedance waveforms with the pressure, flow, and volume parameters. The reference cable is reusable and serves as the reference point for the injecting value of the electrical current.

Figure 1: Placement of Electrical impedance tomography electrode belt. (A) Electrical impedance tomography electrode belt placed around the chest at 4th and 5th intercostal space. (B) Measuring the chest. The chest is measured by wrapping a measuring tape around the entire chest. However, most patients are bedbound, and the measurement of the entire chest is unfeasible. An alternative approach is illustrated in the images. The chest perimeter is assessed from the spinous process to the sternum. The measurement is then doubled to account for the contralateral portion of the chest. Please click here to view a larger version of this figure.
The primary focus of this video paper is to provide the reader with the knowledge and skills required to become proficient in recording and interpreting EIT images. In pursuit of this goal, we will provide an overview of EIT principles, showcase its real-time visualization capabilities for air distribution in the lungs, and explore its extended applications in perfusion assessment. By accomplishing these objectives, we aim to enable the audience to confidently utilize EIT technology for pulmonary assessment.
Protocol
The images provided in this paper were anonymized and part of ongoing protocols registered at ClinicalTrials.gov under the number NCT04497454 and approved by the local ethical committee (Univeristy of São Paulo Incor/HC-FMUSP 4001231, Brazil).
1. How to start using the EIT device
- EIT belt and placement
- Measure the chest wall for accurate belt size selection.
- Measure the thoracic perimeter between the 4th and 5th intercostal spaces using a measurement tape (Figure 1B). In patients with large breasts, move the belt to a higher intercostal space.
- Cover the electrode belt with a disposable material with conductive gel.
NOTE: This ensures adherence to the patient's skin, even in those patients with lots of hair, facilitating the capture of the impedance signal. - Place the belts on the 4th and 5th intercostal spaces of the patient chest wall (same as the measured perimeter) and ensure there is no overlap of the electrodes when placing the belts.
- Maintain continuity without gaps in the back since the image reconstruction algorithm permits an anterior gap proportional to the belt size.
- During the belt placement, turn the patient to access the back. Secure the airway, all indwelling venous or arterial lines, and drains, and follow specific guidelines provided by healthcare professionals.
- Connect the flow sensor to the ventilatory circuit close to the Y-piece and position it with the sensor upwards to prevent fluid accumulation and signal interference (Figure 2A).
- Connect the reference electrode to an electrocardiographic (ECG) electrode.
NOTE: Monitoring a patient without the reference cable is not possible (Figure 2B).- For adult and pediatric patients, position the electrode on the abdomen or shoulder.
- For neonatal patients, position the electrode on the leg.
- Turn on the EIT and enter patient demographic data (Figure 3).
- Start monitoring and avoid any patient movements; a reference image is generated and the ventilation screen displays after starting to monitor (Figure 4). Two images are generated: the dynamic image and the ventilation map.
NOTE: During the recording, it is crucial to avoid any movements of the patient interfering with the belts. - Step by step for the PEEP titration tool on the EIT device
- Select the PEEP Titration Tool from the main screen icon.
- Access Tool Options by clicking on the Tool Options icon.
- Set Time Intervals to adjust the time intervals for PEEP changes during titration to stabilize ventilation in each condition.
NOTE: Time interval depends on the patient's condition (e.g., hemodynamics instability) and the device's instruction. - Adjust the Threshold value for automatic PEEP change detection.
- Start Titration by pressing Start on the PEEP Titration screen to initiate the countdown based on the adjusted time for PEEP changes.
- When prompted, adjust the PEEP value on the ventilator according to the protocol. The device will automatically detect this change and start a new countdown.
- Monitor the PEEP changes-the screen updates with each PEEP change. If automatic detection fails, manually stop and comment on the procedure. Optionally, provide comments or name the titration. The PEEP titration graph will then be displayed.
- Step-by-Step for Perfusion tool on the EIT device
- Patient preparation
- Ensure sufficient sedation and if necessary, neuromuscular blockade, as any respiratory effort can disrupt the procedure.
NOTE: The patient might exhibit undetectable respiratory efforts despite mechanical ventilation monitoring.
- Ensure sufficient sedation and if necessary, neuromuscular blockade, as any respiratory effort can disrupt the procedure.
- Initiate the Procedure. Start the procedure by clicking on the Start icon within the EIT software.
- Ventilatory cycle recognition
- Allow the software to recognize a few ventilatory cycles to establish baseline data.
- Apnea and Injection
- Switch to continuous positive airway pressure (CPAP) or pressure support ventilation (PSV) mode with a pressure support of 0 cmH2O. Maintain this for more than 20 s. During this period, quickly and consistently inject 10 mL of a 7.5% hypertonic saline solution or 8.4% bicarbonate through a central venous access catheter at the internal jugular or subclavian vein.
- Restore ventilation. Once the injection is complete, return to regular ventilation settings.
- Image reconstruction
- Let the EIT algorithm reconstruct the perfusion image based on the first-pass kinetics of the contrast flowing through the heart and lungs.
- Patient preparation

Figure 2: Placement of the flow sensor. (A) Placement of the flow sensor between the circuit and the ETT. (B) The belt around the thorax is connected to the EIT device. The flow sensor is connected between the ETT and the circuit. Reference cable connected to the electrode on the belly. Abbreviation: ETT = endotracheal tube. Please click here to view a larger version of this figure.

Figure 3: The initialization screen of the electrical impedance tomography monitoring device. Fields marked with red asterisks indicate mandatory information that must be completed for proper setup and operation. Please click here to view a larger version of this figure.

Figure 4: The EIT screen displaying a dynamic image, ventilation map, and plethysmogram. On the left side of the screen, there is ventilation distribution divided by region ((A/P, R/L). On the right side of the screen, there are ventilation parameters including driving pressure, PEEP, auto PEEP, PIP, PPlat Alv, VT, CRS, RR, and RAW. Abbreviations: EIT = electrical impedance tomography; A/P=anterior/posterior, R/L=right/left; PEEP = positive-end expiratory pressure; PIP = peak inspiratory pressure; PPlat Alv = alveolar plateau pressure; VT = tidal volume; CRS = respiratory system compliance; RR = respiratory rate; RAW = airway resistance. Please click here to view a larger version of this figure.
Results
Ventilation monitoring
The dynamic image (Figure 4) displays real-time variations of air distribution during ventilation using colors ranging from dark blue (least ventilated) to white (most ventilated) to represent regional changes. Gray areas indicate no variation in ventilation. The dynamic images allow quick identification of differences in intrapulmonary time constants and the presence of paradoxical patterns. It is important to note that areas with limited air variation during a respiratory cycle may result from overdistension or collapsed areas.
The "ventilation map" (Figure 4) illustrates how air volume distributes across a defined cross-section during breath cycles. Bright blue indicates lung regions that receive most of the tidal volume, which is proportional to the change of impedance signal between inspiration and expiration. Conversely, dark blue represents areas with low volume variation. The ventilation map allows the assessment of regional ventilation distribution within the lungs. The lungs are divided into anterior/posterior and right/left regions, allowing for detailed assessment and the display of plethysmographs in specific regions on the screen4.
The plethysmogram thorax impedance variation curve (Figure 4) represents the wave amplitude corresponding to tidal volume, with the baseline equivalent to pulmonary aeration or Functional Residual Capacity (FRC) or End-Expiratory Lung Volume (EELV). Aeration information can estimate relative changes in total intrathoracic air volume.
Airway parameters on the right side of the screen (Figure 4) are captured by the flow sensor and displayed as waveform graphs and numbers. Parameters such as driving pressure, auto PEEP, alveolar plateau pressure, compliance, and resistance (in the numerical column on the right) are calculated during controlled cycles. The parameters PEEP, peak pressure, tidal volume, and respiratory rate will be displayed in all cycles. Using the proximal flow sensor allows the integration of ventilation and impedance data on the same screen, regardless of the mechanical ventilator brand or model.
PEEP titration tool (Figure 5)
The patient should be synchronized with the ventilator avoiding spontaneous breathing effort and movement that may affect PEEP titration. This can be reached with adequate sedation, and if necessary with paralytic agents. The flow sensor and ventilator tubing should be free from any obstructions, such as liquid and secretions, to maintain accurate monitoring.
EIT detects changes in regional ventilation and, when integrated with a flow meter is capable of estimating regional respiratory mechanics, including airway pressure, tidal volume, and flow. It presents results as percentages of collapsed and hyperdistended areas at different PEEP levels by calculating regional compliance changes. Some authors proposed to titrate PEEP to the crossing point between the percentage of overdistension (white curve in Figure 5 and white area in Figure 6) and the percentage of collapse (blue curve in Figure 5 and blue area in Figure 6). At this PEEP level, there is a minimum occurrence of both hyperdistended and collapsed areas (orange curve in Figure 5) and lung function. Ongoing studies are investigating whether the PEEP set at the crossing point between hyperdistension and collapse is clinically advantageous.

Figure 5: The PEEP titration tool on the EIT screen. The orange curve represents compliance, the white curve represents hyperdistension, and the blue curve represents collapse. Abbreviations: EIT = electrical impedance tomography; PEEP = positive-end expiratory pressure. Please click here to view a larger version of this figure.
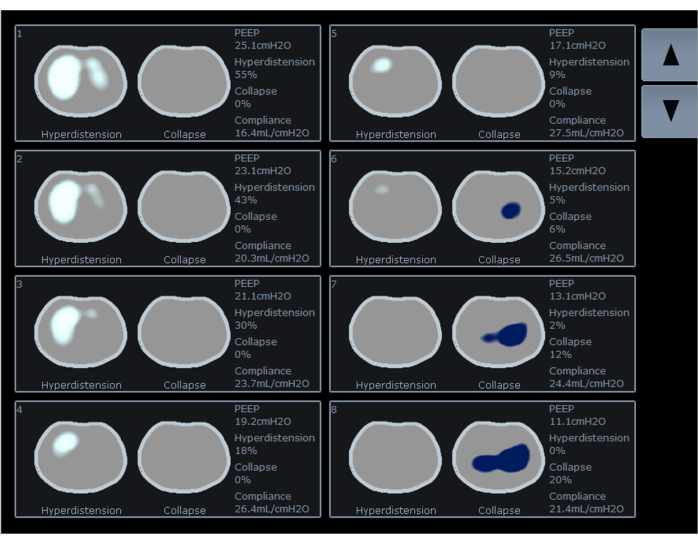
Figure 6: Display of the percentages of hyperdistension (white) and collapse (blue), and compliance for different PEEP values on the EIT screen. Abbreviations: EIT = electrical impedance tomography; PEEP = positive-end expiratory pressure. Please click here to view a larger version of this figure.
Assessment of pulmonary perfusion with EIT: a guide for healthcare providers
Electrical Impedance Tomography (EIT) has recently been recognized to be a valuable monitoring tool for lung ventilation by measuring changes in electrical conductivity. While EIT primarily focuses on assessing air distribution within the lungs, it can also provide valuable insights into pulmonary perfusion through innovative techniques.
Changes in impendence from the movement of blood in the thorax are of much smaller amplitude than those related to ventilation. Thus, EIT has not traditionally been used to measure perfusion. However, certain methods involving the intravenous injection of a hypertonic saline solution in combination with a breath-hold maneuver can isolate and amplify impedance changes related to blood flow. As this solution travels through the blood vessels, it alters the electrical properties of the blood, which EIT can detect. EIT can indirectly infer perfusion patterns by observing the impedance changes caused by this solution as it circulates through the pulmonary vasculature. This approach enables us to gain a deeper understanding of both ventilation and perfusion within the lungs simultaneously10. This tool is for research purposes only in the US and/or according to local hospitals' regulations and/or other nations' approval by legal-bodies regulators.
Visualizing pulmonary perfusion
The intravenous injection of a solution with high electrical conductivity, such as hypertonic saline or sodium bicarbonate, aids in visualizing blood flow within the pulmonary vasculature11,12,13. Areas with higher perfusion exhibit different impedance patterns compared to less perfused regions. This innovative application of EIT allows for a relative assessment of perfusion alongside ventilation imaging, providing a comprehensive view of lung function, which helps to differentiate hypoxemia caused by perfusion defects, usually treated with therapies that modulate lung perfusion, from hypoxemia caused by ventilatory disturbances, often addressed with ventilation strategies or position changes. This application also allows monitoring of the changes in regional pulmonary perfusion in response to the established treatment (such as inhaled nitric oxide, anticoagulants, and thrombolytic drugs).
Perfusion tool
The perfusion tool within EIT is specifically designed to visualize pulmonary blood flow during controlled mechanical ventilation. It involves the injection of a hypertonic saline solution into a vein during a brief apnea period. The resulting image displays the distribution of pulmonary perfusion, with colors ranging from yellow (indicating higher perfusion) to dark red (indicating lower perfusion) in the chest's cross-section (see Figure 7).

Figure 7: Variations in the percentage of distribution of perfusion to different regions of the chest. Shown are variations in perfusion to anterior, posterior, right, and left, with colors ranging from yellow (higher perfusion) to dark red (lower perfusion) in the chest's cross-section. It is also possible to run the processed video online showing the contrast flowing through the heart in blue color after to the lungs in red colors. Abbreviations: A = anterior; P = posterior; R = right; L = left. Please click here to view a larger version of this figure.
Online and offline analysis
EIT continuously measures plethysmograms and the distribution of air throughout the lungs. The impedance variation reflects tidal volume changes, enabling regional evaluation of the lungs. The plethysmogram graphically represents lung volume changes during inspiration and expiration (Figure 8). The variation of the air can be measured in different parts of the lungs. This is one of the most advantageous measurements from EIT, as it assesses regional ventilation.
The EIT device creates a 32 x 32 matrix to map the entire lung area. This matrix is conveyed into a grid covering the entire lungs. Each tiny square within the grid, known as a pixel, is assigned a value of resistivity or impedance. Changes in the impedance values correspond to changes to the lung volume in the specific part of the lung.
Using dedicated software, EIT takes these changes in impedance values and generates an image. This image helps us to understand the magnitude of the variation in volume, represented on a color scale. Bright blue signifies high volume, and dark blue indicates low volume. No variation in impedance or no change in tidal volume is represented in grey color (Figure 8). Essentially, it functions as a map, pinpointing precisely where these changes occurred within the lung.

Figure 8: The Ventilation Dynamic Image illustrating each pixel in a matrix 32 x 32, totaling 1,024 pixels. The amplitude of the ventilation is represented by the amplitude of the wave and intensity of the color, with gray indicating no volume and transitioning from bright blue to dark blue representing high to low volume, respectively. Please click here to view a larger version of this figure.
There are numerous clinical situations where EIT can be beneficial. For example, in early identification of complications and conditions that may lead to lung injury, such as atelectasis, overdistension, and pneumothorax. Atelectasis is one of the most common pathologies in hospitalized patients. It involves the partial or complete collapse of the lung tissue, reducing lung volumes and impairing gas exchange. Atelectasis could be detected by EIT as shown in Figure 9A. Figure 9A and Figure 9B are the Ventilation Map Images from the same patient, less than 13 min apart. In Figure 9A, only 23% of the impedance changes occur in the posterior region, which can also be seen by a reduction in bright blue and dark blue areas observed in this region. Following an increase in PEEP from 4 to 10 cmH2O, Figure 9B reveals increased ventilation in the posterior lung which increased from 23% to 43%. Compared to Figure 9A, the patient exhibits an increase in compliance from 18.8 to 27.6 mL/cmH2O. Notably, this gain occurs in the bilateral posterior region, which is evident from the increased light and dark blue areas in the posterior part (Figure 9B). Furthermore, there is a reduction in driving pressure, indicating that further increases in tidal volume and PEEP do not impose additional stress on the lungs14,15.

Figure 9: Differences in ventilation at different PEEP values. (A) At PEEP 4 cmH2O, the image shows a difference in ventilation between the anterior (more ventilated) and posterior (less ventilated) regions. (B) Following an increase in PEEP from 4 to 10 cmH2O, improved ventilation in the posterior region is evident. Abbreviation: PEEP = positive-end expiratory pressure. Please click here to view a larger version of this figure.
Overdistension refers to the overexpansion or stretching of lung tissue beyond its physiologic capacity, leading to potential damage to the alveoli and surrounding structures. Overdistension could occur when the pressure applied from a mechanical ventilator to inflate the lungs is too high. Monitoring regional lung impedance during ventilatory procedures avoids overdistension and lung injury16. In Figure 10A, the patient is on PEEP of 22 cmH2O, whereas in Figure 10B, the PEEP is reduced to 12 cmH2O. In Figure 10B, the Ventilation Dynamic Image from EIT displays an increase in light and dark blue areas in the anterior lung, indicating increased ventilation. Simultaneously, there is a reduction in light and dark blue areas in the posterior lung (from 67% to 43%), suggesting a relief of overdistension associated with the higher PEEP of 22 cmH2O in Figure 10A. This example shows the ability of EIT to identify overdistension and promote lung protective ventilation across the lung9.

Figure 10: Changes in PEEP. (A) PEEP of 22 cmH2O; (B) PEEP of 12 cmH2O. Please click here to view a larger version of this figure.
Pneumothorax is a condition characterized by the presence of air in the pleural cavity, the space between the lung and the chest wall. This accumulation of air can lead to lung collapse, mediastinal shift, and hemodynamic collapse. With EIT, changes in the thorax impedance could be observed in real time, as depicted in the Ventilation Dynamic Image17,18,19. There is one sign in the Ventilation Dynamic Image showing the suspicion of pneumothorax, called the "out of phase" sign. The "out of phase" sign refers to a visual indication where the impedance changes in the lung do not align correctly with the respiratory cycle. In a normal respiratory cycle, impedance changes in the lung should be synchronized with the inhalation and expiration phases. When pneumothorax occurs, the Ventilation Dynamic Image will demonstrate a deviation from the expected pattern as the impedance changes are not synchronized with the normal inhalation and expiration phases. Additionally, an elevation in the baseline of the plethysmograph meaning an increase in end-expiratory lung impedance (EELI), despite PEEP reduction, may further indicate the presence of a pneumothorax (Figure 11).

Figure 11: The "out of phase" sign in a ventilation map. Simultaneously, the plethysmograph exhibits an elevation of baseline, despite a reduction in PEEP. Both findings strongly support and confirm the presence of pneumothorax. Please click here to view a larger version of this figure.
Discussion
Respiratory impairment and the need for supportive intervention, including invasive mechanical ventilation, is common in hospitalized patients. Therefore, monitoring ventilation and pulmonary perfusion is critical to prompt and personalized diagnosis and treatment. As opposed to more standard imaging techniques such as X-ray and computerized tomography scan (CT-scan), EIT provides non-invasive, radiation-free imaging of the lungs and their regional characteristics in real-time1,2,3,4,20. EIT is useful at the bedside in both the intensive care unit and the operating room due to these capabilities. EIT not only provides ventilation monitoring but also offers the ability to analyze pulmonary perfusion, which is not currently feasible in routine clinical practice6,7,8.
During mechanical ventilation, protecting the lung is a key treatment goal. One of the goals is to avoid atelectasis and overdistension of the lungs, which can lead to alveolar injury. Typically, PEEP is administered to prevent atelectasis and maintain lung volume. Identifying the optimal PEEP for individual patients, known as "PEEP titration" is a crucial method, particularly in conditions like Acute Respiratory Distress Syndrome (ARDS), obesity, and abdominal hypertension21,22.
The conventional method for PEEP titration relies on oxygenation and lung mechanics. However, this approach does not account for regional lung changes and whether areas of the lung are hyperdistended or collapsed. Advanced techniques such as EIT provide bedside, detailed, real-time imaging of lungs during inspiration and expiration. PEEP titration using EIT allows to optimize oxygenation, and lung mechanics while minimizing parenchyma overdistension and collapse23,24,25,26,27,28.
More recently, EIT's perfusion tool has been developed to provide a detailed evaluation of regional pulmonary blood flow, allowing physicians and medical personnel to estimate the ventilation-perfusion relationship. The pulmonary perfusion evaluated by EIT has also been used to determine response to ventilation adjustments and oxygenation as well as response to pulmonary vasodilator therapy9,23,25,29,30,31. Additionally, EIT can also detect large pulmonary perfusion defects, suggesting the presence of thrombo-embolism32,33.
EIT has a few contraindications. First, EIT is not currently recommended in patients with pacemakers or implantable defibrillators. At present, there are no studies evaluating electrical interference of the EIT signal and the pacemaker function. Second, the impedance signal can be altered by conditions like significant pneumomediastinum or subcutaneous emphysema, impairing the correct interpretation of the ventilation and perfusion maps. Lastly, the requirement for the belt to be in close contact with the skin presents challenges in using EIT with patients who have thoracic bandages34.
It is crucial to exercise caution and avoid using the perfusion tool in certain scenarios: patients receiving increasing doses of vasopressors; patients with hypernatremia; patients with active pneumothorax and/or bronchopleural fistula; newborn and pediatric patients. Utilizing EIT for perfusion assessment alongside traditional ventilation imaging empowers healthcare providers with a deeper understanding of lung function, aiding in the diagnosis and treatment of patients in various clinical settings.
Considerations for specific populations
The principles for EIT technology apply to neonates, pediatric, and adult patients accordingly with chest perimeter and belt size correspondent. The belts for neonates are disposable and recommend being placed for 24 h instead of 48 h for adults. A specific flow sensor has been created capable of measuring the small tidal volumes (from 3 mL to 100 mL) associated with this population and having a corresponding dead space of 1 mL.
Online monitoring categorizes the lungs into predefined Regions of Interest (ROI), for example. four halves (left, right, anterior, and posterior), or four horizontal layers. However, the offline analysis could provide more opportunities for in-depth analysis, such as pixel-by-pixel. All the data from EIT are stored in a proprietary format known as Product Information Management (PIM). The PIM file encapsulates preprocessed information, including measured voltage before tomographic reconstruction, unfiltered signals, and ventilation parameters. To extract the PIM file for offline analysis, plug a USB drive into the slot on the EIT device; then, select the index patient. Offline analysis is useful because it provides all the detailed data needed for understanding pulmonary physiology.
As a bedside diagnostic tool, EIT could assist in diagnosing conditions such as atelectasis, overdistension, and pneumothorax. In addition to clinical presentation and physical examination, EIT offers detailed information for these diagnoses. EIT enables faster information retrieval compared to classic investigation. This capability empowers physicians and other medical personnel to diagnose and promptly treat patients24,35,36,37.
Learning how to use and interpret EIT is essential because it proves beneficial in clinical practice. Its non-invasive nature and real-time monitoring capabilities make EIT a valuable tool for healthcare clinicians in various medical settings.
Disclosures
Glasiele Alcala, Caio C. A. Morais, and Marcus Victor received consulting fees, while Carolyn La Vita received testimonial fees from Timpel, which manufactures a device used in this study. Marcelo B. P. Amato is a minority shareholder of Timpel. None of the other authors has any conflicts of interest.
Acknowledgements
We express our sincere appreciation to all the co-authors for their contribution to this paper and thank TIMPEL Medical for generously supporting this manuscript with equipment and support.
Materials
| Name | Company | Catalog Number | Comments |
|---|---|---|---|
| EIT equipment (ENLIGHT2100) | Timpel Medical | ||
| Belts | Timpel Medical | ||
| Belt coverage | Timpel Medical | ||
| Flow sensor | Philips | ||
| Reference Cable | Timpel Medical | ||
| Solution with high electrical conductivity (eg. hypertonic saline, sodium bicarbonate) | Not applicable |
References
- Costa, E. L., Lima, R. G., Amato, M. B. Electrical impedance tomography. Curr Opin Crit Care. 15 (1), 18-24 (2009).
- Frerichs, I., et al. Chest electrical impedance tomography examination, data analysis, terminology, clinical use and recommendations: consensus statement of the TRanslational EIT developmeNt stuDy group. Thorax. 72 (1), 83-93 (2017).
- Borges, J. B., et al. Regional lung perfusion estimated by electrical impedance tomography in a piglet model of lung collapse. J Appl Physiol (1985). 112 (1985), 225-236 (2012).
- Victorino, J. A., et al. et al. Imbalances in regional lung ventilation: a validation study on electrical impedance tomography. Am J Respir Crit Care Med. 169 (7), 791-800 (2004).
- Heines, S. J. H., et al. Pulmonary pathophysiology development of COVID-19 assessed by serial Electrical Impedance Tomography in the MaastrICCht cohort. Sci Rep. 12 (1), 14517(2022).
- Nascimento, M. S., et al. Effect of general anesthesia and controlled mechanical ventilation on pulmonary ventilation distribution assessed by electrical impedance tomography in healthy children. PLoS One. 18 (3), e0283039(2023).
- Zhao, Z., Fu, F., Frerichs, I. Thoracic electrical impedance tomography in Chinese hospitals: a review of clinical research and daily applications. Physiol Meas. 41 (4), 01(2020).
- Kobylianskii, J., Murray, A., Brace, D., Goligher, E., Fan, E. Electrical impedance tomography in adult patients undergoing mechanical ventilation: A systematic review. J Crit Care. 35, 33-50 (2016).
- Costa, E. L., et al. Bedside estimation of recruitable alveolar collapse and hyperdistension by electrical impedance tomography. Intensive Care Med. 35 (6), 1132-1137 (2009).
- Mendes, P. V., et al. Lung perfusion during veno-venous extracorporeal membrane oxygenation in a model of hypoxemic respiratory failure. Intensive Care Med Exp. 10 (1), 15(2022).
- Gaulton, T. G., et al. Regional lung perfusion using different indicators in electrical impedance tomography. J Appl Physiol (1985). 135 (3), 500-507 (2023).
- Martin, K. T., et al. Electrical impedance tomography identifies evolution of regional perfusion in a porcine model of acute respiratory dstress syndrome. Anesthesiology. 139 (6), 815-826 (2023).
- Xin, Y., et al. Improving pulmonary perfusion assessment by dynamic contrast-enhanced computed tomography in an experimental lung injury model. J Appl Physiol (1985). 134 (6), 1496-1507 (2023).
- vander Burg, P. S., Miedema, M., de Jongh, F. H., van Kaam, A. H. Unilateral atelectasis in a preterm infant monitored with electrical impedance tomography: a case report. Eur J Pediatr. 173 (12), 1715-1717 (2014).
- Riva, T., et al. Evaluation of atelectasis using electrical impedance tomography during procedural deep sedation for MRI in small children: A prospective observational trial. J Clin Anesth. 77, 110626(2022).
- He, H., et al. Influence of overdistension/recruitment induced by high positive end-expiratory pressure on ventilation-perfusion matching assessed by electrical impedance tomography with saline bolus. Crit Care. 24 (1), 586(2020).
- Girrbach, F., et al. Detection of posttraumatic pneumothorax using electrical impedance tomography-An observer-blinded study in pigs with blunt chest trauma. PLoS One. 15 (1), e0227518(2020).
- Yang, Y., et al. Bedside electrical impedance tomography in early diagnosis of pneumothorax in mechanically ventilated ICU patients - a single-center retrospective cohort study. J Clin Monit Comput. 37 (2), 629-637 (2023).
- Kallio, M., et al. Electrical impedance tomography reveals pathophysiology of neonatal pneumothorax during NAVA. Clin Case Rep. 8 (8), 1574-1578 (2020).
- Pereira, S. M., et al. Individual positive end-expiratory pressure settings optimize intraoperative mechanical ventilation and reduce postoperative atelectasis. Anesthesiology. 129 (6), 1070-1081 (2018).
- Jimenez, J. V., Weirauch, A. J., Culter, C. A., Choi, P. J., Hyzy, R. C. Electrical impedance tomography in acute respiratory distress syndrome management. Crit Care Med. 50 (8), 1210-1223 (2022).
- Becher, T., et al. Individualization of PEEP and tidal volume in ARDS patients with electrical impedance tomography: a pilot feasibility study. Ann Intensive Care. 11 (1), 89(2021).
- Barbas, C. S. V., Amato, M. B. P. Electrical impedance tomography to titrate PEEP at bedside in ARDS. Respir Care. 67 (8), 1061-1063 (2022).
- Maciejewski, D., Putowski, Z., Czok, M., Krzych, L. J. Electrical impedance tomography as a tool for monitoring mechanical ventilation. An introduction to the technique. Adv Med Sci. 66 (2), 388-395 (2021).
- Jonkman, A. H., et al. Lung recruitment assessed by electrical impedance tomography (RECRUIT): A multicenter study of COVID-19 acute respiratory distress syndrome. Am J Respir Crit Care Med. 208 (1), 25-38 (2023).
- Jimenez, J. V., et al. Electric impedance tomography-guided PEEP titration reduces mechanical power in ARDS: a randomized crossover pilot trial. Crit Care. 27 (1), 21(2023).
- Sella, N., et al. Electrical impedance tomography: A compass for the safe route to optimal PEEP. Respir Med. 187, 106555(2021).
- Slobod, D., et al. Integrating electrical impedance tomography and transpulmonary pressure monitoring to personalize PEEP in hypoxemic patients undergoing pressure support ventilation. Crit Care. 26 (1), 314(2022).
- Spina, S., et al. Modulation of pulmonary blood flow in patients with acute respiratory failure. Nitric Oxide. 136-137, 1-7 (2023).
- Cenci, S., Santiago, R. S., Bittner, E. A., Berra, L. Assessing regional lung perfusion changes to inhaled pulmonary vasodilators by electrical impedance tomography. Am J Respir Crit Care Med. 208 (9), e39-e40 (2023).
- Ekkapat, G., Ribeiro De Santis Santiago, R., Victor, M., Berra, L. Electrical impedance tomography for assessing the impact of inhaled nitric oxide on pulmonary artery pressure. Anesthesiology. , (2024).
- He, H., et al. Bedside evaluation of pulmonary embolism by saline contrast electrical impedance tomography method: A prospective observational study. Am J Respir Crit Care Med. 202 (10), 1464-1468 (2020).
- He, H., et al. Three broad classifications of acute respiratory failure etiologies based on regional ventilation and perfusion by electrical impedance tomography: a hypothesis-generating study. Ann Intensive Care. 11 (1), 134(2021).
- Ribeiro De Santis Santiago, R., et al. Lung imaging acquisition with electrical impedance tomography: Tackling common pitfalls. Anesthesiology. 139 (3), 329-341 (2023).
- Zhou, R., et al. Electrical impedance tomography to aid in the identification of hypoxemia etiology: Massive atelectasis or pneumothorax? A case report. Front Med (Lausanne). 9, 970087(2022).
- Rubin, J., Berra, L. Electrical impedance tomography in the adult intensive care unit: clinical applications and future directions. Curr Opin Crit Care. 28 (3), 292-301 (2022).
- Tomicic, V., Cornejo, R. Lung monitoring with electrical impedance tomography: technical considerations and clinical applications. J Thorac Dis. 11 (7), 3122-3135 (2019).
Reprints and Permissions
