This protocol demonstrates the pan-lyssavirus LN34 real-time reverse transcription-polymerase chain reaction (RT-PCR) assay from tissue collection to result interpretation, including updates to primer sequences and formulations to improve assay performance for some non-rabies lyssaviruses and lagomorphs. We also demonstrate the assay setup for a single-well LN34 multiplexed (LN34M) format.
Method Article
Postmortem Diagnosis of Rabies in Animals by the Updated, Multiplexed LN34 Real-Time Reverse Transcription-Polymerase Chain Reaction Assay
In This Article
Summary
Abstract
Rabies is a fatal zoonotic disease caused by Lyssavirus rabies (RABV) and related negative strand RNA viruses from the Lyssavirus genus (family Rhabdoviridae). The LN34 assay targets the highly conserved leader region and nucleoprotein gene of the lyssavirus genome and utilizes degenerate primers and a TaqMan probe containing locked nucleotides to detect RNA across the diverse Lyssavirus genus. A negative finding for rabies should be made only if a full cross-section of the brain stem and three lobes of the cerebellum are examined; however, identification of lyssavirus RNA in any tissue is diagnostic of rabies infection. Tissue is collected and homogenized in TRIzol reagent, which also inactivates the virus. RNA extraction is performed using a spin column-based commercial extraction kit. Master mixes are prepared in a clean space and aliquoted into a 96 well plate before adding sample RNA. In clinical settings, each sample is tested by real-time RT-PCR for the presence of lyssavirus RNA in triplicate and singly for host β -actin mRNA. Positive and negative controls are included at extraction and real-time RT-PCR steps of the protocol. Data analysis involves manual adjustment of the thresholds to standardize Ct values across instrument runs. Positive results are determined by the presence of typical amplification in the pan-lyssavirus assay (Ct ≤ 35). Negative results are determined by the absence of typical amplification in the pan-lyssavirus assay and detection of host β-actin mRNA (Ct ≤ 33). Observation of values outside of these ranges or failure of the assay controls can invalidate the run or result in inconclusive results for a specimen. The protocol should be closely followed to ensure high assay sensitivity and specificity. Procedural modifications can affect assay performance and lead to false positive, false negative, or uninterpretable results.
Introduction
This protocol describes the procedure for rabies diagnostic testing using the LN34 pan-lyssavirus real-time reverse transcription-polymerase chain reaction (RT-PCR) assay from sample collection through result interpretation. The procedure will be broken into three sections: brain sample collection as relevant to the LN34 assay (Section 1), manual column-based RNA extraction using the Direct-zol RNA Miniprep kit (Zymo Research R2051) (Section 2), and LN34 real-time RT-PCR assay set up using the AgPath-ID One-Step RT-PCR kit (ThermoFisher Scientific AM1005) (Section 3). RNA extraction and RT-PCR may be performed using other products, but kits should be validated prior to use to ensure that Lyssavirus RNA is extracted and amplified appropriately.
Section 1 describes the collection of the proper brain tissues to be used in the LN34 real-time RT-PCR assay. Description of animal necropsy, decapitation, and removal of brain are not included. Samples may contain infectious agents. Biosafety procedures detailed in the Biosafety in Microbiological and Biomedical Laboratories 6th Edition1 should be followed to mitigate risk. Samples should be considered infectious until completion of inactivation. Viral inactivation and assay validation should be performed in each laboratory according to that institution's standards. Laboratories should follow standard safety and quality procedures determined by their institution when implementing a new diagnostic test.
Based on what is known about the spread of rabies virus during infection, the brain stem and cerebellum are the best tissues for rabies diagnosis, and these tissues are recommended for rabies testing by the World Health Organization and the World Organization for Animal Health2,3,4,5. Because virus spread may be unilateral (Figure 1), especially in larger animals, a complete cross-section of the brain stem and three lobes of the cerebellum should be examined for rabies rule-out. For samples that do not meet these minimum criteria, the laboratory may reject the sample as insufficient for testing or opt to test for surveillance or rule-in purposes. If the required tissues are not received, but the laboratory opts to test the sample, a negative test result should be interpreted as inconclusive for rabies for that animal because viral RNA presence in other tissues can be delayed, low abundance, intermittent, or not existent. Collection of the required samples or additional testing is needed to rule out rabies in that case. However, identification of lyssavirus RNA in any tissue is diagnostic of rabies infection3,6. Examples of samples that may be tested for rabies virus RNA for rule-in or surveillance (but not rule out) rabies infection are cortex, hippocampus, spinal cord, degraded samples, skin, saliva, and cornea. A qualitative assessment of the condition of each sample should be made upon arrival in the laboratory. Refrigeration can preserve a sample for at least 72 h but should not be used long term. Repeated freeze-thaw cycles may reduce test sensitivity, and more than five freeze-thaw cycles should be avoided. If the condition of the tissue prevents the confident identification of brain structures, the sample should be identified as unsatisfactory. In the case of an unsatisfactory specimen, testing can still be performed to rule in (but not rule out) rabies. Positive test results are reported as such. Negative or inconclusive results on unsatisfactory tissue should be reported as inconclusive to prevent misinterpretation as a negative diagnosis.
This protocol was developed from published procedures7,8,9 and includes updated primers targeting the lyssavirus genome leader region and nucleoprotein coding sequence. The probe targets a short, highly conserved sequence and uses locked nucleotides to allow for broad detection. The assay detects RNA from diverse lyssaviruses at varying concentrations8. This protocol demonstrates the laboratory procedures to perform the LN34 real-time PCR assay, but accurate and sensitive detection of lyssavirus RNA is dependent on other elements that are not extensively covered in this protocol, such as specimen storage, record keeping, personnel training/competency, result tracking, result interpretation, quality assurance, laboratory safety measures, and troubleshooting. PCR-based assays are prone to cross-contamination due to their high sensitivity. Cross-contamination can be avoided by adhering to good laboratory practices, such as frequently switching gloves, handling one sample at a time, disinfecting work surfaces with effective decontaminating agents between samples, and keeping tubes closed and samples separate from PCR reagents. PCR reagents and samples can be easily separated by employing a unilateral workflow and separating pre-amplification and post-amplification work areas. For instance, prepare PCR mastermixes in a location physically separate from where samples are handled. Change gloves often to avoid contamination of PCR reagents with samples, debris or positive control RNA. The PCR plate or tubes should be moved after mastermix addition to a second location where sample and control RNA can be added. Importantly, PCR products should not be manipulated in areas where samples or mastermixes are prepared.
There is no substitute for hands-on practice and experience when performing diagnostic tests. All new employees should be trained, and testing personnel should be evaluated for competency at least once per year following the requirements of the relevant laboratory director. Any observations of unusual results or assay failure should be noted, investigated, and corrected immediately. Each new lot of reagents should be validated using samples with known Ct values (such as a positive control or archived sample). All equipment should undergo routine maintenance, as suggested by the manufacturer, and assay performance should be verified after any maintenance or repair. Temperature levels should be monitored on applicable equipment to ensure refrigerators and freezers stay within the criteria set for an acceptable temperature range for reagents used in diagnostic testing.
Procedural modifications can affect assay performance and may lead to false positive, false negative, or uninterpretable results. The recommendations should be closely followed to ensure high assay sensitivity and specificity. A laboratory wishing to incorporate modifications to this protocol should validate and confirm the modified methods in consultation with the CDC.
Protocol
Postmortem brain tissue samples were obtained via routine surveillance or diagnostic activities of the Poxvirus and Rabies Branch (CDC; Atlanta, GA, USA).
1. Collection of brain tissue for postmortem diagnosis of rabies in animals by the LN34 pan-lyssavirus real-time RT-PCR assay
NOTE: Samples may contain infectious agents. Wear appropriate personal protective equipment (PPE) (heavy rubber gloves or other cut-resistant gloves, laboratory gown, waterproof apron, surgical mask, boots, protective sleeves, and a face shield) and follow required safety regulations for use, storage, and disposal of samples. Preexposure rabies vaccination, regular serologic testing, and booster immunizations (as necessary) are required for anyone prior to working with, testing, producing, or performing research activities with lyssaviruses or known or potentially infected specimens2,3,4,6,10.
- Label one sample collection tube per sample with an accession label. Fill each sample collection tube with 1 mL of TRIzol reagent or other homogenization buffer and a portion of MagNA Lyser beads (hereafter "ceramic beads").To add ceramic beads, pour carefully from the tube of beads into the sample collection tube. Tubes of ceramic beads generally contain enough beads for 2-5 samples, using at least 20 1.4 mm diameter beads per sample.
CAUTION: TRIzol reagent (hereafter "homogenization buffer") is a hazardous chemical; contact with acids or bleach liberates toxic gases; ensure adequate ventilation; please refer to the safety data sheet for more information. If users substitute the TRIzol reagent or TRI reagent for another homogenization buffer, additional validation is necessary. TRIzol acts as a sample homogenization/lysis buffer, lyssavirus inactivation buffer, and RNA stability buffer for this protocol. The use of an alternate homogenization buffer will require validation of extraction efficiency, inactivation, and stability in a controlled side-by-side comparison. - Clean and disinfect the work surface with quaternary ammonium compounds (QAC) disinfectant for 2 min and lay out a plastic-lined absorbent pad. Place only reagents and supplies for the first sample in a Class II biological safety cabinet (BSC) with features to exhaust hazardous fumes outside the room.
NOTE: Refer to the manufacturer’s guidance for storage limits of diluted QAC. Ensure the plastic-lined pad does not block the airflow of the biological safety cabinet. If airflow is disrupted, do not use a pad. - Collect tissue representing a full cross-section of the brain stem and cerebellum using a clean single-use scalpel.
NOTE: Manipulation of tissues should be conducted in a manner that does not aerosolize liquids or produce airborne particles. Fume hoods or biosafety cabinets are not required, but vented biosafety cabinets are recommended since they provide additional protection from odors, fumes, ectoparasites, and bone fragments.
CAUTION: Use of a scalpel with material potentially infected with lyssavirus is hazardous, and users should take appropriate safety precautions. The use of single-use forceps is recommended.- For small animals (like bats), the entire brain stem and cerebellum may be collected.
- For larger animals, collect a full cross-section of brain stem and tissue from each of the three lobes of the cerebellum.
- OPTIONAL: If performing the direct fluorescent antibody (DFA) test, collect brain impressions at this point. Use the tissue remaining after collecting brain impressions for DFA for RNA extraction and testing by the LN34 assay.
NOTE: If TRIzol is added to samples, samples can no longer be used for antigen-based detection methods or virus isolation.
- Prepare samples for homogenization and RNA extraction.
NOTE: The efficiency of RNA extraction and virus inactivation can be impacted by using too much tissue. The amount of tissue should not exceed roughly 1/10 the volume of the homogenization buffer used. If more tissue is used, increase the amount of homogenization buffer accordingly to ensure efficient and successful RNA extraction.- For small animals, place all required tissues into a tube containing homogenization buffer and beads for extraction. Do not exceed 100 mg of sample in 1 mL of homogenization buffer; for larger samples, increase the volume of homogenization buffer or use multiple tubes to reflect a 1:10 ratio sample: buffer.
- For larger animals, mince and homogenize the tissue thoroughly and remove a representative portion to a tube prefilled with homogenization buffer and beads. Do not exceed 100 mg of sample in 1 mL of homogenization buffer; for larger samples, increase the volume of homogenization buffer or use multiple tubes to reflect a 1:10 ratio sample: buffer.
- Option 1 (Bead beater): Homogenize tissue using a bead beater, 1 mL of buffer, and ceramic beads. Several 2 mL tubes or larger tubes may need to be used.
- Option 1 (Bead beater): Clean and disinfect the workstation, equipment, and outside sample tubes with QAC disinfectant (1:256). Let it stand for 2 min.
- Option 1 (Bead beater): Inside the BSC, load a centrifuge rotor with homogenized sample(s). Centrifuge all sample(s) at 10,000-16,000 × g for 2 min in a tabletop microcentrifuge. Unload the centrifuge rotor inside the BSC.
- Option 1 (Bead beater): Let it stand for 2 min.
- Option 1 (Bead beater): Transfer 120 µL of homogenate to a tube prefilled with 1 mL of homogenization buffer.
CAUTION: Homogenization may produce aerosols and should be performed in a BSC. - Option 2 (Scalpel): Finely mince the required tissues using a single-use scalpel, smear with a swab, and transfer the swab to a tube prefilled with homogenization buffer and beads. Do not exceed 100 mg of sample in 1 mL of homogenization buffer; for larger samples, increase the volume of homogenization buffer or use multiple tubes to reflect a 1:10 ratio sample:buffer.
CAUTION: Use of a scalpel with material potentially infected with lyssavirus is hazardous, and users should take appropriate safety precautions.
- Collect any remaining tissues into the original container or into a new, empty container labeled with an accession label. Store this tissue in case retesting or additional characterization is required.
- Clean and disinfect the workstation, equipment, and outside of sample tubes with QAC disinfectant 1:256. Let it stand for 2 min.
- Repeat steps 1.2-1.5 for all remaining samples.
- Homogenize samples with a mini bead beater for at least 60 s. Visually inspect the tubes. Repeat the bead beater for an additional 60 s if large tissue pieces remain. This step is optional if the tissue is completely homogenized in step 1.4.2.1 above.
NOTE: It is important to ensure that tissue is thoroughly homogenized. Incomplete homogenization will decrease RNA yield. - Let sit for at least 5 min at room temperature (RT).
- Clean and disinfect the workstation, equipment, and outside of sample tubes with QAC disinfectant (1:256).
NOTE: The sample is considered non-infectious at this time and can be removed from the rabies laboratory. - Immediately process samples in homogenization buffer for RNA extraction, store at RT (20 °C to 25 °C) or refrigerated (4 °C to 8 °C) for several days, or store at -16 °C or colder for long-term storage.
2. Protocol for RNA extraction using RNA MiniPrep kit
- Set up the workspace under the BSC.
- Clean the BSC work surface using 70% ethanol prior to starting work to remove dust or other environmental contaminants. Perform additional surface decontamination with QAC disinfectant (1:256), RNase AWAY, or RNaseZap (according to the manufacturer's recommendations).
- Lay out a plastic-lined absorbent work pad, and place reagents, supplies, and the sample in the BSC.
NOTE: Ensure the plastic-lined pad does not block the airflow of the BSC. If airflow is disrupted, do not use a pad. - Lay out all collection tubes in a clean rack for microcentrifuge tubes. Prefill one 1.5 mL microcentrifuge tube with 300 µL of 100% ethanol for each non-bat brain sample. For samples with little tissue (bat brain sample, non-brain sample, or deteriorated sample), prefill one 1.5 mL microcentrifuge tube with 600 µL of 100% ethanol for each.
- Sample preparation
- Collect all samples prepared in section 1 in a tube rack in the BSC. Thaw any frozen samples just prior to testing.
- Thaw an extraction control.
NOTE: It is recommended that a sample with no lyssavirus RNA be chosen; the sample should be previously tested with an expected Ct value range for the beta-actin assay. For example, pre-aliquoted tissue culture cells or a previously tested negative rabies case (human or animal).
- Centrifuge all samples at 10,000-16,000 × g for 2 m in a tabletop microcentrifuge.
- Transfer the supernatant into a new sterile microcentrifuge tube containing 100% ethanol. Ensure that the supernatant is clear, without obvious lipids or solid tissue. Avoid collection of lipids and solid tissue.
- For non-bat brain tissue: transfer 300 µL of supernatant.
- For samples with little tissue (bat brain sample, non-brain sample, or deteriorated sample), transfer 600 µL of supernatant.
- Store the remaining homogenate in a screw-top microcentrifuge tube at ≤-16 °C.
- Pipette up and down 10 times to mix.
- For each sample, transfer 600 µL of the ethanol-supernatant mixture to a spin column in a collection tube.
- Centrifuge until the liquid has passed through the column (1 min at 10,000-16,000 × g). Discard the flow-through.
- Repeat if there is more than 600 µL of ethanol-homogenization buffer mixture for a sample.
- Transfer each column to a new collection tube.
- Add 400 µL of RNA prewash buffer to each column and centrifuge at 10,000-16,000 × g for 30 s.
- Discard the flow-through and return each column to the same collection tube.
- Repeat steps 2.10-2.11.
- Add 700 µL of RNA wash buffer to each column and centrifuge at 10,000-16,000 × g for 2 min. Ensure that the wash buffer has passed through each column completely.
- Transfer each column carefully into an RNase-free tube.
- Discard the flow-through and the collection tube from 2.13.
- Add 50 µL of DNase/RNase-Free water directly to the column matrix to elute RNA.
NOTE: Do not touch the column matrix with the pipette tip. - Incubate for 30 s at RT, then centrifuge at 10,000-16,000 × g for 1 min.
- Carefully transfer RNA to a new screw top flat bottom accession labeled microcentrifuge tube. Move extracted RNA to ice for immediate testing. Store long-term at -70 °C or colder.
NOTE: Storage at warmer temperatures or repeated freeze-thaws can lead to RNA degradation and affect diagnostic results.
3. Protocol for LN34 pan-lyssavirus real-time RT-PCR assay
- Prepare reagents.
- Artificial positive control
- If an artificial positive control RNA is produced by CDC8, follow instructions on the packaging for storage, reconstituting, and aliquoting. Skip this step if single-use aliquots of positive control RNA are already in hand.
NOTE: Positive control RNA at working concentrations should be handled in the template addition area and not in the same area as mastermix preparation. Positive control RNA should produce a cycle threshold (Ct) value within the expected range determined for a given lot. Between runs, the LN34 Ct value for the positive control RNA should not differ by more than ±1.5 Ct values. - Thaw a single-use aliquot from ≤ -70 °C storage just before use on ice or ice block. Do not freeze-thaw, and discard aliquots kept for an extended time at refrigerated temperatures.
NOTE: A positive control should be run in triplicate in the LN34 assay; the artificial positive control8 will not amplify in the beta-actin assay.
- If an artificial positive control RNA is produced by CDC8, follow instructions on the packaging for storage, reconstituting, and aliquoting. Skip this step if single-use aliquots of positive control RNA are already in hand.
- Extraction control and samples: Place freshly extracted samples on ice (or ice block) or thaw samples from ≤ -70 °C storage on ice (or ice block) immediately prior to use.
NOTE: RNA should be thawed and processed in an area designated for sample or template addition that is separate from areas used for mastermix preparation or manipulation of PCR products or large amounts of viral material (e.g., positive control generation, viral propagation)
- Artificial positive control
- Prepare mastermix reagents in the mastermix preparation area.
- Mastermix preparation of singleplex LN34 RT-PCR assay
NOTE: Users may test samples in singleplex (step 3.2.1) or multiplex (step 3.2.2) format. Performing both 3.2.1 and 3.3.2 is not necessary. Mastermix preparation, primer and probe aliquoting, and no template control reagents should be thawed and manipulated in a clean area separate from sample processing, necropsy, PCR, and other areas where viral materials are manipulated. This may be achieved through separate rooms or a cabinet system with unilateral sample flow.- Generate primer and probe mixes at working concentrations as indicated in Table 1 and Table 2. Skip this step if the working dilution aliquots of primers and probes are already in hand.
- Aliquot primers and probes into 1.5 mL storage stocks and 50 µL working stocks and store at ≤ -16°C in the dark. Skip this step if the working dilution aliquots of primers and probes are already in hand.
NOTE: Performing step 3.2.1.2 is recommended. - Thaw one-step RT-PCR buffer, no template control, primers, and probes from ≤ -16 °C storage on ice or ice block in the mastermix preparation area.
NOTE: Use reagents until the expiration date or performance failure, whichever comes first. - Briefly vortex and centrifuge all buffers, primers, and probes before use.
- Store one-step RT-PCR enzyme on ice or in an ice block until use.
- RNA samples
NOTE: Use freshly extracted RNA whenever possible, as freeze-thaws may affect performance - Store RNA samples on ice or ice block until use.
- Thaw any frozen RNA samples on ice or an ice block.
- Label one microcentrifuge tube per assay (LN34 and βA).
- Determine the number of reactions (N) to set up per assay.
- Calculate the number of reactions for the LN34 assay by multiplying the number of samples by 3 and adding 6 for control reaction wells plus 10% extra reactions to account for volume lost during pipetting. (e.g. For 10 samples: (10 x 3) + 6 = 36 reactions; excess reactions: (36 x 0.1) + 36 = 3.6 + 36 = 39.6 total reactions, or 40 reactions rounded up)
NOTE: For clinical testing, it is suggested to test all samples in triplicate for LN34. For surveillance purposes, each sample may be tested in duplicate. It is recommended that triplicate be used during initial assay onboarding to ensure low variability between replicates and good technique. - Calculate the number of reactions for the βA assay by adding the number of samples plus 4 control reaction wells plus 10% extra reactions to account for volume lost during pipetting.
- Determine the volume of each reagent for the LN34 and βA mastermixes using Table 2.
- Designate wells for each sample to be tested in triplicate in the LN34 assay and singlicate for the βA assay using a 96 well plate map.
- Dispense 23 µL of LN34 assay mastermix into each LN34 assigned well after briefly vortexing and spinning down for 30 s using a tabletop microcentrifuge to collect liquid at the bottom of the tube. Avoid introducing bubbles.
- Dispense reagents 23 µL of βA assay mastermix into each βA-labeled assigned well after briefly vortexing and spinning down for 30 s in a tabletop microcentrifuge to collect liquid at the bottom.
- Set up the no template control (NTC) reactions by pipetting 2 µL of PCR-grade water into each NTC well.
- Cover wells and transfer plate to template addition area.
- Briefly vortex and centrifuge the tubes containing the RNA samples.
- Pipette 2 µL of extracted RNA from the first sample into each well labeled for that sample. Avoid introducing bubbles.
- Ensure RNA was drawn into the pipette by visualization.
- Pipette on the side of the well to ensure the sample is added to the correct well.
- Avoid waving pipette tips containing RNA over open wells as much as possible.
- Repeat step 3.2.10 for the remaining samples and the positive control RNA.
- Place the optical adhesive cover over the wells after adding all samples and controls. Be careful to to cover all wells and seal completely.
- Centrifuge at 500 × g for 1 min at RT in a tabletop centrifuge or use a salad spinner type plate spinner.
- Place the sealed plate into a real-time PCR instrument calibrated for FAM and VIC/HEX reporter dyes and set it to the cycling parameters shown in Table 3.
- Prepare master mixes for LN34 Multiplexed (LN34M) assay.
- Label one microcentrifuge tube LN34M according to Table 2.
- Determine the number of reactions (N) to set up per assay.
- Calculate the number of reactions for the LN34M assay by multiplying the number of samples by 3 and add 6 for control reaction wells plus 10% extra reactions to account for volume lost during pipetting. (e.g., For 10 samples: (10 x 3) + 6 = 36 reactions; excess reactions: (36 x 0.1) + 36 = 3.6 + 36 = 39.6 total reactions, or 40 reactions rounded up)
- Choose either 25 µL or 12.5 µL format. Determine the volume of each reagent for the LN34M mastermix using Table 2.
- Designate wells for each sample to be tested in triplicate in the LN34M assay using a 96 well plate map.
- Dispense reagents for the LN34M assay into the wells. Briefly vortex and spin down tubes to collect liquid at the bottom prior to dispensing 23 µL (for 25 µL reaction) or 10.5 µL (for 12.5 µL reaction) of master mix into each assigned well. Avoid introducing bubbles.
- Set up the NTC reactions by pipetting 2 µL of PCR-grade water into each NTC well.
- Cover wells and transfer plate to template addition area.
- Briefly vortex and spin down tubes the tubes containing the RNA samples to collect liquid at the bottom.
- Pipette 2 µL of extracted RNA from the first sample into each well labeled for that sample. Avoid introducing bubbles.
- Ensure RNA is drawn into the pipette visualization.
- Pipette on the side of the well to ensure the sample is added to the correct well.
- Avoid waving pipette tips containing RNA over open wells as much as possible.
- Repeat step 3.3.8 for the remaining samples and the positive control RNA.
- After adding the last sample/control, place the optical adhesive cover over the wells, ensuring that all the wells are covered and sealed completely.
- Centrifuge at 500 × g for 1 min at RT in a tabletop centrifuge or use a salad spinner type plate spinner.
- Place the sealed plate into a real-time PCR instrument calibrated for FAM and VIC/HEX reporter dyes and set it to the cycling parameters, as shown in Table 3. Set the passive reference dye to ROX and run in Standard Mode (do not run in Fast Mode)
NOTE: This setting is specific to the instruments mentioned in this protocol and requires the use of a one-step RT-PCR reagent containing ROX as a passive dye. Alternative instruments require different approaches to determine optimal run settings. Ensure normal instrument maintenance per the manufacturer for best performance.
- Mastermix preparation of singleplex LN34 RT-PCR assay
4. Result interpretation
- Set an automatic baseline and manual threshold calculations using a value of 0.2 for LN34/FAM and 0.05 for βA/HEX/VIC.
NOTE: This setting is specific to the instruments mentioned in this protocol and requires the use of a one-step RT-PCR reagent containing ROX as a passive dye. Alternative instruments require different approaches to calculate baseline and threshold values. - Determine the diagnostic result using the guidance in Table 4 if all controls performed as expected (Table 5).
- Confirm all Ct or Cq values by viewing amplification plots.
- Investigate any unusual results as recommended.
5. Sample Retention and Storage
- Store all samples frozen at -16 °C or lower until testing is complete and results are reported. Retain the original tissues to confirm results or identify the host animal to species in case of unusual test results.
- Use unique sample identifiers; label all tubes, reports, and paperwork with full unique sample identifiers.
- Retain intermediate samples (short term) in case repeat testing is required.
- Retain representative positive samples as needed for use as controls, epidemiologic typing, and other purposes.
- Store RNA at ≤-70 °C for long-term storage.
Results
Representative images from a successful LN34 assay run on an ABI ViiA7 real-time PCR instrument are shown in Figure 2. Viewing results plotted on a logarithmic scale allows for easy viewing of the Ct value, the point at which the curve crosses the threshold line (Figure 2A,C). When plotted on a linear scale, successful amplification will appear as a sigmoidal (or "S"-shaped) curve (Figure 2B,D), while negative results should appear as a straight, flat line. Viewing results in both linear and log scale views is recommended to identify possible anomalies or errors. Typical positive and negative results in the multicomponent plot view can be seen in Figure 2E,F, respectively, where the fluorescence level of the dye labeling the probe (FAM for LN34, VIC/HEX for βA) can be observed relative to the passive dye in the reaction buffer (ROX).
Examples of abnormal results are shown in Figure 3. Comparisons between the graphs of successful runs (Figure 2) and abnormal graphs (Figure 3) can be used to isolate atypical runs and instrument issues. Figure 3A shows a signal crossing the threshold, producing a Ct value for LN34, but the amplification curve is very atypical, increasing linearly. The multicomponent (Figure 3B) plot also shows a wavy line that is not typical of a positive sample. This example highlights the importance of viewing the amplification plots and not simply copying Ct values. Always ensure the amplification curves look normal for all samples. Viewing the multicomponent plot is also advised to ensure that no irregularities are present. On occasion, messy baseline signals can generate Ct values in cases where no amplification has occurred. If amplification signals appear linear, it is suggested that the baseline be adjusted to see if the curve disappears. In the case of any unusual signal, the entire run should be repeated. Cleaning and running a background plate on your real-time PCR instrument is recommended if issues persist. If available, PCR products can be run on an agarose gel and/or sequenced to troubleshoot any unusual results. It is not recommended to use the results of gel electrophoresis or sequencing to determine diagnostic results.
Previous studies have shown low variability between replicates, assay run, operator, and laboratory for the LN34 assay7. If high variability (>±1.5 Ct difference) between replicates of the same sample is observed, that RNA should be retested. High variability can be caused by issues with pipettes, laboratory practices, mis-pipetting, or real-time PCR machines. Repeated observation of high variability across several samples or across assay runs may indicate systemic issues. Samples with low RNA, approaching the assay threshold for a positive sample (Ct 35), may exhibit higher variability in Ct values between replicates. Consultation with CDC and troubleshooting may be necessary to address the cause of the persistent variability, inconsistent results, or assay failure.
The high sensitivity of PCR-based assays makes them inherently susceptible to contamination. Strict adherence to good laboratory practices is the best way to mitigate cross-contamination. Knowing how to identify potential contamination is important. Reagent contamination should be suspected if no template control and suspect negative sample wells in an assay run all produce similar Ct values. Repeat testing with new aliquots of PCR reagents (buffer, water, primers, and enzyme) and the same RNA. If all samples and extraction control produce similar CT values but NTC is negative, contamination of extraction reagents should be investigated, and extraction should be repeated using new reagents. It is good practice to make small aliquots of reagents in order to reduce the risk of contamination and avoid the possibility of discarding large volumes of expensive reagents. Sample cross-contamination is more difficult to identify. If sample contamination is suspected, repeat sample collection starting from the original tissues. In some cases, sequencing of the viral RNA can confirm contamination, especially when the contaminating RNA is very different from the expected viral variant (such as a control virus used in the laboratory). Sequencing of two samples processed at the same time can determine if the viral sequences are identical but may be uninformative if the sequences are expected to be very similar (for example, the same variant collected in the same county). If sample contamination with the positive control RNA is suspected, one can run the LN34 assay amplicons on an agarose gel to differentiate lyssavirus RNA (165 bp) from positive control RNA (99 bp). The sequence of the template used to generate the positive control RNA provided by CDC8.
For other pathogens, laboratorians may be used to set the threshold manually to get rid of "noise" such as the weak amplification shown in cyan in Figure 4. This practice is NOT recommended for rabies diagnosis because it can lead to false negative results with dire consequences since rabies is almost 100% fatal. Do NOT manually change the threshold to produce negative results for weak or late amplification samples. These samples must be re-extracted and/or retested to rule out rabies.
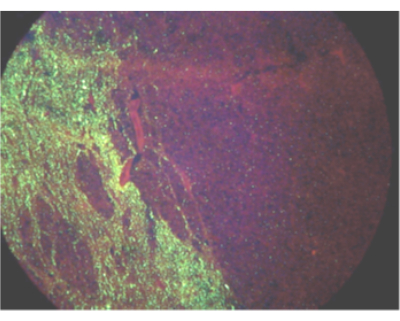
Figure 1: Field of view showing unilateral spread of rabies virus antigen in an infected donkey by direct fluorescent antibody test. Please click here to view a larger version of this figure.

Figure 2: Amplification and multicomponent plots from a successful LN34 assay run. (A-D) Result data are plotted on a (A,C) log scale and (B,D) linear scale for the LN34 and βA assay. Panels A and B depict LN34 results from two samples (in pink and cyan) compared to the positive control (in yellow). In panel B, there is a flat green line that depicts an additional negative sample in the run. In A, the green line(s) do not show any amplification and are depicted as broken segments. The threshold for the LN34 assay was set manually to 0.2 and is shown by the red horizontal line. (C,D) Results from the βA assay for two samples (red and cyan). The threshold for the βA assay was manually set at 0.05. (E,F) Multicomponent plots depict the fluorescence (RFU) at each cycle for FAM (LN34), VIC (βA), and ROX (passive dye present in AgPath-ID buffer). ROX levels should stay flat across all cycles. A typical positive sample is shown in panel E; FAM fluorescence increases as a sigmoidal curve starting at cycle 18 for this sample. A typical negative sample is shown in panel F, where the FAM level stays parallel to the ROX level across all cycles. Data are from an ABI ViiA7 real-time PCR instrument. Please click here to view a larger version of this figure.

Figure 3: Representative images of the rare, atypical signal observed in LN34 assay runs on a ViiA7 real-time PCR instrument. (A-F) Amplification (A,C,E) and multicomponent (B,D,F) plots produced due to well contamination. The linear increase (A,C) and wavy fluctuations (B,D) in FAM fluorescence do not represent true amplification based on the shape of the curves and the magnitude of the fluorescence change. Panels A through D likely represent negative samples even though a Ct value was produced for the replicate shown in panels A and B. Panels E and F show an odd wavy signal that is more easily seen in the multicomponent plot. This type of signal should be investigated and may indicate instrument issues, even though all controls performed as expected in this run. Please click here to view a larger version of this figure.

Figure 4: LN34 real-time RT-PCR curves from 2 rabies suspect samples showing two methods of setting threshold values. (A) LN34 threshold was set to 0.2 (recommended for all runs). (B) Manually determining a different threshold for each run to mask signal determined to be "noise" (late amplification signal). The method used in panel B is NOT recommended for rabies due to the severe consequences of missing a true positive result. Late amplification could indicate a weak positive sample, PCR inhibition, or failed extraction in a positive case. It could also indicate cross-contamination. The golden sample (indicated by black arrows) produces a Ct value at the assay's cutoff and should not be considered negative. Samples with late amplification should be re-extracted and retested. Please click here to view a larger version of this figure.
Table 1: Primer and probe sequences and concentrations used in the LN34lys (singleplex LN34), LN34M (LN34 and βA multiplexed) real-time RT-PCR assays. LN34 probes are labeled with the fluorescent FAM dye at the 5ʹend and Black Hole quencher (BHQ1) at the 3ʹend. The βA probe is labeled with the fluorescent HEX dye at the 5ʹend and Black Hole quencher (BHQ1) at the 3ʹend. Locked nucleotide-modified bases are indicated by a plus preceding the base in the sequence. Please click here to download this Table.
Table 2: Assay set up for LN34lys, Actin3, and LN34M assays. Primer and probe names, sequences, and concentrations can be found in Table 1. LN34_F1 corresponds to ACGCTTAACAACCAGATCAAAGAA7. Please click here to download this Table.
Table 3: Cycling parameters for ABI instruments. IMPORTANT: Make sure to run in STANDARD mode, not FAST mode. ROX should be selected as the passive reference dye. Please click here to download this Table.
Table 4: Algorithm for interpretation of LN34 real-time RT-PCR results for singleplex (top, blue table) and multiplex (bottom, red table) formats. A positive LN34 result should be considered positive, even if the βA result is negative or inconclusive. If LN34 amplicon is not detected, the βA Ct must be ≤ the Ct value cutoff listed to be considered negative. βA Ct values indicate the quality of the sample being tested and identify possible inhibition. Low concentration in the original clinical specimen may impact βA growth curves, leading to no discernable amplification. Additional contributing factors in the failure to detect β-actin include poor extraction of RNA due to loss of RNA or carryover of PCR inhibitors, incorrect assay setup and technique, unsatisfactory sample type or quality, and malfunction of reagents or equipment. Please click here to download this Table.
Table 5: Actions and interpretations of common results for LN34 assay controls. All three controls (rabies positive control RNA, rabies negative extraction control, and no template control must produce expected results for a run to pass. Failure in the positive control or no template control may indicate mispipetting, reagent, or equipment failure. The entire run, including all RNA samples tested must be repeated. Failure of the extraction control may indicate a problem during extraction, such as reagent failure, mispipetting, or cross-contamination. Extraction of all samples must be repeated. Failure of controls should be rare for experienced laboratory personnel. Please click here to download this Table.
Discussion
A successful LN34 assay run requires a positive control, extraction control, and no template control reactions perform as expected in each assay run or the run must be invalidated and repeated. All three LN34 positive control replicate reactions should cross the threshold within the specified range, or the run should be repeated. The positive control RNA described in previous publications7,8 will not amplify in the βA assay. The no template control reactions should not exhibit amplification curves that cross the threshold line for either the LN34 or the βA assay. The extraction control should not exhibit amplification for LN34. If unexpected amplification is observed in the NTC or extraction control, it may indicate contamination and invalidate the run and repeat testing for all samples (see Table 5). Users may consider adding additional controls, including a no-process control or no-sample extraction control, to monitor for host βA contamination of extraction reagents.
As rabies fatality approaches 100%, it is recommended that any weak or abnormal amplification be investigated further, even if it does not produce a Ct value. Negative or NTC reactions should not exhibit any amplification, and fluorescence should appear as a flat line parallel to the ROX fluorescence in the multicomponent view. Observations of curves, especially in multiple replicates, may indicate cross-contamination or a weak positive result. All replicates for a positive sample should be amplified for a valid positive result. If only a subset of replicates amplifies in either assay, the sample should be retested. Furthermore, any sample producing highly variable results (Ct value differences > ±1.5 between replicates) should be considered invalid, and the sample should be retested. If the issue persists, the sample should be re-extracted.
A rabies-positive sample extracted from properly collected and stored brain stem and cerebellum tissue is expected to have a Ct value of less than 35 cycles for the LN34 assay. All inconclusive samples must be retested by LN34 real-time RT-PCR. If the sample is inconclusive upon repeat testing and all controls performed as expected, re-extraction of RNA is recommended. Samples with low viral RNA (LN34 Ct > 35) may indicate potential problems such as contamination, low virus load, PCR inhibition, or failed extraction. Collect fresh pieces of the brain from the original tissue, perform RNA extraction, and retest the sample. Likewise, Ct values > 33 (singleplex), 37 (LN34M), or no amplification in the βA assay may indicate failed RNA extraction. Repeat extraction for such samples, then repeat testing for both LN34 and actin. If a sample produces an inconclusive result again after repeated testing, use a secondary method such as the DFA (also called FAT) test, DRIT, or virus isolation. If continued discordant results or inconclusive results are observed, please consult with a rabies reference laboratory for confirmatory testing.
If inhibitors are present in an RNA extraction, PCR assays may produce a false negative result. If inhibition is suspected or inhibition of the βA control reactions (such as Ct value > 33 or Ct value > 37) is noted for a particular sample, extracted RNA should be tested at 2 or more dilutions (e.g., 1:10 and 1:100 in nuclease-free water) to dilute out any potential PCR inhibitors. For difficult samples, RNA input can be increased to 8.5 µL in the RT-PCR reaction by not adding any water. This may reveal increased inhibition (later Ct value compared to 2 µL input RNA) or low RNA level in the original sample (earlier Ct value when using 8.5 µL compared to 2 µL input RNA).
The LN34 assay does not differentiate between lyssaviruses or determine rabies virus variants. The LN34 assay amplicon can be sequenced for low-resolution rabies virus variant typing or identification of lyssavirus species11.
Disclosures
None to disclose
Acknowledgements
We acknowledge the efforts and collaboration of many rabies diagnostic testing laboratories who have contributed to the implementation, validation, and optimization of the LN34 assay through their open data sharing and feedback. Use of trade names and commercial sources is for identification only and does not imply endorsement by the Centers for Disease Control and Prevention, the U.S. Department of Health and Human Services, or the authors' affiliated institutions. The conclusions, findings, and opinions expressed by authors do not necessarily reflect the official position of the U.S. Department of Health and Human Services, the Centers for Disease Control and Prevention, or the authors' affiliated institutions.
Materials
| Name | Company | Catalog Number | Comments |
|---|---|---|---|
| 7500 Fast | Applied Biosystems | N/A | Do not substitute without validation |
| 7500 Fast Dx | Applied Biosystems | N/A | Do not substitute without validation |
| ABI ViiA 7 | Applied Biosystems | N/A | Do not substitute without validation |
| AgPath-ID One-Step RT-PCR Kit | ThermoFisher Scientific | AM1005 | Do not substitute without validation |
| Beadbug6 | Benchmark Scientific | D1036 | |
| Direct-zol RNA MiniPrep kit | Zymo Research | R2052 | |
| MagNA Lyser green beads | Roche | 3358941001 | |
| Microcentrifuge | Eppendorf | 5425 R | |
| Optical 96-well Reaction Plates | ThermoFisher Scientific | 4346907 | |
| Optical Adhesive covers | ThermoFisher Scientific | 4311971 | Alternative: caps |
| Polyester fiber-tipped applicator swabs | BD BBL Polyester Fiber Tipped Application Swab | 220690 | |
| QuantStudio 6Flex | Applied Biosystems | 4485691 | Do not substitute without validation |
| Quaternary ammonium disinfectant (1:256) | LYSOL | WBB56939 | Do not substitute without validation |
| RNase AWAY | ThermoFisher Scientific | 7002PK | |
| RNaseZap | ThermoFisher Scientific | AM9780 | |
| Single-use scalpel, a scalpel with a safety mechanism | Integra Miltex | 4-510 | |
| Sterile polyproylene microcentrifuge tubes (1.5 mL), nuclease free | Sarstedt | 72.692.405 | |
| Sterile polyproylene microcentrifuge tubes (2 mL), nuclease free | Sarstedt | 72.694.600 | |
| TRIzol Reagent | ThermoFisher Scientific | 15596026 | Do not substitute without validation |
References
- Meechan, P. J., Potts, J. Biosafety in Microbiological and Biomedical Laboratories. , Centers for Disease Control and Prevention. (2020).
- Terrestrial Manual 2023. , World Organization for Animal Health. At https://www.woah.org/en/what-we-do/standards/codes-and-manuals (2023).
- Laboratory Techniques in Rabies. Volume 1, World Health Organization. At https://iris.who.int/handle/10665/310836 (2018).
- Laboratory Techniques in Rabies. Volume 2, World Health Organization. At https://iris.who.int/bitstream/handle/10665/310837/9789241515306-eng.pdf?ua=1 (2019).
- Genevie, R., et al. Protocol for postmortem diagnosis of rabies in animals by direct fluorescent antibody testing: A minimum standard for rabies diagnosis in the United States. , At https://www.cdc.gov/rabies/pdf/RabiesDFASPv2.pdf (2003).
- World Health Organization. WHO Expert Consultation on Rabies: Third Report. , World Health Organization. Geneva. (2018).
- Gigante, C. M., et al. Multi-site evaluation of the LN34 pan-lyssavirus real-time RT-PCR assay for postmortem rabies diagnostics. PLoS One. 13 (5), e0197074(2018).
- Wadhwa, A., et al. A Pan-Lyssavirus Taqman Real-Time RT-PCR assay for the detection of highly variable rabies virus and other lyssaviruses. PLoS Negl Trop Dis. 11 (1), e0005258(2017).
- Gigante, C. M., Wicker, V., Wilkins, K., Seiders, M., Zhao, H., Patel, P., Orciari, L., Condori, R. E., Dettinger, L., Yager, P., Xia, D., Li, Y., et al. Optimization of pan-lyssavirus LN34 assay for streamlined rabies diagnostics by real-time RT-PCR. Journal Virological Methods. , In press (2024).
- Rao, A. K., et al. Use of a modified preexposure prophylaxis vaccination schedule to prevent human rabies: recommendations of the advisory committee on immunization practices-United States, 2022. Morbidity and Mortality Weekly Report. 71 (18), 619(2022).
- Condori, R. E., et al. Using the LN34 Pan-Lyssavirus Real-Time RT-PCR assay for rabies diagnosis and rapid genetic typing from formalin-fixed human brain tissue. Viruses. 12 (1), 120(2020).
Reprints and Permissions
