An erratum was issued for: Ferroptosis Induction in Glioma by Calceolarioside A via Modulation of the PI3K/Akt/Nrf2 Pathway. The Results section was updated.
Ferroptosis Induction in Glioma by Calceolarioside A via Modulation of the PI3K/Akt/Nrf2 Pathway
1 views
⸱
August 6th, 2026
In This Article
Summary
Abstract
This corrects the article 10.3791/69643
Protocol
An erratum was issued for: Ferroptosis Induction in Glioma by Calceolarioside A via Modulation of the PI3K/Akt/Nrf2 Pathway. The Figure 2 of Results section was updated from:

Figure 2: Ferroptosis inhibition in glioma cells. (A) DCFH-DA assay (5 µM DCFH-DA, 1 h incubation at 37 °C) showing intracellular ROS levels in U251 and U87 cells treated with 0, 20, and 50 µM CaA for 24 h; higher green fluorescence intensity indicates higher ROS levels. (B) Quantification of intracellular GSH levels in U251 and U87 cells treated with 0, 5, 20, and 50 µM CaA for 24 h. (C) Measurement of intracellular MDA content in U251 and U87 cells treated with 0, 5, 20, and 50 µM CaA for 24 h, reflecting lipid peroxidation levels. (D) FerroOrange assay (1 µM FerroOrange, 30 min incubation in serum-free medium at 37 °C) showing labile Fe2+ accumulation in U251 and U87 cells after treatment with 0, 20, and 50 µM CaA for 24 h; increased orange fluorescence indicates higher Fe2+ levels. (E) Western blot analysis of ferroptosis-related proteins (xCT, GPX4, FTH1, glutaminase) in U251 and U87 cells treated with 0, 5, 20, and 50 µM CaA for 24 h, with GAPDH as the internal control. Error bars represent SD of the mean. Data are presented as mean ± SD, with n = 3 technical replicates per group and experiments independently repeated three times. Statistical comparisons were performed using one-way ANOVA followed by Tukey's post hoc test. *P < 0.05; **P < 0.01. Scale bars = 50 µm (A,E). Please click here to view a larger version of this figure.
to:
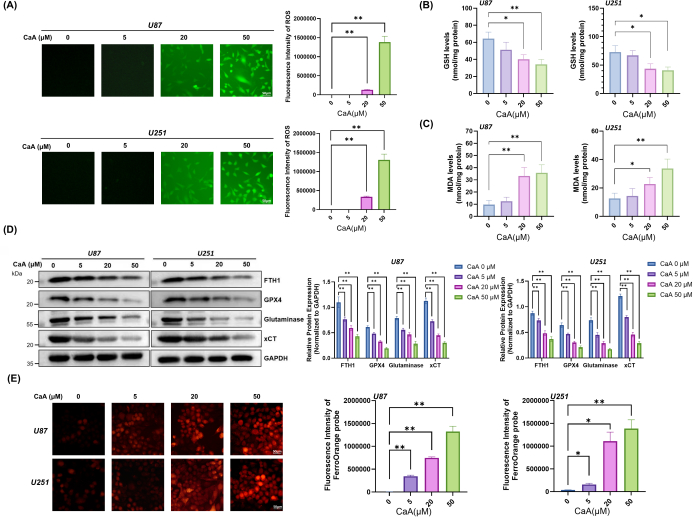
Figure 2: Ferroptosis inhibition in glioma cells. (A) DCFH-DA assay (5 µM DCFH-DA, 1 h incubation at 37 °C) showing intracellular ROS levels in U251 and U87 cells treated with 0, 20, and 50 µM CaA for 24 h; higher green fluorescence intensity indicates higher ROS levels. (B) Quantification of intracellular GSH levels in U251 and U87 cells treated with 0, 5, 20, and 50 µM CaA for 24 h. (C) Measurement of intracellular MDA content in U251 and U87 cells treated with 0, 5, 20, and 50 µM CaA for 24 h, reflecting lipid peroxidation levels. (D) FerroOrange assay (1 µM FerroOrange, 30 min incubation in serum-free medium at 37 °C) showing labile Fe2+ accumulation in U251 and U87 cells after treatment with 0, 20, and 50 µM CaA for 24 h; increased orange fluorescence indicates higher Fe2+ levels. (E) Western blot analysis of ferroptosis-related proteins (xCT, GPX4, FTH1, glutaminase) in U251 and U87 cells treated with 0, 5, 20, and 50 µM CaA for 24 h, with GAPDH as the internal control. Error bars represent SD of the mean. Data are presented as mean ± SD, with n = 3 technical replicates per group and experiments independently repeated three times. Statistical comparisons were performed using one-way ANOVA followed by Tukey's post hoc test. *P < 0.05; **P < 0.01. Scale bars = 50 µm (A,E). Please click here to view a larger version of this figure.
Disclosures
No conflicts of interest declared.