The block-building task provides a rapid, objective, quantitative measurement of how often individuals choose to use their left versus right hand for reach-to-grasp action. After unilateral peripheral nerve injury, patients often shift to near-total usage of one hand, the direction of which is not predictable from other clinical factors.
Research Article
Block Building Task Identifies Distinct Groups of Left/Right-hand Choice Patterns After Unilateral Peripheral Nerve Injury
In This Article
Summary
Abstract
Numerous methods exist to assess hand and arm function after upper extremity peripheral nerve injury, but peripheral injuries are often unilateral, and few existing methods are designed to capture the unique consequences of unilateral injury. Unilateral impairment of an upper extremity can lead to increased or decreased use of the dominant hand, and either change may be adaptive or maladaptive depending on the individual patient’s needs. To identify atypical hand usage (left/right choices), researchers and clinicians need to measure it. However, hand usage is traditionally assessed with self-report surveys, which do not necessarily reflect actual left/right-hand choices. Here, this gap in knowledge is addressed with the Block Building Task (BBT), which provides a rapid, quantitative, inexpensive assessment of left/right-hand choices in an unconstrained environment. In the BBT, participants build abstract shapes with interlocking plastic bricks, with no instructions about hand usage. The primary outcome is the fraction of reaches (i.e., for the initial pickup of each brick) made with each hand. After unilateral peripheral nerve injury, patients fell into three clusters: approximately typical hand use (44%), always use the dominant hand (44%), or never use the dominant hand (13%). Even among patients with an injured dominant hand, atypically elevated use of the dominant hand occurred regularly (36%). Notably, hand usage was not predicted by clinical characteristics, so the BBT provides an objective measurement of left/right-hand choices that are not otherwise predictable from the clinical characteristics of patients with peripheral nerve injury. The BBT protocol will be of interest to researchers or clinicians interested in the assessment of conditions with asymmetric effects on the upper limb.
Introduction
Peripheral nerve injuries to the upper extremity (PNI) are usually unilateral (82%-97%)1,2, but few effective methods exist for quantitative assessment of how unilateral injuries affect unconstrained goal-directed action choices—specifically, whether people choose to use their left or right hand during daily life.
Left/right-hand choices affect patient outcomes after PNI
Good patient outcomes are associated with continued use of the affected hand, whereas poor patient outcomes occur when the affected hand has preserved function but low usage3. More broadly, changes in hand usage (hand choices in unconstrained environments) can be adaptive or maladaptive: one patient might want to improve the function of their affected hand by increasing its use (i.e., practice), while another patient with chronic impairment might benefit from increased compensatory use of the unaffected hand. Such strategies need intentional clinician guidance; for example, in the case of patients who would benefit from compensating with the unaffected hand, such compensation will not happen naturally if the injured hand is the dominant hand (DH)4. Therefore, many patients with PNI would benefit from accurate assessment or tracking of their hand-choice behavior.
Current assessments are inadequate to quantitatively capture functional hand usage after PNI
Hand usage cannot be captured through standard measures of hand preference, hand function, or disability. Hand preference surveys such as the Edinburgh Handedness Inventory5 or Motor Activity Log6 address a fundamentally different concept (self-reported hand usage)7; moreover, preference surveys suffer from the limited accuracy inherent to self-report surveys8,9, have poorly established psychometric properties10, and their results may not generalize beyond the specific tasks listed in the survey11. Few clinical assessments of hand function can quantify hand usage because common assessments, such as the Fugl-Meyer12 and Box and Blocks13 measure dexterity rather than hand usage7 and focus on hand actions with only modest left-right asymmetry14. Standard patient-reported outcome assessments cannot identify the consequences of unilateral injury, for example, the Disabilities of the Arm, Shoulder, and Hand (DASH)1,15 and QuickDASH16 are designed to omit or minimize actions that depend strongly on hand dominance. Finally, while two established measures of hand usage exist, they both have shortcomings. The Quantification of Hand Preference Test (QHPT)17 allows quantitative measurement of reaching actions that may resemble everyday tasks, but it narrowly samples movement distances (all targets equidistant from participant) and avoids functional use of objects (participants pick up playing cards but do not use them for a game), which could limit the QHPT’s applicability to real-world scenarios. The Actual Amount of Use test involves real-world contextualized actions but does not provide numerical quantitative results because it involves only one sample per activity18. Therefore, measurement of left/right-hand use requires new and specific assessments.
The Block Building Task (BBT)4,19,20 provides a rapid, inexpensive, quantitative method to address this gap in measurement by assessing left/right-hand choices in an unconstrained goal-directed context, including in individuals with unilateral PNI. The BBT is suitable to characterize left/right-hand usage in any participants who have the ability to make reach-to-grasp actions and is ideally suited to characterize atypical hand usage after unilateral impairment – i.e., elevated use of one hand (and accompanying disuse of the other hand) compared to typical adults. The BBT is not in widespread use, especially in the clinical environment. The current manuscript addresses this gap by presenting a protocol for using the BBT to assess how often a participant uses each hand for unconstrained reach-to-grasp actions and also by presenting new results about the distribution and clustering of hand usage outcomes after unilateral PNI.
Protocol
This protocol was approved for human subjects' research by the Institutional Review Board of Washington University School of Medicine. All participants gave informed consent.
1. Equipment construction
NOTE: This process will produce the equipment shown in Figure 1 using the supplies listed in the Table of Materials.
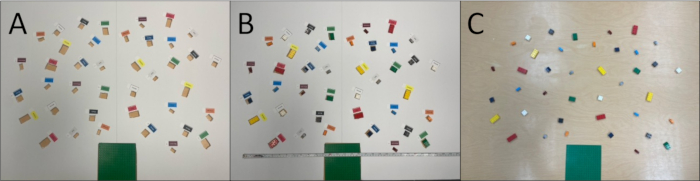
Figure 1: BBT equipment. The top-down view of the table is of the participant at the bottom and the experimenter at the top. To set up the study, tape down the green baseplate and then (A) place the posterboard on the table, (B) place bricks in posterboard cutouts (tape measure included for scale), and (C) remove the posterboard. Please click here to view a larger version of this figure.
- Build the 4 models shown in Figure 2, each using 1 of the 10 standard bricks listed in Table 1. In the end, 40 more bricks (plus spares) should remain in addition to those included in the models. Glue each model together so that the bricks will stay connected. Label each model with a number on the backside.

Figure 2: Suggested models. Sample models; the BBT is robust to changes in model design. (A) Front (participant-facing). (B) Back (experimenter-facing). Please click here to view a larger version of this figure.
| Color | Color (official) | Shape |
| White | White | 2x2 square |
| Black | Black | 2x2 square |
| Red | Red | 2x4 rectangle |
| Yellow | Bright Yellow | 2x4 rectangle |
| Orange | Orange | 1x2 rectangle |
| Blue | Dark Azure | 1x2 rectangle |
| Maroon | Dark Red | 1x2 with 45° slope |
| Ash | Medium Stone Gray | 1x2 with 45° slope |
| Green | Dark Green | 2x3 with arch |
| Navy | Dark Blue | 2x2 with 45° slope |
Table 1: Suggested bricks. Official colors are useful for purchasing but not recommended for experiment labeling because they are long and alphabetically ambiguous. See Table of Materials for product identifiers.
- Cut out a baseplate sized 5 inch/12.7 cm with a square notch at the center of a long side of the posterboard.
- Place the bricks on the posterboard at the suggested locations shown in Figure 1 and quantified in Figure 3 and Table 2.
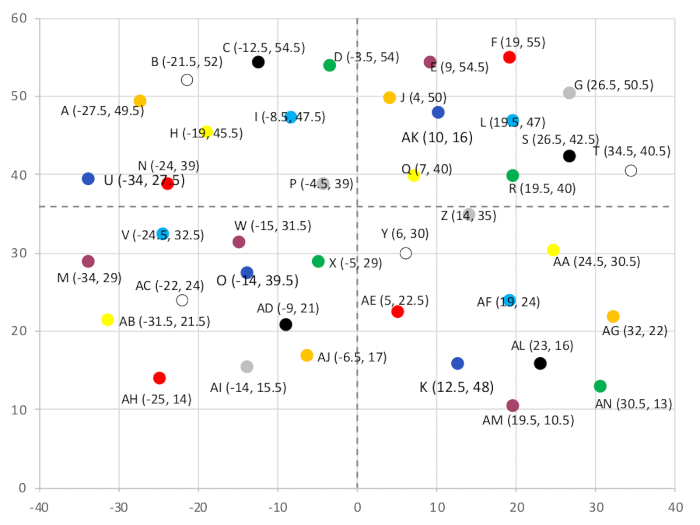
Figure 3: Schematic of posterboard with suggested brick locations. The BBT is robust to changes in brick locations and orientations. Dashed lines represent quadrants; each quadrant contains 1 brick. Precision = 0.5 cm; Letters = key for Table 2. For suggested orientations, see Figure 1. Please click here to view a larger version of this figure.
| Key | Quadrant | Color | X position (cm) | Y position (cm) |
| A | Far left | Orange | -27.5 | 49.5 |
| B | Far left | White | -21.5 | 52 |
| C | Far left | Black | -12.5 | 54.5 |
| D | Far left | Green | -3.5 | 54 |
| E | Far right | Maroon | 9 | 54.5 |
| F | Far right | Red | 19 | 55 |
| G | Far right | Ash | 26.5 | 50.5 |
| H | Far left | Yellow | -19 | 45.5 |
| I | Far left | Blue | -8.5 | 47.5 |
| J | Far right | Orange | 4 | 50 |
| K | Far right | Navy | 12.5 | 48 |
| L | Far right | Blue | 19.5 | 47 |
| M | Far left | Maroon | -34 | 29 |
| N | Far left | Red | -24 | 39 |
| O | Far left | Navy | -14 | 39.5 |
| P | Far left | Ash | -4.5 | 39 |
| Q | Far right | Yellow | 7 | 40 |
| R | Far right | Green | 19.5 | 40 |
| S | Far right | Black | 26.5 | 42.5 |
| T | Far right | White | 34.5 | 40.5 |
| U | Near left | Navy | -34 | 27.5 |
| V | Near left | Blue | -24.5 | 32.5 |
| W | Near left | Maroon | -15 | 31.5 |
| X | Near left | Green | -5 | 29 |
| Y | Near right | White | 6 | 30 |
| Z | Near right | Ash | 14 | 35 |
| AA | Near right | Yellow | 24.5 | 30.5 |
| AB | Near left | Yellow | -31.5 | 21.5 |
| AC | Near left | White | -22 | 24 |
| AD | Near left | Black | -9 | 21 |
| AE | Near right | Red | 5 | 22.5 |
| AF | Near right | Blue | 19 | 24 |
| AG | Near right | Orange | 32 | 22 |
| AH | Near left | Red | -25 | 14 |
| AI | Near left | Ash | -14 | 15.5 |
| AJ | Near left | Orange | -6.5 | 17 |
| AK | Near right | Navy | 10 | 16 |
| AL | Near right | Black | 23 | 16 |
| AM | Near right | Maroon | 19.5 | 10.5 |
| AN | Near right | Green | 30.5 | 13 |
Table 2: Suggested brick locations. This table contains the same information as Figure 3. It is listed row by row, then left to right. Quadrants are defined from the participant's point of view, with far/near divided at Y = 36 cm.
- On the poster board, use a pen or pencil to outline the location of each brick, leaving a border (~2 mm) around the brick. This outline will be cut out in step 1.6.
NOTE: The purpose of the border is so that, when the posterboard is removed, bricks will not get caught on the cutout edges. - Outside each outline, place a label that identifies the associated brick (e.g., Orange). Orient the label text so it can be read by an experimenter on the side opposite the baseplate.
- For asymmetrical bricks, add an arrow to the label to indicate a consistent orientation for the brick. This should not affect results but will make setting up easier.
- Cut out the rectangular outlines from the poster board. This will produce a posterboard containing 40 labeled outlines, one for each brick, as shown in Figure 1A.
2. Setting up the study before participant arrival
- Tape the baseplate down on one edge of the table.
- Place a chair without wheels in front of the base plate. Set posterboard on the table, with its notch over the baseplate.
- Place the appropriate brick into each cutout on the poster board. Then, remove the posterboard so only the bricks and baseplate remain (Figure 1C). Do not allow the participant to see the posterboard at any time before study completion.
- Choose the order of the 4 models (for research purposes, counterbalance or randomization). Place a stand (to hold the models) on the experimenter's side of the table.
- Position the stand where the camera can see the model without the model blocking the camera's view of hand activities.
- Position the camera with a clear view of the workspace, blocks, and hands, including ~20 cm above the baseplate for the building, with the participant's face out of view.
- Ensure the capacity to perform offline tallying from the video is available, or alternatively, have three experimenters ready to tally left and right reaches during the main task execution.
3. Main task
- Seat participant in the chair. Ensure bricks are visible on the table following step 2. Provide no other training or acclimatization.
- Ensure that the video does not include personally identifiable information by removing or covering any visible identifiers on the participant's body, e.g., providing a face mask and covering tattoos.
- Instruct participant: “We're going to ask you to build some shapes out of these bricks. Start by placing your hands next to the baseplate. I'll place a model at the front of the table. When I say Go, use the pieces on the table to build the model, including copying the colors. You'll build it on that green baseplate. We want you to do this as quickly and accurately as you can. The only things we ask are that you pick the pieces up, don't drag them across the table, and don't pick up pieces to save for later – just pick them up when you're ready to build with them.” (Demonstrate both if needed.) “When you finish building, put your hands on either side of the baseplate. Do you have any questions?”
- If the participant has questions, do not provide any information that is not in the script, but it is acceptable to clarify/repeat or rephrase the script information.
- Do not mention left/right or anything that might make the participant think they are required to use one hand over another.
- Tell the participant that the recording will start and do so.
- Place a model on the stand. Say "Go". Orient the model so the number label faces the experimenter. Wait for the participant to complete their model.
- Remove both models (the experimenter's glued model and the participant's just-built model) from the table.
- Return to Step 3.6 with a new model. Repeat until all 4 models are complete and the participant has used all 40 bricks from the table.
4. Contingencies during the main task
- If the participant omits a brick, wait until they finish the model and then say: "Does your model look like mine?". Wait for them to fix it.
- If the participant uses the same brick twice in a model, wait until they finish the model and then say: "Let me add another brick to make sure you'll have enough for later." Put a replacement dead center in the workspace.
- If the participant builds the model with the correct bricks but in the wrong places, say nothing and continue as normal.
- If a brick falls off the table, wait until they finish the model (unless the participant is currently working on the last model), then replace the fallen piece dead center in the workspace.
- If a participant moves a brick when they should not be moving (e.g., before saying Go), say: "Please wait until I say go." Stop the participant and put the bricks back in their approximate original locations.
- If a participant scoops bricks or repositions them without building, stop the participant, clarify the instructions, and put the bricks back in their approximate original locations.
5. Data collection and coding
- Data collection is best performed offline based on video recording, using event logging software (e.g., 26). If recording is impossible, ask coders to follow the below procedure live during the Main Task. For reliability, compare results from two or more coders and achieve a consensus, aiming for 100% agreement. In cases of disagreement, coders will discuss their assessments and reach a consensus through collaborative review.
- Ask the coders to review the video and count the number of times the participant makes a valid reach-to-grasp action (grasp for brevity) with each hand.
- Consider the following actions and invalid grasp:
- Picking up a brick without using a pincer grip, e.g., scooping or sliding a brick across the table.
- Picking up a brick that they had previously picked up. For example, if the participant picks up a brick and then puts it back down, do not count the next time they pick up that brick.
- Use the counts of valid grasps with each hand to calculate the fraction of dominant (or affected) hand grasps measured for each participant as
Number of valid grasps with hand of interest / total number of valid grasps - Perform additional analyses (e.g., time spent manipulating bricks with each hand) based on their scientific needs.
Results
Participant selection
Inclusion/exclusion criteria were: age of 18 years or older, English-speaking, unilateral upper extremity PNI (defined as non-pathologic origin, determined from medical records), and Quick Disabilities of the Arm, Shoulder, and Hand (Q-DASH)16 score ≥ 18, measured at the start of the study session. This threshold was chosen to select individuals whose life is affected by their impairment, at 1 minimum clinically important difference24 above 0. This threshold was designed to capture a wide range of patients with PNI because it also lies 1 SD below the mean of patients with upper extremity disorder25.
Exclusion criteria were: cognitive disorders, uncorrected visual impairment, chronic pain diagnoses, major mental health diagnosis (not including depression, anxiety, bipolar, or posttraumatic stress disorder), surgery within the preceding 2 months, or motor function diagnosis affecting the arm contralateral to their PNI in preceding 2 years. To examine the effects of injury severity, injuries of all types and severity levels were recruited within the above criteria.
In the current data, participants were 48 adults with unilateral PNI, recruited from the Washington University School of Medicine (St. Louis, MO) Center for Nerve Injury and Paralysis Injury Clinic and Milliken Hand Center outpatient hand therapy clinic. For the recruitment flowchart, see4. To compare patients with typical adults, data was used from a previous study using the same design with 20 additional participants (typical right-handed adults, age range 18-33 years, collected in 2013-2014 at the University of Lethbridge, Alberta, Canada)21. Data were stored and managed via the Research Electronic Data Capture system22.
The patients included 22 participants with PNI to their DH and 26 with PNI to their non-dominant hand (NDH). Full demographic details are listed in Table 3; no differences were found between groups (affected DH versus affected NDH), except that the affected DH group had a marginally higher time since injury (p = 0.050). Both groups underwent the same protocol.
| Variable | Total | DH affected | NDH affected | Between Groups | ||
| (n = 48) | (n = 22) | (n = 26) | ||||
| Mean/Count | Mean/Count | Mean/Count | t/χ2 | p | ||
| (%, SD, or Range) | (%, SD, or Range) | (%, SD, or Range) | ||||
| Age (years) | 44.42 ± 15.55 | 41 ± 15.5 | 43 ± 15.6 | -0.896 | 0.375 | |
| Sex = female (n) | 28 (58%) | 15(68%) | 13(50%) | 0.959 | 0.327 | |
| Race | White | 37 (77%) | 18 (81.8%) | 19 (73%) | 0.139 | 0.709 |
| Black/African American | 9 (19%) | 4 (18.2%) | 5 (19.3%) | 0.000 | 1.000 | |
| Native American | 3 (6%) | 1 (4.5%) | 2 (7.7%) | 0.000 | 1.000 | |
| Asian American/Pacific | 0 (0%) | 0 (0%) | 0 (0%) | 0.333 | 0.564 | |
| Other | 2 (4%) | 0 (0%) | 2 (7.7%) | 0.365 | 0.546 | |
| Education | Some high school | 2 (4%) | 0 (0%) | 2(7.7%) | 0.053 | 0.819 |
| High school or equivalent | 10 (21%) | 4(18%) | 6(23%) | 0.400 | 0.527 | |
| Some college | 16 (33%) | 9 (41%) | 7(27%) | 0.250 | 0.617 | |
| College + | 19 (39%) | 9(41%) | 10 (38.5%) | 0.053 | 0.819 | |
| Other | 1(2%) | 0(0%) | 1(4%) | 0.015 | 0.904 | |
| Affected hand = dominant (n) | 22 (45.8%) | 26 (54%) | – | – | ||
| Months since injury (median) | 11 (1-160) | 13 (4-47) | 9 (1-160) | -0.306 | 0.761 | |
| Recent injury related pain (0-10) | 3 (0-10) | 3 (0-8) | 3 (0 -10) | 0.226 | 0.822 | |
| Severity | Neurapraxia | 8 (17%) | 4 (8.33%) | 4 (8.33%) | 0.017 | 0.897 |
| Axonotmesis | 18 (38%) | 7 (14.6 %) | 11 (23%) | 0.889 | 0.346 | |
| Neurotmesis | 22 (46%) | 11 (23%) | 11 (23%) | 0 | 1 | |
| Affected nerve | Ulnar | 27 (56%) | 12 (54.5%) | 15 (57.6%) | 0 | 1 |
| Median | 33 (68.75%) | 15 (68%) | 18 (69%) | 0 | 1 | |
| Radial | 18 (37.5%) | 5 (23%) | 13 (50%) | 2.708 | 0.100 | |
| Posterior interosseous | 4 (8%) | 2 (9%) | 2(7.6%) | 0 | 1 | |
| Anterior interosseous | 3 (6%) | 1 (4.5%) | 2 (7.6%) | 0 | 1 | |
| Cutaneous | 7 (14.5%) | 4 (18.6%) | 3 (11.5%) | 0.057 | 0.811 | |
| Other | 11 (22%) | 7 (32%) | 4 (15%) | 1.010 | 0.315 | |
| Injury location | Brachial Plexus | 15 (31.3%) | 8 (36%) | 7 (27%) | 0.153 | 0.696 |
| Upper Arm | 7 (14.5%) | 4 (18%) | 3 (11.5%) | 0.057 | 0.811 | |
| Elbow | 11 (23%) | 6(27%) | 5(19%) | 0.100 | 0.752 | |
| Forearm | 15 (31%) | 9 (27%) | 6 (19%) | 1.031 | 0.310 | |
| Wrist | 22 (46%) | 8 (41%) | 14(23%) | 0.847 | 0.357 | |
| Hand | 6 (12.5%) | 3 (13%.6) | 3 (11.5%) | 0 | 1 | |
| Digit | 4(8%) | 2 (9%) | 2(7.6%) | 0 | 1 | |
| Injury cause | Trauma | 29 (60%) | 12 (54.5%) | 17 (65.4%) | 0.862 | 0.353 |
| Surgical complication | 9 (19%) | 5 (22.7%) | 4 (15.4%) | 0.111 | 0.739 | |
| Chronic compression | 7 (15%) | 4 (18.2 %) | 3 (11.5%) | 0.143 | 0.706 | |
| Other | 3 (6%) | 1 (4.55%) | 2 (7.7)% | 0.333 | 0.564 | |
Table 3: Patient demographics. Between-group differences assessed by t-tests for numerical data and x2 tests for categorical data. Surgery = for this injury. No participants identified as Hispanic and/or Latino.
Data analysis specific to the current report included identifying subgroups of participants through a cluster analysis of hand usage ratios. Data analysis was performed in MATLAB 23.2.0; cluster analysis was performed using the linkage function using the shortest Euclidian distance, and the results were visualized using the dendrogram function. In addition, to determine whether a demographic factor was associated with hand usage, categorical factors were tested with ANOVAs and quantitative factors through Spearman correlations. No multiple comparison correction was applied.
The primary outcome of the BBT is the fraction of dominant (or affected) hand grasps, measured for each participant as described in step 5.4:
number of grasps with the hand of interest / total number of grasps
The BBT reveals a distinct pattern of atypical hand usage after PNI, as shown in Figure 4. In the current data, healthy adults (data available for right-handers only) used their DH at a rate of 0.63 ± 0.14, which closely matches previous studies using the same design (0.64 ± 0.0721, 0.64 ± 0.0223). Among patients with unilateral PNI to the dominant hand, average hand usage remained indistinguishable from healthy adults: right-handers 0.59 ± 0.32 (n = 20, Mann Whitney U-test p = 0.70), all handedness 0.62 ± 0.3 (n = 22, p = 0.90); left-handers not analyzed statistically (n=2). Nevertheless, most individual patients showed atypical usage. To quantify this pattern, a cluster analysis was performed on all participants regardless of injury or hand dominance (n=68), producing the dendrogram shown in Figure 5.
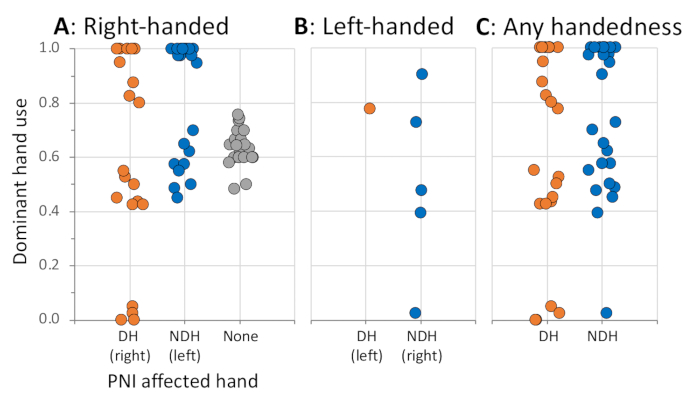
Figure 4: Hand usage with and without PNI. Each point represents 1 participant. At the group level, patients do not differ significantly from typical adults, but 57% of individual patients lie outside the typical range (0.4-0.875). Horizontal jitter was introduced to increase the visibility of individual points. Injured hand: DH = dominant hand, NDH = non-dominant hand, None = typical adult. (A) Right-handed patients (n=41) and typical adults (n=20). (B) Left-handed patients (n=7). (C) Patients of any handedness (n=61). Please click here to view a larger version of this figure.
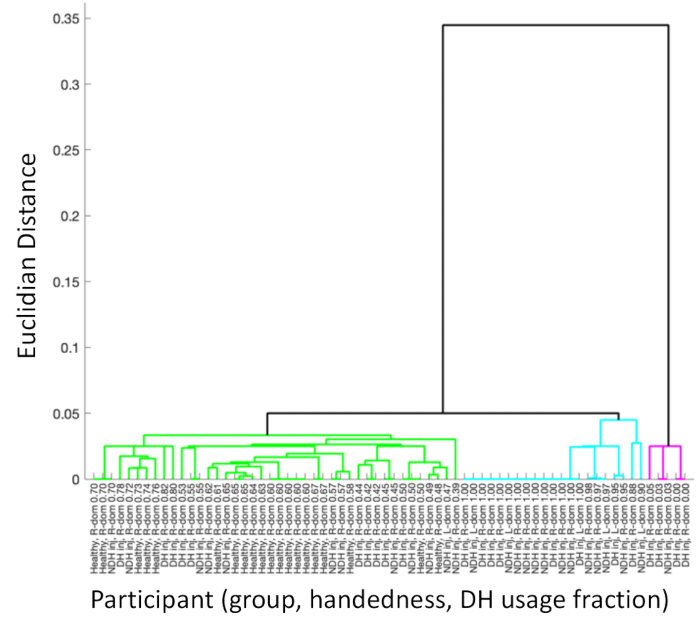
Figure 5: Clustering of hand usage among participants. The dendrogram shows three clusters of participants: typical DH usage (cyan), always DH usage (green), and never DH usage (magenta). Individual participants are labeled with a group (DH injured, NDH injured, or Healthy), handedness (R-dom, L-dom), and a fraction of DH use. Please click here to view a larger version of this figure.
This clustering identified three groups, with cutoffs of >0.100 and >0.875: patients who almost never use the DH (median 0.03); patients who almost always use the DH (median 1.00); and individuals who use the DH at a typical rate (median 0.60). Cluster cutoffs were identical if left-handers were excluded. Overall, most patients had atypical hand usage (27/47, 57%), but the hand usage cluster was not determined by whether the DH was injured, as shown in Figure 6. Specifically, some patients showed elevated use of the affected hand, including 8/22 patients with DH injury (36%). Therefore, individual patients' hand usage can be dramatically atypical, but the direction of atypicality cannot be predicted without individual measurement.

Figure 6: Relationship between individual characteristics and hand usage clusters. Some participants always use their DH despite DH injury or never use their DH despite NDH injury. Numbers = # of participants in each cluster. Please click here to view a larger version of this figure.
Hand usage among right-handed participants was not predicted by key clinical characteristics, including affected nerve, injury location, severity, months since surgery, or pain (p > 0.2 in all cases); for details, see Supplementary Table. The ANOVA included only right-handers due to the small sample of left-handers and differences between groups. Despite the lack of significant factors in the ANOVA, one factor did correlate significantly but partially with hand usage: preference shift, as measured by change in Edinburgh self-report (ρ = -0.594, p < .001). This pattern remained true when restricting the analysis to patients with DH injury for all the above characteristics (p ≥ 0.09, 0.170, 0.816, 0.978, 0.615, and .038, respectively). Overall, while self-reported hand usage was partially correlated with hand usage, atypical hand usage could not be well predicted from prior factors.
The BBT is rapid and reliable. Most participants complete the BBT in less than 3 min: time from first to last movement in healthy adults is 157 ± 33 s (range 99-291 s, median 152 s; data from 22); in patients with unilateral PNI, the time is 245 ± 141 s (range 120-919 s, median 217 s).
To measure external validity, a previous study compared BBT hand choices with Motor Activity Log (MAL) self-reported hand preferences6 in patients with unilateral PNI; these two measures were moderately correlated (r2 = 0.33)4, as appropriate for instruments that measure a similar construct with major differences in method; for example, the MAL measures self-reported use/disuse of the affected hand independent from the use of the unaffected hand. The BBT has good test-retest reliability (r = 0.838), even when the multiple tests have substantial differences in model design (comparing 10-brick models versus 5-brick models, all with normal-size bricks)23.
These results demonstrate the BBT's precision, speed, and validity and, accordingly, its ability to detect atypical patterns of hand usage that may not be otherwise evident in clinical characteristics.
Supplementary Table. Please click here to download this file.
Discussion
The Block Building Task (BBT) allows rapid, inexpensive, quantitative assessment of left/right-hand choices in an unconstrained goal-directed context. Therefore, the BBT provides a unique means to assess the left/right-hand usage patterns that are associated with patient outcomes after unilateral peripheral nerve injury (PNI)3. The novel results in the current manuscript (Figure 4, Figure 5, Figure 6) demonstrate that hand usage after unilateral PNI can be typical DH usage or an overwhelming shift to the DH or NDH – either of which is possible regardless of whether the injured side is DH or NDH. Hand usage could not be predicted by preexisting clinical variables, so direct measurement is necessary to identify atypical hand usage patterns that could identify what kind of training or rehabilitation might best benefit a patient.
Patients fall into three clusters
The BBT reveals that individual patients fall into three clusters with distinct responses to unilateral PNI: some continue approximately typical hand usage; some switch entirely to their DH or NDH – including a few individuals who switch to always using their injured hand. It remains unknown whether the approximately-typical patients have changed their hand usage from their pre-injury baseline, but 57% of patients fall into one of the clusters with atypical hand usage. Therefore, further research is needed to identify the effects of subtle shifts in hand usage (within the approximately-typical cluster), but patients who use only one hand are likely to have dramatic effects on their lives and activities.
Critically, clinical characteristics of injury did not predict hand usage. Neither injury side, location, severity, location, duration, or pain provided significant predictors of hand usage. Self-reported hand preference was correlated with actual hand usage, but while this correlation achieved statistical significance, it was partial: hand preference explained ≈ 23% of the variation in hand usage. This matches previous findings that hand usage is an independent construct7 that cannot be accurately predicted from self-report surveys11 or assessments of manual dexterity22. As a result, quantitative measurement of hand usage is necessary to identify how a patient has responded to DH impairment and thus determine whether intervention is required to encourage a usage-related outcome, such as increased performance of the hand that is used or a shift in the pattern of hand usage.
When hand usage shifts occur (i.e., into always using the affected or unaffected hand), they may represent a strategic choice wherein patients either avoid the injured side’s discomfort or limited function or self-rehabilitate through directed use of the injured side. However, these explanations are circular because it remains unknown why individual participants choose one strategy or the other. Future studies should identify the psychological or other factors that drive some patients to use or avoid their affected hand.
Individual shifts in hand usage often do not occur, and it remains unknown why such shifts are difficult to achieve. Certainly, patients often fail to shift their hand usage even when their NDH becomes more dexterous after injury, and handedness-shift interventions have mixed results27,28,29. The neural substrates of hand dominance are partly, but not wholly, based on practice29; and hand dominance also has a genetic component30,31. Nevertheless, some lines of research suggest that dominance retraining may be possible. In stroke patients with a paretic DH, preliminary data suggests that NDH performance training can lead to increased functional independence32. Among upper limb amputees, decades of DH loss (and thus forced use of the NDH) can be followed by NDH performance that approximates a healthy DH33. However, most of these studies have focused on hand performance rather than hand usage. Future studies may be able to clarify whether and how hand usage may shift across rehabilitation, including the possibility that neuromodulation might permit changes that do not typically occur through time and rehabilitation alone. Regardless, quantification of hand usage is useful even if it remains difficult to shift hand usage/preference because measurement of hand usage also allows the identification of individuals who might benefit from performance-based rehabilitation due to their existing atypical hand usage.
The block-building task
The primary outcome of the BBT (fraction of movements performed with the hand of interest) is easy to measure it represents a simple tally of left/right reaches. Nevertheless, video recording of the BBT is recommended to ensure accurate results, as is having at least 2 coders review the video and compare their tallies to achieve a consensus.
The BBT is robust to small changes in model choices, brick choices, and brick locations. This manuscript suggests bricks, models, and locations (Figure 2, Figure 3), but these should be taken as suggestions for ease of development, not a mandate. Alternative bricks and models should not affect the results as long as the bricks remain approximately the same sizes as the suggestions22, and the models are positioned where participants can clearly see the bricks and their relative positions. Brick location within the workspace also should not affect the results, so long as the bricks are evenly distributed across the workspace: in unpublished data, participants have completed multiple consecutive runs of the BBT using the same locations each time (i.e., different brick colors and shapes, but in the same locations), and they have never noticed that the locations repeat.
The BBT offers numerous advantages over existing tools to assess actual hand choices quantitatively. A few specialized research tools exist, but those alternatives restrict participant motions to a two-dimensional plane34,35, require expensive virtual reality equipment and specialized data analysis36, or limit actions to 3-5 target locations37,38,39. The Quantification of Hand Preference Test17 involves real-world reaching to pick up cards in 7 locations but is limited because all of its movements have the same distance, and object usage is non-functional (place cards in a box instead of using cards for a game). In contrast, the BBT requires participants to use their bricks to build a model, which places the reach-to-grasp actions within a goal-directed behavioral context. Goals, context, and upcoming actions influence reaching movements40 and their neural mechanisms41,42,43,44 – and between goal-directed and non-goal-directed actions, the former better reflects natural human reaching behavior because people generally reach to accomplish an external goal. For example, when a person reaches for their coffee mug, their goal is not to pick up the mug; their goal is to drink coffee.
The BBT has numerous limitations, even though few alternatives exist to rapidly quantitively measure hand usage. First, hand choices are task-specific, so BBT results may not generalize to other actions or environments. However, one previous study compared BBT results with a brick stacking task (similar design but with 750 g half-bricks, built into simple stacks instead of complex models); results in the two tasks were correlated (r2 = 0.64)3, suggesting that BBT results should apply beyond the specific context of reach actions with subsequent fine object manipulation. Second, BBT setup logistics require the bricks in fixed locations rather than participant-specific locations, so reach distance/effort depends on the participant's arm's length. However, the co-authors have never encountered a participant unable to reach all the bricks. Third, little is known about how left-handed typical adults perform at the BBT; left-handed participants were included in early studies19,45, but the only left-handers who have used the current design are patients. Fourth and finally, the BBT depends on unconstrained choices, so if the experimenter accidentally discloses that the BBT’s goal is to measure which hand(s) they use, that knowledge may lead to participant self-monitoring that could influence their results. Participant deception is inappropriate, but experimenters can use non-leading language such as: "This task will let us measure how you use your hands to build a simple figure."
Overall, the Block Building Task (BBT) fills an open niche in clinical and research assessment of patients with unilateral upper extremity impairment (e.g., PNI) by providing the first rapid, inexpensive, quantitative assessment of unconstrained goal-directed left/right-hand choices.
Disclosures
The authors have no conflicts of interest.
Acknowledgements
This work was funded by NIH/NINDS R01 NS114046 to BAP.
Materials
| Name | Company | Catalog Number | Comments |
|---|---|---|---|
| Baseplate | The Lego Group | 11023 | |
| Brick: 1x2 rectangle, dark azure | The Lego Group | 6004943 | 8 copies + spares; best acquired from brickowl.com |
| Brick: 1x2 rectangle, orange | The Lego Group | 4121739 | 8 copies + spares; best acquired from brickowl.com |
| Brick: 1x2 with 45° slope, dark red | The Lego Group | 4541526 | 8 copies + spares; best acquired from brickowl.com |
| Brick: 1x2 with 45° slope, medium stone gray | The Lego Group | 4211614 | 8 copies + spares; best acquired from brickowl.com |
| Brick: 2x2 square, black | The Lego Group | 30326 | 8 copies + spares; best acquired from brickowl.com |
| Brick: 2x2 square, white | The Lego Group | 300301 | 8 copies + spares; best acquired from brickowl.com |
| Brick: 2x2 with 45° slope, dark blue | The Lego Group | 4153653 | 8 copies + spares; best acquired from brickowl.com |
| Brick: 2x3 with arch, dark green | The Lego Group | 621528 | 8 copies + spares; best acquired from brickowl.com |
| Brick: 2x4 rectangle, red | The Lego Group | 300121 | 8 copies + spares; best acquired from brickowl.com |
| Brick: 2x4 rectangle, yellow | The Lego Group | 300124 | 8 copies + spares; best acquired from brickowl.com |
| Glue (Krazy Glue) | McKesson | EPIKG58548R | For gluing models together |
| Labels | Avery | 8195 | |
| Posterboard: Two Cool Tri-Fold Poster Board, 36 x 48", White/White | Geographics | GEO26790 | BBT will use an 80 x 60 cm workspace. Folding posterboards are recommended. |
| Stand | Adorox | KPL7_ADX_FBK | To support models during experiment |
References
- Philip, B. A., Kaskutas, V., Mackinnon, S. E. Impact of handedness on disability after unilateral upper extremity peripheral nerve disorder. HAND. 15 (3), 327-334 (2020).
- Ciaramitaro, P., et al. Traumatic peripheral nerve injuries: Epidemiological findings, neuropathic pain and quality of life in 158 patients. J Peripher Nerv Syst. 15 (2), 120-127 (2010).
- Kim, T., Lohse, K. R., Mackinnon, S. E., Philip, B. A. Patient outcomes after peripheral nerve injury depend on bimanual dexterity and preserved use of the affected hand. Neurorehabil Neural Repair. 38 (2), 134-147 (2024).
- Philip, B. A., Thompson, M. R., Baune, N. A., Hyde, M., Mackinnon, S. E. Failure to compensate: Patients with nerve injury use their injured dominant hand, even when their nondominant is more dexterous. Arch Phys Med Rehabil. 103 (5), 899-907 (2022).
- Oldfield, R. C. The assessment and analysis of handedness: The Edinburgh inventory. Neuropsychologia. 9 (1), 97-113 (1971).
- Uswatte, G., Taub, E., Morris, D., Light, K., Thompson, P. The motor activity log-28 assessing daily use of the hemiparetic arm after stroke. Neurology. 67 (7), 1189-1194 (2006).
- Dexheimer, B., Sainburg, R. L., Sharp, S., Philip, B. A. Roles of handedness and hemispheric lateralization: Implications for rehabilitation of the central and peripheral nervous systems: A rapid review. Am J Occup Ther. 78 (2), 7802180120(2024).
- Taylor, C., et al. Seven-day activity and self-report compared to a direct measure of physical activity. Am J Epidemiol. 120 (6), 818-824 (1984).
- Klesges, R. C., et al. The accuracy of self-reports of physical activity. Med Sci Sports Exerc. 22 (5), 690-697 (1990).
- Bazo, N. S., Marcori, A. J., Guimaraes, A. N., Teixeira, L. A., Okazaki, V. H. A. Inventories of human lateral preference: A systematic review. Percept Mot Skills. , (2023).
- Flindall, J. W., Gonzalez, C. L. Wait wait don't tell me: Handedness questionnaires do not predict hand preference for grasping. Laterality. 24 (2), 176-196 (2019).
- Fugl-Meyer, A. R., Jaasko, L., Leyman, I., Olsson, S., Steglind, S. The post-stroke hemiplegic patient. 1. a method for evaluation of physical performance. Scand J Rehabil Med. 7 (1), 13-31 (1975).
- Mathiowetz, V., Volland, G., Kashman, N., Weber, K. Adult norms for the box and block test of manual dexterity. Am J Occupation Ther. 39 (6), 386-391 (1985).
- Tretriluxana, J., Gordon, J., Winstein, C. J. Manual asymmetries in grasp pre-shaping and transport–grasp coordination. Exp Brain Res. 188 (2), 305-315 (2008).
- Hudak, P. L., et al. Development of an upper extremity outcome measure: The dash (disabilities of the arm, shoulder, and head). Am J Industrial Med. 29 (6), 602-608 (1996).
- Beaton, D. E., Wright, J. G., Katz, J. N., Group, U. E. C. Development of the quickdash: Comparison of three item-reduction approaches. J Bone Joint Surg Am. 87 (5), 1038-1046 (2005).
- Bishop, D. V., Ross, V. A., Daniels, M. S., Bright, P. The measurement of hand preference: A validation study comparing three groups of right-handers. Br J Psychol. 87 (Pt 2), 269-285 (1996).
- Chen, S., Wolf, S. L., Zhang, Q., Thompson, P. A., Winstein, C. J. Minimal detectable change of the actual amount of use test and the motor activity log. Neurorehabil Neural Repair. 26 (5), 507-514 (2012).
- Stone, K. D., Bryant, D. C., Gonzalez, C. L. Hand use for grasping in a bimanual task: Evidence for different roles. Exp Brain Res. 224 (3), 455-467 (2013).
- Gonzalez, C. L. R., Ganel, T., Goodale, M. A. Hemispheric specialization for the visual control of action is independent of handedness. J Neurophysiol. 95 (6), 3496-3501 (2006).
- Stone, K. D., Gonzalez, C. L. Manual preferences for visually- and haptically-guided grasping. Acta Psychol. 160, 1-10 (2015).
- Harris, P. A., et al. Research electronic data capture (redcap)—a metadata-driven methodology and workflow process for providing translational research informatics support. J Biomed Info. 42 (2), 377-381 (2009).
- Kim, T., et al. Healthy adults favor stable left/right hand choices over performance at an unconstrained reach-to-grasp task. Exp Brain Res. 242 (6), 1349-1359 (2024).
- Franchignoni, F., et al. Minimal clinically important difference of the disabilities of the arm, shoulder and hand outcome measure (dash) and its shortened version (quickdash). J Ortho Sports Phys Ther. 44 (1), 30-39 (2014).
- Gummesson, C., Ward, M. M., Atroshi, I. The shortened disabilities of the arm, shoulder and hand questionnaire (quickdash): Validity and reliability based on responses within the full-length dash. BMC Musculoskelet Disord. 7, 44(2006).
- Friard, O., Gamba Boris, M. A free, versatile open-source event-logging software for video/audio coding and live observations. Method Ecol Evol. 7 (11), 1325-1330 (2016).
- Luken, M., Yancosek, K. E. Effects of an occupational therapy hand dominance transfer intervention for soldiers with crossed hand-eye dominance. J Mot Behav. 49 (1), 78-87 (2017).
- Yancosek, K. E., Mullineaux, D. R. Stability of handwriting performance following injury-induced hand-dominance transfer in adults: A pilot study. J Rehabil Res Dev. 48 (1), 59-68 (2011).
- Marcori, A. J., Monteiro, P. H. M., Okazaki, V. H. A. Changing handedness: What can we learn from preference shift studies. Neurosci Biobehav Rev. 107, 313-319 (2019).
- Sha, Z., et al. Handedness and its genetic influences are associated with structural asymmetries of the cerebral cortex in 31,864 individuals. Proc Natl Acad Sci U S A. 118 (47), e2113095118(2021).
- Mcmanus, I. C., Davison, A., Armour, J. A. Multilocus genetic models of handedness closely resemble single-locus models in explaining family data and are compatible with genome-wide association studies. Ann N Y Acad Sci. 1288, 48-58 (2013).
- Sainburg, R. L., Maenza, C., Winstein, C., Good, D. Progress in Motor Control. , Springer. 257-272 (2016).
- Philip, B. A., Frey, S. H. Compensatory changes accompanying chronic forced use of the nondominant hand by unilateral amputees. J Neurosci. 34 (10), 3622-3631 (2014).
- Liang, J., Wilkinson, K. M., Sainburg, R. L. Cognitive-perceptual load modulates hand selection in left-handers to a greater extent than in right-handers. Exp Brain Res. 237 (2), 389-399 (2018).
- Przybyla, A., Coelho, C. J., Akpinar, S., Kirazci, S., Sainburg, R. L. Sensorimotor performance asymmetries predict hand selection. Neuroscience. 228, 349-360 (2013).
- Buxbaum, L. J., Dawson, A. M., Linsley, D. Reliability and validity of the virtual reality lateralized attention test in assessing hemispatial neglect in right-hemisphere stroke. Neuropsychology. 26 (4), 430(2012).
- Bryden, P. J., Mayer, M., Roy, E. A. Influences of task complexity, object location, and object type on hand selection in reaching in left and right-handed children and adults. Dev Psychobiol. 53 (1), 47-58 (2011).
- Leconte, P., Fagard, J. Which factors affect hand selection in children's grasping in hemispace? Combined effects of task demand and motor dominance. Brain Cogn. 60 (1), 88-93 (2006).
- Mamolo, C. M., Roy, E. A., Bryden, P. J., Rohr, L. E. The effects of skill demands and object position on the distribution of preferred hand reaches. Brain Cogn. 55 (2), 349-351 (2004).
- Johnson-Frey, S., Mccarty, M., Keen, R. Reaching beyond spatial perception: Effects of intended future actions on visually guided prehension. Visual Cognition. 11 (2-3), 371-399 (2004).
- Gallivan, J. P., Johnsrude, I. S., Flanagan, J. R. Planning ahead: Object-directed sequential actions decoded from human frontoparietal and occipitotemporal networks. Cereb Cortex. 26 (2), 708-730 (2015).
- Watson, P., Van Wingen, G., De Wit, S. Conflicted between goal-directed and habitual control, an fMRI investigation. eneuro. , (2018).
- Rosell-Negre, P., et al. Reward contingencies improve goal-directed behavior by enhancing posterior brain attentional regions and increasing corticostriatal connectivity in cocaine addicts. PloS One. 11 (12), e0167400(2016).
- Baldauf, D., Cui, H., Andersen, R. A. The posterior parietal cortex encodes in parallel both goals for double-reach sequences. J Neurosci. 28 (40), 10081-10089 (2008).
- Gonzalez, C. L., Whitwell, R. L., Morrissey, B., Ganel, T., Goodale, M. A. Left handedness does not extend to visually guided precision grasping. Exp Brain Res. 182 (2), 275-279 (2007).
Reprints and Permissions
