Right heart failure (RHF) is characterized by right-sided cardiac dilation and hypertrophy, leading to ventricular and atrial malfunction. Cardiopulmonary conditions associated with RHF are accompanied by an increased risk for cardiac arrhythmias. This article describes a standardized model of pulmonary artery banding-induced RHF associated with enhanced ventricular and atrial arrhythmogenesis.
Method Article
Rat Model of Right-Sided Cardiac Remodeling and Arrhythmia Using Pulmonary Artery Banding
In This Article
Summary
Abstract
Clinical conditions, including chronic obstructive pulmonary disease or pulmonary arterial hypertension (PAH), can lead to chronic right ventricle pressure overload and progressive right heart failure (RHF). RHF can be identified by right-sided cardiac hypertrophy and dilation associated with abnormal myocardial function affecting the RV and the right atrium (RA). We recently demonstrated that severe RHF is accompanied by an increased risk of atrial inflammation, atrial fibrosis, and atrial fibrillation (AF), the most common type of cardiac arrhythmia (CA). Recent studies have shown that RV and RA inflammation plays an important role in the arrhythmogenesis of CA, including AF. However, the impact of inflammation in the development of CA and AF in RHF is poorly described.
Experimental models of RHF are required to better understand the association between right-sided myocardial inflammation and CA. The rat model of monocrotaline (MCT)-induced pulmonary hypertension (PH) is well-established to provoke RHF. However, MCT triggers severe pneumo-toxicity and pulmonary inflammation. Hence, MCT-induced RHF does not help to distinguish whether the subsequent myocardial inflammation originates from the RHF per se or circulating inflammatory signals secreted by the injured lung.
In this article, a mechanical method involving pulmonary artery trunk banding (PAB) was used to provoke right-sided cardiac arrhythmogenesis. The PAB consists of performing a permanent suture of the pulmonary artery trunk for 3 weeks. Such an approach generates increased right-sided pressure overload. At D21 post-PAB, the suture results in hypertrophied, dilated, and inflamed RV and RA. The PAB-induced RHF is also accompanied by vulnerability to ventricular and atrial arrhythmias, including AF.
Introduction
Right heart failure (RHF) is characterized by right ventricular (RV) and atrial (RA) hypertrophy and dilation, leading to right-sided cardiac malfunction in response to chronic RV pressure overload due to the constriction of the pulmonary arteries (PA)1. Hence, conditions provoking the narrowing of PA can be responsible for an increased risk of RHF1,2,3,4. Clinical data revealed that RHF is the major cause of hospitalization (56%) in patients with PA hypertension (PAH)2. Clinical studies have shown that independent of the cause of PAH, including thromboembolic pulmonary hypertension (PH) and idiopathic PAH, patients are often affected by RHF and are 20% more susceptible to developing cardiac arrhythmias including supraventricular tachyarrhythmias and atrial fibrillation (AF)2,5,6.
To better understand the association between PAH and RHF, animal studies, including the model of a single dose of monocrotaline (MCT), have been used to provoke severe lung inflammation and RHF7,8. We recently observed that MCT-induced RHF was associated with RA inflammation and AF9. However, due to the importance of MCT-induced pulmonary inflammation and circulating cytokines, it was difficult to describe whether MCT-induced RA inflammation is a consequence of RHF only9. Hence, a new model of RHF-induced cardiac arrhythmia was required to study the RA inflammatory status.
The PA trunk banding (PAB) experimental model has been used in various animal species to mimic obstructive PA diseases and to study the associated pathological cardiac remodeling affecting the right side of the heart10. PAB has been reported as an effective method to induce right RV dysfunction and failure in various studies mimicking RV overload10,11,12,13,14,15,16. Technically, PAB is the placement of a permanent suture on the PA trunk, provoking a mechanical reduction of the PA trunk diameter10. PAB generates an increased pressure overload to the RV10. First, as a compensatory adaptation to the sudden increase in RV afterload, the RV cavity is dilated, leading to chronic RV hypertrophy10,13. RV dilation and hypertrophy affect the tricuspid valves, which become leaky13. More precisely, the pronounced dilation of the RV combined with high RV afterload has the effect of stretching the tricuspid valve annulus located between the RV and the RA13,17. Due to the incomplete occlusion of the valve, a portion of the blood ejected from the RV during systole will be directed toward the RA cavity17. Leakage of the tricuspid valve can be observed through echocardiography and is called tricuspid regurgitation17. Then, the RA receives inappropriately high blood pressure, contributing to increased RA dilation and hypertrophy13. The chronic RV and RA remodeling are accompanied by local myocardial inflammatory reactions leading to RV and RA fibrosis and loss of function9,13. Cardiac fibrosis is characterized by the development of low-voltage zones that are less contractile and more susceptible to provoking conduction block and re-entry circuits involved in the development of cardiac arrhythmias, including ventricular fibrillation and AF18,19.
The originality of this paper resides in the utilization of a standardized method of PAB-induced right-sided cardiac remodeling to provoke and study cardiac arrhythmias inducibility in 3 weeks post-PAB. The main advantages of this surgical approach are: i) the direct control over the reduction of the PA trunk diameter and ii) the avoidance of pulmonary inflammation to focus on RHF-induced myocardial inflammation to study cardiac arrhythmias, including AF.
The approach described here involves a precise microsurgical procedure to create the PAB, assessment of increased RV afterload, echocardiography to observe PAB-induced myocardial structural and functional remodeling, and electrophysiological study to evaluate vulnerability to cardiac arrhythmias, including AF.
Protocol
All procedures described below were approved by the Montreal Heart Institute ethics committee (protocol numbers: 2021-2938-2021-47-01 and 2024-3412-2024-48-01) and strictly followed the Canadian Council on Animal Care (CCAC) guidelines. Male Wistar rats (225-275 g) aged 6-8 weeks were used for the procedures. All animals were housed in the animal care facility of the Montreal Heart Institute, with free access to water and food.
1. Preoperative preparation
- Sterilize all surgical instruments and materials before surgery using an autoclave of high-pressurized saturated steam at temperatures between 121 °C and 134 °C under 15-30 psi for 30-40 min followed by a drying cycle of 25 min.
- Prepare all volumes of drugs required for the surgery. Use a multimodal analgesic approach involving buprenorphine (0.05 mg/kg) and ketoprofen (5 mg/kg) injected subcutaneously 30 min before surgery and repeated at 6 h (buprenorphine) and 24 h post-surgery (buprenorphine and ketoprofen). In addition, perform a local analgesia at the incision site (lidocaine 5 mg/mL).
- Perform a baseline transthoracic echocardiography before the surgery (see detailed procedure for transthoracic echocardiography in steps 6.1-6.13.) to determine the PA diameter and select the appropriate gauge needle that will be used as a lead to generate the expected 60% reduction of the PA diameter during PAB.
NOTE: In this paper, male Wistar rats of 225-275 g were used, and the utilization of a 19 G needle was appropriate to generate such a 60% reduction of the PA diameter. - Prepare a 19 G needle (or the appropriate caliber as determined in step 1.3) that will be used as a lead (see below: steps 4.18 and 4.19) to obtain an optimal PA trunk constriction, provoking severe remodeling of the rat heart. Using a forceps, bend the 19 G to 90-110° (Figure 1A).
NOTE: Bending the 19 G facilitates i) the positioning near the PA trunk and ii) the application of the ligation during the procedure. The 19 G is used as a lead around which the suture will be installed to reduce the diameter of the PA to 1.0 mm (60 % reduction for rats weighing 225-275 g), which induces a significant RV pressure overload responsible for severe RV remodeling in 3 weeks.
2. Induction of anesthesia and animal preparation
NOTE: Analyses were performed on male Wistar rats (225-275 g) aged 6-8 weeks. Use a heating pad during all steps of the following procedures to keep the animal's body temperature around 37 °C. Apply a rectal probe to monitor the body temperature.
- Anesthetize the animal with continuously inhaled isoflurane 3% and 100% oxygen 2-3 L/min.
- Apply eye lubricating gel to protect the cornea from desiccation.
- Verify the level of anesthesia using the toe pinch reflex.
3. Intubation
NOTE: Intubation was performed as previously described20.
- Transfer the animal to an inclined intubation station in a supine position. Hold the rat by the upper incisors using a loop of thread to maintain the body in a suspended position at 45° to obtain a better visualization of the throat.
- Direct a flexible light source to the neck surface to transilluminate through the pharyngoepiglottic region.
- Extend the tongue using a cotton swab and stabilize it on the maxilla with a curved weighing spatula as a tongue depressor.
- Visualize the trachea and the vocal cords.
- Use a 16 G angiocatheter to perform the intubation. Use the catheter as a tracheal tube, and blunt the beveled-tip needle to use as an introducer.
- Advance the endotracheal tube (16 G angiocatheter) mounted on the introducer (beveled-tip needle) into the trachea, and once positioned, remove the introducer (Figure 1B).
- Confirm the correct position of the tube by observing a normal breathing pattern (about 80 breaths/min for rats weighting 225 g and about 70 breaths/min for rats weighting 275 g) and the presence of mist on the surface of the metal spatula (or small mirror) when placed at the flange of the canula's hub.
- Once correctly intubated, rapidly transfer the animal to the surgical station supine over a homeothermic heating pad.
- Adjust the ventilator's tidal volume and rate according to the body weight of the rat. Rats around 225-275 g receive a tidal volume of 2.0-2.5 mL and 70-80 breaths/min with the ventilator.
- Connect the endotracheal tube to the ventilator to initiate mechanical ventilation. Place the outflow tip of the ventilator into a water cylinder. The air bubbles coming out of the outflow after each breathing indicate a successful intubation.
- Once steady breathing is established, secure the endotracheal tube with surgical tape and fix the rectal probe along the tail to monitor the body temperature.
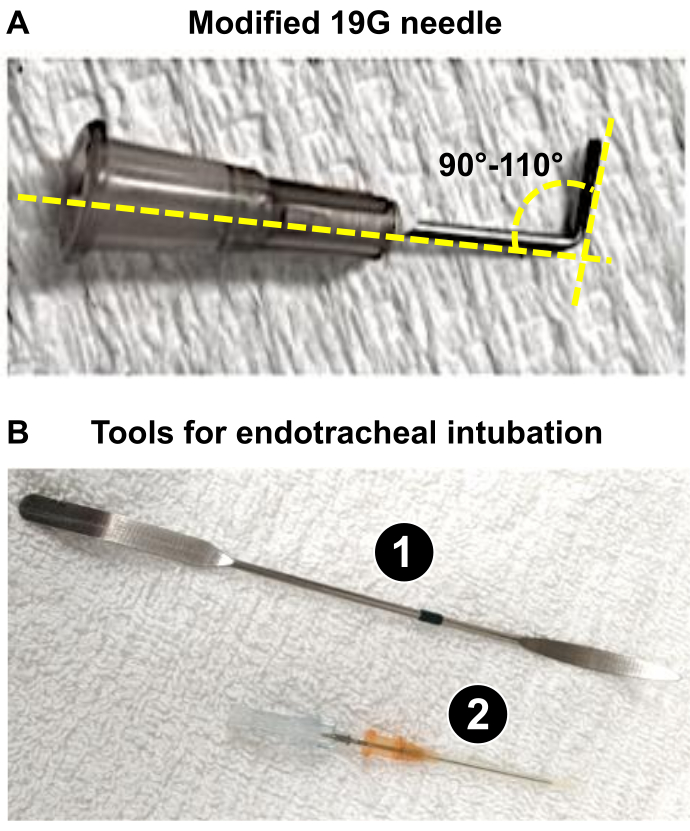
Figure 1: Key instruments required for the preparation of the microsurgical procedure of PAB. (A) Modified 19 G needle used as a lead to obtain a 1 mm diameter of the PA trunk after PAB. (B) Endotracheal tools used or successful intubation of rats. 1. The spatula is used as a tongue depressor on anesthetized rats to expose the trachea. 2. The 16G catheter acts as an endotracheal tube after blunting the tip of its stylus. Please click here to view a larger version of this figure.
4. PAB surgery (Figure 2)
NOTE: All procedures must be performed according to strict aseptic surgery techniques.
- Shave the left side of the thorax using a clipper and depilatory cream and prepare the skin with applications of 2% chlorhexidine followed by 70% alcohol scrubs (repeated three times).
- Immobilize the forelimbs in an open position with medical tape, taking care not to overextend the limbs to avoid affecting breathing.
- Pull the right hind limb slightly downward and fix it along the tail.
- Extend and adduct the left hind limb and fix it to the right side of the animal to generate a slight right lateral position, exposing the left side of the chest.
- Use sterile gloves at this step for the remaining part of the surgery.
- Position a sterile drape over the animal and make a 2-3 cm skin incision on the left side of the thorax, starting about 2 cm above the xiphoid process and oriented diagonally toward the base of the rat's left forelimb.
- Under the skin, separate the pectoral muscles subsequently (pectoralis minor and major) and move them aside by blunt dissection using round-tip scissors. Use magnetic retractors to hold the muscles, to allow for proper visualization of the rib cage located underneath.
- De-inflate the lungs by removing the outflow tube (connected to the ventilator) from the water cylinder (see step 3.10). Removal of the outflow tube from the water lowers the pressure into the lungs, which generates the de-inflation of the lobes.
- Perform a left-side thoracotomy with curved dissecting forceps. Pierce a small hole in the mid-clavicular line of the muscle located between the 3rd and 4th ribs.
- Introduce the curved forceps into the opening and slide it along the left interior wall of the muscle between the two ribs to slightly lift the left chest wall and avoid touching the lungs while cutting the muscle.
- Use the introduced forceps as a guide and make an incision longitudinally to the ribs on approximately 1 cm with iris scissors. Maintain the left chest wall lifted and manipulate the scissors cautiously to avoid damaging the left lung lobes directly underneath.
- Expand the intercostal incision to 1-2 cm to the left of the animal using round-tip scissors.
- Reposition the retractors under the ribs to keep the wound open.
- Observe the inferior part of the thymus and a portion of the left lobe of the lung.
- Push aside the thymus and the lungs at this level, given the significant space occupied by these organs. Separate the thymus lobes using blunt dissection with forceps and hold the lung on the left side using wet gauze. Then, expose the upper portion of the heart, the left atrium (LA) as well as the pulmonary trunk, and the aortic arch.
- Carefully blunt dissect the thin layer of pericardium covering the heart in this area, along with any attached adipose tissue, to help locate the portion where the aorta and the pulmonary trunk are still attached. Minimally dissect the pericardium and avoid touching the pleural membrane.
- Insert the curved forceps in a closed position in the space between the LA appendage and the pulmonary trunk, in the middle of the visible portion of the vessel, to reach the other side of the vessel (Figure 2A).
CAUTION: Avoid working too close to the aortic root of the heart to prevent the risk of vessel rupture and hemorrhage. - Visualize the tip of the forceps through the conjunctive membrane cranially to the pulmonary trunk. Use the second forceps to dissect over the tip and carefully pierce the membrane to create a small opening. The curved forceps positioned under the pulmonary trunk are then slightly opened in order to grab a 5-0 Silk thread. Retract the forceps to bring the thread from one side to the other of the pulmonary trunk (Figure 2B, C).
- Perform the constriction of the pulmonary trunk. Firstly, practice a loose double knot of the 5-0 Silk close to the artery. Insert the 19 G needle along the vessel and under the thread. Tight this first knot and fix it with a second simple knot before removing the 19 G (Figure 2D).
CAUTION: Work rapidly and carefully to minimize the duration of the complete obstruction of the pulmonary trunk. - Perform a last simple knot and cut the remaining 5-0 Silk thread around 0.5-1 cm from the knot (Figure 2D).
- Reposition the thymus lobes and remove the chest retractors.
- Re-inflate the lungs by pinching off the outflow of the ventilator for 2 s.
- Close the rib cage by performing a cross-stitch pattern with a synthetic absorbable 5-0 suture thread.
- Apply a few drops of 0.9% saline over the wound area and compress each side of the chest wall to remove air bubbles and to re-establish the thoracic negative pressure.
- Reposition the pectoral muscles and wipe off the remaining saline with a sterile gauze.
- Use a syringe to apply a splash block of lidocaine on the surface and surrounding area of the wound.
- Close the skin using a synthetic absorbable 5-0 suture thread with needle in a continuous subcuticular pattern.
NOTE: Sham rats receive the same procedure without steps 4.18 and 4.19.

Figure 2: PAB procedure and validation of 5.0 Silk suture versus metal clips. Photography of the step-by-step isolation and ligation of the PA trunk, showing (A) the exposition and isolation of the PA trunk, (B) the positioning of the suture (5.0 silk) around the PA trunk, (C) the ligation of the PA (PAB) (using a 19 G needle as a lead); (D) the verification of the heart motion and PA-root and RV overload following PAB; (E) a comparison of PAB performed with silk suture versus a metal clip; and (F) the validation of the choice of silk suture for PAB to create more reproducible diameter of 1 mm around the PA trunk. Please click here to view a larger version of this figure.
5. Post-operative recovery
- Remove the isoflurane while maintaining the rat under mechanical ventilation with oxygen flow only. Turn the rat on its right side or ventral to facilitate breathing.
- Inject a volume of 0.9% saline subcutaneously into the dorsal neck region to promote fluid recovery (calculated as 10 mL/kg/h of anesthesia).
- Once autonomous breathing is confirmed, smoothly remove the endotracheal tube.
- Observe when the rat starts to move by itself and transfer the animal from the heating pad to a new sterile cage for recovery. Provide water and wet food ad libitum.
- During the post-operative period (4-6 h), place the cage over a heating pad (half of the cage) to help maintain body temperature and closely monitor the animal.
- Promptly manage any signs of pain, breathing difficulty, or abnormal behavior.
- In post-operative care, 6 h after the surgery, inject a second dose of 0.05 mg/kg buprenorphine. On the next day, 24 h after the surgery, inject a third dose of 0.05 mg/kg buprenorphine and a second dose of 5 mg/kg ketoprofen.
- Monitor the rats until their complete health recovery.
6. Transthoracic echocardiography
NOTE: This paper shows data obtained on the 21st day post-surgery, when the rats were subjected to transthoracic echocardiography. However, depending on the research objectives and the requirements of the study design, researchers can define other time points for pre- and post-PAB transthoracic echocardiography.
- Perform a baseline transthoracic echocardiography before the surgery to determine the PA diameter and to select the appropriate gauge needle used as a lead to generate the expected 60% reduction of the PA diameter during PAB.
NOTE: In this study, male Wistar rats of 225-275 g were used and the utilization of a 19 G needle was appropriate to generate such a 60% reduction of the PA diameter. - Weigh and anesthetize the rats with continuously inhaled isoflurane (3% and 2 L/min O2).
- Perform transthoracic echocardiography on each animal using a 12S sector/multi-element probe (4.5-11.5 MHz) and an image-acquisition system.
- Use color mapping in a two-dimensional (2D) parasternal short-axis view by positioning the 12S probe at the level of the aortic valve. Click on the Color Doppler button on the echo machine to visualize the blood flow pattern crossing the pulmonary artery banding (PAB) area in the pulmonary trunk.
- Perform continuous wave Doppler (CW) by crossing the PAB guided by color mapping in the 2D parasternal short-axis view to record the properties of the blood flow crossing the PAB area, including the peak velocity (cm/s) and the mean pressure gradient (mmHg). To obtain the Doppler curves, adjust the sample volume at the level of pulmonary artery banding.
- Apply a 2D apical 4-chamber view by positioning the 12S probe at the level of the apex of the heart to demonstrate the enlargement of the RA and RV following the surgery and determine the RA horizontal dimension at the end cardiac systole (RADs) expressed in millimeters (mm).
- Apply color mapping in 2D apical 4-chamber view to reveal tricuspid regurgitation due to PAB by acquiring cine-loops on the echo machine.
- Perform M-Mode echocardiography in apical 4-chamber view by crossing the conjunction of the tricuspid annulus and RV lateral wall to study the tricuspid annulus plane systolic excursion (TAPSE) expressed in mm.
- Use Tissue Doppler Imaging (TDI) in the apical 4-chamber view at the level of the conjunction of the tricuspid annulus and RV lateral wall for the measurement of the RV lateral wall systolic contractility (Sr) expressed in centimeters per second (cm/s) to evaluate RV systolic performance.
- Record diastolic trans-tricuspid flow (TTF) using pulsed wave Doppler in the apical 4-chamber view to study RV diastolic properties, including peak velocity in the early filling (E) wave, atrial filling (A) wave, and the ratio of E/A in TTF.
- Perform M-Mode echocardiography in the parasternal long-axis view at the level of the aortic valve to measure the RV outflow tract at the end of cardiac diastole (RVOT, expressed in millimeters) and the left atrium dimension at the end of cardiac systole (LADs, expressed in millimeters).
- Perform 2D M-Mode echocardiography in parasternal short-axis view at the level of papillary muscles to assess LV dimensions at end-systole and diastole (LVDs and LVDd); and LV anterior wall thickness at end-diastole (LVAWd), all expressed in millimeters.
- Perform 2D M-mode in short-axis parasternal view to determine LV fractional shortening (LVFS, expressed in percent) and LV ejection fraction (LVEF, expressed in percent).
7. Electrophysiological study (Figure 3)
- Maintain the rats under anesthesia after in vivo echocardiography for in vivo transesophageal electrophysiological study (EPS).
- Insert the ECG electrodes under the skin of the rats (1 near the left forelimb, 1 near the right hind limb, and 1 near the left hind limb).
- Gently introduce a 4F-quadripolar catheter with an inter-pole distance of 5 mm into the esophagus (Figure 3A).
- Adjust the transesophageal catheter position close to the RA by precisely determining when the P wave, which represents atrial contractions on surface ECG, matches with the P wave obtained with the transesophageal catheter's ECG (Figure 3A, B).
- Determine the stimulation threshold for each animal. This threshold is the minimum voltage at which the stimulator directly influences the heart rate.
- Evaluate AF vulnerability by applying a voltage burst equivalent to 4-times the threshold voltage following a protocol of 3 sets of 12 stimulation bursts, each lasting 3 s at 50 Hz, followed by 2 s of rest (1 min/set). Between each set, the rats had a 1-min resting period9,13,21.
- Identify and quantify, after each burst, the occurrence of cardiac tachyarrhythmias, including AF or atrial flutter.
NOTE: AF is defined as irregular and ultrarapid atrial beats (>800 bpm). Atrial flutter is defined as a regular but rapid atrial rhythm associated with an absence of the P wave or the presence of a regular pattern of multiple P waves between regularly consecutive R-R intervals. Only arrhythmic episodes lasting more than 1 s are considered. - Avoid interrupting ongoing episodes of AF or atrial flutter by stopping the next set of stimulations if the sinus rhythm is not recovered on its own within the resting period between two consecutive stimulations.

Figure 3: Illustration of heartbeats at rest and the appropriate position of a transesophageal catheter for in vivo electrophysiological study. (A) Representative ECG of two consecutive heartbeats at rest showing the P-wave, the PR interval, the QRS complex, the QT interval, and the R-R interval. (B) Schematic of a longitudinal section of the heart (1) and the esophagus (2) in which a quadripolar catheter (3) is introduced to stimulate and acquire atrial ECG. (C) Representative ECG signals showing the preferred position of the transesophageal catheter when the atrial signal (red line) from the surface ECG (upper traces) coincides with the atrial signal of the catheter ECG (lower traces). Please click here to view a larger version of this figure.
8. ECG analysis
NOTE: The ECG recordings and stimulations were conducted using an ECG-acquisition software. The analyses were performed using an ECG-analysis software (Figure 3A).
- Measure the P-wave duration corresponding to the atrial contraction expressed in milliseconds (ms).
- Determine the PR interval (expressed in milliseconds) corresponding to the duration of the electrical conduction through the atrioventricular (AV) node.
- Report the duration of the QRS complex (expressed in milliseconds) corresponding to the ventricular depolarization.
- Evaluated the QT interval (expressed in milliseconds) reflecting the total duration of the ventricular depolarization and repolarization.
- Quantify the RR interval (expressed in milliseconds) indicating the duration between two consecutive heartbeats and determining the heart rate.
9. Histological analyses
- Euthanize the rats by exsanguination under isoflurane anesthesia (5%, 2 L/min O2) on day 21 post-PAB.
- Isolate the RA and LA to analyze the atrial histological remodeling associated or not with RHF and cardiac arrhythmias.
- Perform a transverse section of the freshly excised hearts, 5 mm from the apex, to evaluate the ventricular remodeling associated or not with RHF and cardiac arrhythmias.
- Fix the myocardial samples in formalin and stain the histological slides with Masson's trichrome solution22 to quantify ventricular wall thickness and dilation and atrial fibrosis at D21 post-PAB.
10. Statistical analyses
- Assess the normality of distributions by the Shapiro-Wilk test. Compare the normally distributed data using Student's t-test.
- If data are non-parametric distribution, perform a Mann-Whitney test. Analyze categorical variables like AF-inducibility using Fisher's exact test.
- Express the results as mean ± standard error to the mean (S.E.M.). Consider differences statistically significant at two-tailed P values < 0.05.
Results
Visual confirmation of the appropriate ligation of the PA trunk during surgery
During the PAB procedure, an indication of good positioning of the suture is an immediate augmentation of the blood pressure and prompt dilation of the RV and the root of the PA -trunk at the junction with the RV. The suture must not move to ensure a constant and permanent pressure overload for 3 weeks. In this study, the use of a 5-0 Silk was validated as more stable than a metal clip (Figure 2E,F). The 5-0 Silk also allows the possibility of removing the suture if required by a specific study design.
An important observation made during this study was that the application of metal clips resulted in random shapes of the free diameter around the 19 G lead, which is an important source of variability. In this study, a steady diameter of 1 mm was required. Moreover, removing the metal clips often resulted in tearing the PA trunk, which is not acceptable in a study design that would require the removal of the suture to evaluate the restoration of the normal pressure (Figure 2E,F).
Confirmation and measurement of PAB-induced right-sided ventricular pressure overload (Figure 4 and Figure 5)
The ideal confirmation of the increased pressure post-PAB would be the hemodynamic measurement of the pressure with an intravenous and intracardiac catheter as described previously9. For protocols requiring preservation of the heart for a long period and non-invasive approaches, the above-described echocardiography methodology helped to assess the increase in blood velocity and pressure gradient around the suture using CW Doppler (Figure 4A,C). This non-invasive method even allowed the visualization of the ligation and the blood flow disruption caused by the narrowing of the artery diameter by the PAB (Figure 4B,C). Here are shown echocardiography data obtained at D21 post-PAB, but researchers applying this method can perform such non-invasive transthoracic echocardiography at various time points pre- and post-PAB, according to the requirements of their specific investigation and research objectives.

Figure 4: Assessment of PA trunk ligation post-PAB. Continue wave Doppler in a 2D parasternal short axis view was used to visualize the flow pattern crossing the PA trunk in PAB compared to sham rats. (A) Measurement of the blood-flow velocity ejected from the RV through the PA trunk in a sham (left panel) and PAB rats (right panel). (B) Color-flow mapping of the PA trunk in sham (left panel) and PAB rat (right panel). The blood normally ejected from the RV and moving away from the heart with laminar flow appears in blue, and turbulent blood flow after the PAB due to the fixed RV outflow obstruction appears in red and yellow. The partial ligation of the PA trunk can be recognized on the right panel due to the opacity of the silk suture. (C) PA peak velocity expressed in cm/s in PAB compared to sham at D21 post-PAB. (D) Quantification of the PA mean gradient of pressure expressed in mmHg in PAB compared to sham at D21 post-PAB. (Statistical analyses: Data were normally distributed as assessed by the Shapiro-Wilk test. A comparison of the data was performed using the student's t-test. n = 6 rats per group. Results are expressed as mean ± S.E.M.) Please click here to view a larger version of this figure.
On the right side of the heart, PAB induced a severe RHF confirmed by increased RV thickness and RA dilation accompanied by myocardial malfunction, as observed by echocardiography on D21 post-PAB. In terms of RV function, the RV systolic pressure was significantly increased in PAB rats compared to sham, and the in vivo echocardiography also revealed that the contractility rate (Sr) was decreased in PAB compared to sham (Figure 5A-C). Compared to sham rats, the RV dimension at end-diastole (RVDd) and the RV anterior wall thickness at end-diastole (RVAWd) were significantly increased. These echocardiography observations were confirmed after euthanasia and histological analysis of the transverse section of the heart from PAB rats compared to sham (Figure 5D). The increase in the volumetric capacity of the RV in response to the elevated afterload caused the interventricular septum to be pushed toward the LV, generating a relative compression of the LV (Figure 5A,D).
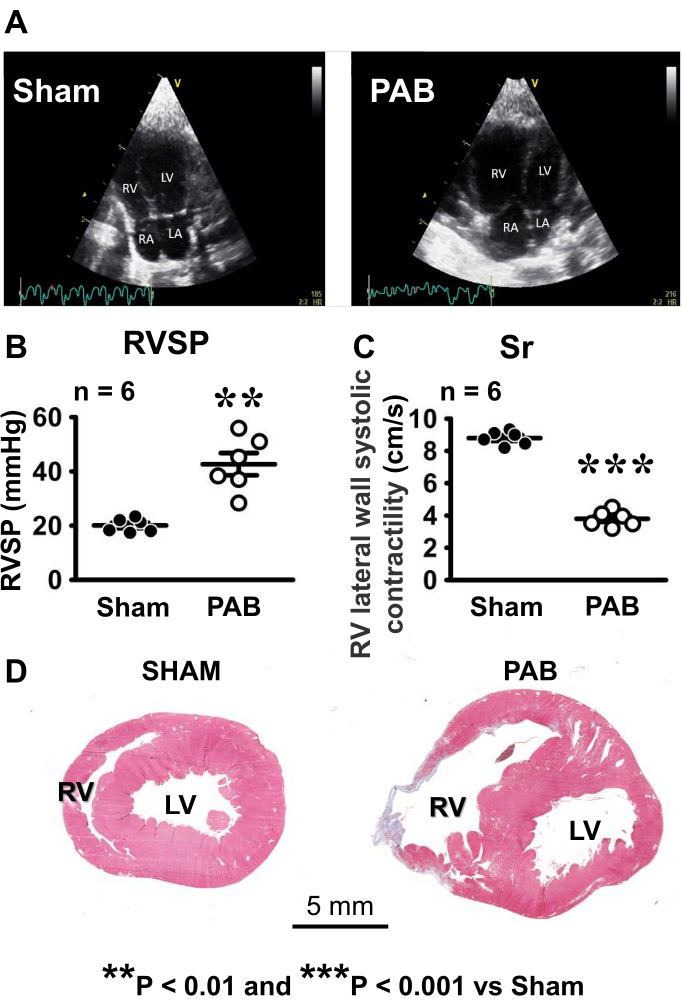
Figure 5: Confirmation of PAB-induced Right Ventricle Remodeling at D21 post-PAB. (A) 2D apical 4-chamber view of the four cardiac chambers highlighting the dilation of the RA and RV in PAB rats (right panel) compared to sham (left panel). Tissue Doppler imaging was used for (B) the quantification of the RV systolic pressure expressed in mmHg in PAB rats compared to sham and (C) the measurement of the RV lateral wall systolic contractility (Sr) expressed in cm/s in PAB rats compared to sham. (D) Histological pictures of transverse sections of the heart in the sham (left panel) and PAB rat (right panel) confirming that the PAB induced a significant enlargement of the RV compared to the sham. Scale bars: 5 mm. (Statistical analyses: Data were normally distributed as assessed by the Shapiro-Wilk test. A comparison of the data was performed using the student's t-test. n = 6 rats per group. Results are expressed as mean ± S.E.M.) Please click here to view a larger version of this figure.
Assessment of PAB-induced right-sided atrial dilation and tricuspid regurgitation (Figure 6)
The in vivo echocardiography performed at D21 post-PAB confirmed that the RADs significantly increased while the LADs was unchanged, because of the PAB-induced constant augmentation of pressure on the right side of the heart (Figure 5A, Figure 6A,B). The persistent PAB-induced right-sided pressure overload was accompanied by the deformation of the tricuspid valve annulus. PAB-induced malfunction of the tricuspid valve was assessed by in vivo echocardiography performed at D21 post-PAB, by the observation of tricuspid regurgitation characterized by blood leakage into the RA at systole (Figure 6C-E).

Figure 6: Evaluation of PAB-induced remodeling of the RA and tricuspid valve at D21 post-PAB. (A) Quantification of the RA dimension at end-systole (RADs) in sham and PAB rats measured by 2D apical 4-chamber view. (B) Quantification of the LA dimension at end-systole (LADs) in sham and PAB rats. (C) Color mapping on 2D apical 4-chamber view was recorded to observe normal closure of the tricuspid valve in sham (left panel) compared to tricuspid regurgitation characterized by blood leakage from the RV into the RA of PAB rats (right panel) in response to PAB-induced right-sided stretching and deformation of the tricuspid valve annulus. (D) M-mode echocardiography in apical 4-chamber view was used for the quantification of tricuspid annulus plane systolic excursion (TAPSE) in PAB rats compared to sham. (E) Pulsed wave Doppler was used for the quantification of the tricuspid annulus moving velocity in PAB rats compared to sham. (Statistical analyses: Data were normally distributed as assessed by the Shapiro-Wilk test. A comparison of data was performed with the Student's t-test. n = 6 rats per group. Results are expressed as mean ± S.E.M.) Please click here to view a larger version of this figure.
Evaluation of PAB-induced cardiac arrhythmogenesis (Figure 7 and Figure 8)
AB-induced cardiac remodeling was observable by electrophysiological analyses on D21 post-PAB. ECG parameters, including R-R interval, P-wave duration, and QT interval were significantly increased in PAB rats compared to sham (Figure 3A). These changes revealed that the heart rate, the atrial conduction, and the ventricular contractility were affected by the PAB (Figure 7).
In addition, compared to sham, PAB rats were significantly more vulnerable to cardiac arrhythmias, including AF, in response to electrical stimulations (Figure 8).
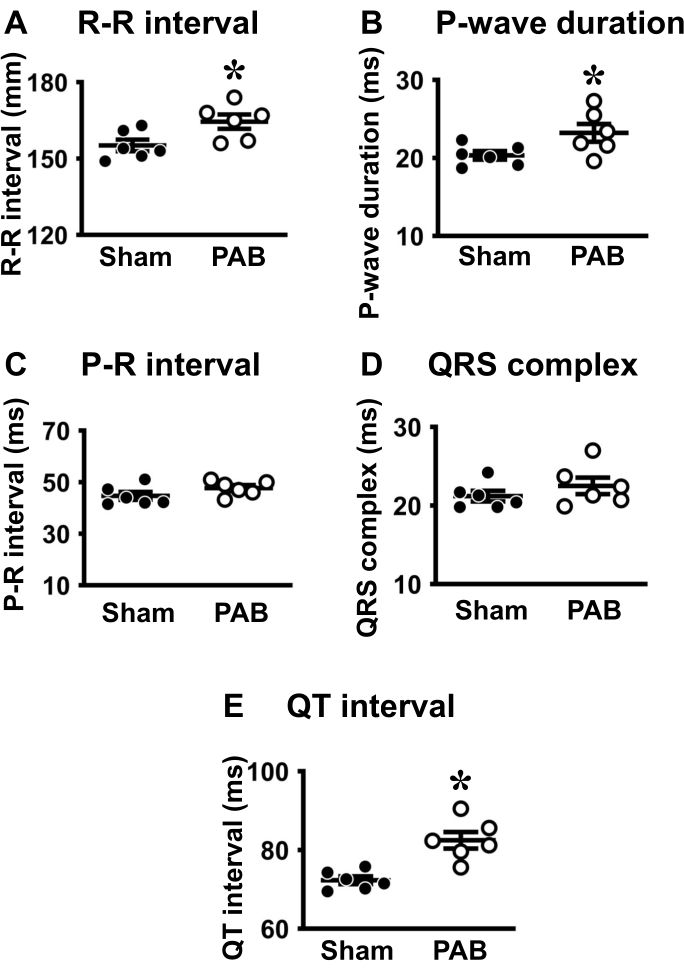
Figure 7: Electrocardiogram analyses. ECG parameters (in ms) were measured, including (A) R-R interval, (B) P-wave duration, (C) P-R segment, (D) QRS complex, and (E) QT interval. (Statistical analysis: Data were normally distributed as assessed by the Shapiro-Wilk test. Comparisons were performed by Student's T-test. Each point represents an individual animal. n = 6 rats per group. Results are expressed as mean ± S.E.M.). Please click here to view a larger version of this figure.

Figure 8: PAB-induced cardiac arrhythmias, including AF. (A) Representative surface ECG observed in sham (upper panel) and PAB rats (lower panel) during electrophysiological study showing sinus rhythm (SR), 3-second burst pacing (stimulation) followed by AF or/and SR recovery. (B) Quantification of PAB-induced vulnerability to atrial tachyarrhythmias, including AF and atrial flutter (AFl). (C) Duration of AF in inducible sham and PAB rats. (Statistical analyses: (B) Fisher's exact text. (C) n was too short in sham to perform a comparison test. n = 6 rats per group. Results are expressed as mean ± S.E.M.) Please click here to view a larger version of this figure.
Mortality (Figure 9)
The placement of the suture at D0 was accompanied by a 30% mortality among PAB versus 0% in sham rats in the minutes to D3 following the surgery. Rats who survived the first 3 days post-surgery survived until the day of final experiments (D21). After D21, the mortality rate increased significantly among PAB rats (60% versus 0% in sham) due to the severity of the right-sided remodeling and RHF (Figure 9).
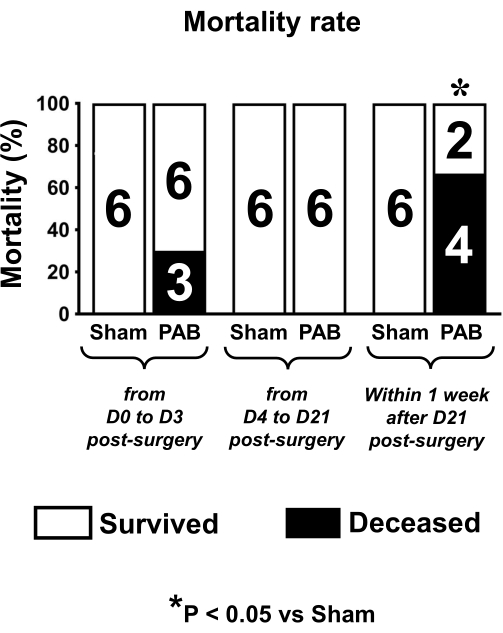
Figure 9: Mortality rate. Mortality expressed in percent (%) in sham and PAB rats between D0 and D3, D4 and D21, and after D21 post-surgery. Please click here to view a larger version of this figure.
Discussion
The successful performance of the PAB is the most crucial part of this protocol. It is important to properly distinguish the aorta and the PA trunk. The isolation of the PA must be performed meticulously to avoid tearing, bleeding, and death during the procedure. The application of the suture around the 19G lead must be performed quickly and followed by immediate removal of the lead, to avoid too long 'complete obstruction' of the PA due to the presence of the lead.
According to the requirements of the investigations, we determined that a 5-0 Silk was more stable than a metal clip to perform the PAB10,13. In addition, the 5-0 Silk allowed removal, while the clips provoked risks of tearing the PA. Researchers performing the PAB must adapt the choice of suture material (silk, metal, plastic clip) in accordance with their research objectives10.
In this study, the PAB (leaving 1 mm free diameter) was followed by in vivo analyses 3 weeks post-PAB. After 21 days, the mortality rate increased among the animals due to the severity of the right-sided cardiac remodeling10,13,23 (Figure 9). This protocol was designed and adapted for our exploration of arrhythmogenic cardiac remodeling in 3 weeks. Researchers reproducing this model can consider adapting the diameter using another lead than the 19 G and/or prolonging or decreasing the duration of post-PAB remodeling until euthanasia23.
The single-dose MCT injection is a recognized method to induce severe PAH and RHF8,9. However, due to the importance of MCT-induced pneumo-toxicity, this method was not relevant in our specific context, which aimed to study the impact of inflammation in RHF-induced CA9. The specific research hypothesis of this study required the use of a method of increased PA without pulmonary injury to avoid inflammation signaling originating from the lung. Hence, the PAB strategy was the best option in our context13.
This method can find applications in various research areas. In cardiology, the PAB protocol can be useful in studying right-sided cardiac hypertrophy, cardiac arrhythmogenesis, and valvular disorder (PA stenosis, tricuspid malfunction)24,25,26. In research on aging, the PAB protocol can be useful to evaluate the impact of RHF in the aggravation of age-related cardiac dysfunction27. In pulmonology, the PAB protocol can be used to study the impact of PA trunk stenosis on intra-pulmonary function28. Among other avenues, the PAB can also be useful to evaluate the role of long-standing PAB-induced RHF on brain function and neuro-degenerative disorders29. Overall, the impact of cardiac inflammation and fibrosis in heart-associated disorders is a major concern30. The PAB model of cardiac fibrosis and inflammation offers an interesting standardized and reproducible approach to evaluate the mechanisms associated with cardiac inflammation and the possibility of testing potential interventional strategies31,32.
Depending on the specificity of the model studied, researchers may prefer inducing other levels of RHF severity than the one described in this paper by using gauge needles different from the 19 G presented in the article. It is therefore important to notice that for smaller lead diameters, using 20 G or 21 G, we faced 100% mortality of rats weighing 225-275 g within minutes following the suture due to the obstruction of the PA trunk.
The PAB-induced RHF is a reproducible and efficient method to induce and study CA, including AF in rats. The atrial and ventricular remodeling provoked by the narrow PAB (1 mm diameter) is characterized by myocardial inflammation and fibrosis, which confers an interesting approach to investigating RHF-associated ventricular and atrial arrhythmogenesis.
Disclosures
The authors have nothing to disclose.
Acknowledgements
The authors are thankful to Colombe Roy, YanFen Shi, Sandra Querry, and Josiane Deslandes for the technical performance of transthoracic echocardiography and to Nathalie L'Heureux for preliminary technical assistance during the standardization of the PAB method. We are grateful to the members of the animal care facility of the Montreal Heart Institute.
Materials
| Name | Company | Catalog Number | Comments |
|---|---|---|---|
| 0.9% Sodium Chlorine Injection USB (100 ml) | Baxter | JB1302P | Solution used for drugs (analgesic and anti-inflammatory) dilution and for preparing saline water syringes dedicated to rehydrating the animal after the surgery |
| 19 G x 1 1/2 PrecisionGlide Needle | BD | 305187 | Needle modified (bent and blunted) to be used as a spacer during for the partial constriction of the pulmonary trunk |
| 2" x 2" Non Woven Non-Sterile Ritmed Gauze Sponge, 4-Ply | AMD-Ritmed | A2101-CH | Gauze sponges used to absorb blood from the wound or to gently push organs (ex: thymus) aside. |
| 4" x 4" Non Woven Non-Sterile Ritmed Gauze Sponge, 4-Ply (x200) | AMD-Ritmed | A2100-CH | Gauze sponges used to absorb blood from the wound or to gently push organs (ex: thymus) aside. |
| 5-0 Vicryl Violet Suture RB-1 1/2 Circle Needle 17mm 27" | Ethicon | J303H | Synthetic absorbable sterile surgical suture with a taperpoint needle used for muscle and skin wounds closure. |
| Anafen (100 mg/mL) | Merial Canada, Inc. | 1938126 | Diluted injectable solution of ketoprofen administered as a nonsteroidal anti-inflammatory, analgesic and antipyretic drug. |
| AutoClip System | FST | 12020-00 | Can be used to close the skin wound. Includes a clip applier, wound clips (9 mm) and a clip remover. |
| Dumont #5/45 Forceps | FST | 11251-35 | Dumoxel forceps with tips angled at 45°. Used to tighten the knots around the spacer placed on the pulmonary trunk. |
| Fine Scissors - Sharp | FST | 14060-10 | Stainless steel iris scissors dedicated to intercostal muscles incision and suture cutting. |
| Forane (Isoflurane) 100 mL | Baxter Canada | BAXCA2L9100 | Inhalation anesthetic used for rodents during their PAB surgery. |
| IV Catheter 16 G x 1.77 " (Straight) | BD Insyte | 381257 | Catheter used as an endotracheal tube with its metal stylet blunted. |
| Light LED 130 F - DrMach | Eickemeyer | M130300 | LED wall mounted light. |
| Magnetic Fixator Retraction System: Base plate | FST | 18200-50 | Metal plate on which the associated fixtures are installed. It is placed around the heating plate. |
| Magnetic Fixator Retraction System: Elastomer (2 m Roll) | FST | 18200-07 | Used to attach the retractors to the fixators. |
| Magnetic Fixator Retraction System: Fixators | FST | 18200-02 | Movable anchors that can be placed on the base plate. |
| Magnetic Fixator Retraction System: Retractors | FST | 18200-11 | Retractors allowing to maintain the surgical wound with the desired opening |
| Metzenbaum Scissors (Curved) | FST | 14017-14 | Stainless steel blunt scissors used for blunt dissection of the skin and muscles. |
| Micro-Adson Forceps | FST | 11018-12 | Stainless steel serrated forceps used to grasp skin and other tissues. |
| Oster Golden A5 2-Speed Clipper | Oster Professional | 34264416949 | Pet grooming clipper used to prepare the surgical field. Since it's meant to be used with large animals, the user needs to be careful with rats. |
| Rodent heating plate or warming system | Custom made | N/A | Plate connected to a unit equipped with a LED screen displaying the temperature detected by the rectal probe as well as the target temperature. |
| Rodent Ventilator Model 683 | Harvard Apparatus | 74240-2 | Mechanical ventilator used for small laboratory animals (max 5 kg). |
| Semken Forceps with Serrations (Curved) | FST | 11009-13 | Stainless steel forceps used for tissue dissection. |
| Semken Forceps with Serrations (Straight) | FST | 11008-13 | Stainless steel forceps used for tissue dissection. |
| Silky Fresh Hair removal Cream | Veet | 62200825036 | Hair removal product used to prepare the surgical site after shaving. |
| Soluprep | 3M | 103.26 | Bottled antiseptic solution tinted with 2% chlorhexidine and 70 % alcohol 225 mL. |
| Stainless steel spatula 195 mm | Heathrow Scientific | HS15907 | Spatula used as a tongue depressor during rat intubation. |
| Stereomicroscope System SZ61TR | Olympus | 88-126 | Microscope equipped with binoculars and a built-in camera allowing for video filming. |
| Sterile Sodium Chloride 0.9% Irrigation Bottle (60 mL) | Saline H2O | 25-6048SA-L | Solution used to keep the wound moist throughout the surgery. |
| Surgical Scissors - Sharp-Blunt (Straight) | FST | 14001-12 | Stainless steel scissors used to make the initial skin incision. |
| Suture 5-0 Silk No Needle | Henry Schein | 102-6344 | Silk thread used to do the constriction of the pulmonary trunk |
| Systane Ointment | Alcon | 2444062 | Eyes lubricant providing a temporary relief of burning and irritation caused by the dryness of the eyes during surgery. |
| SZ2-STU2 stereomicroscope stand | Olympus | N1198900 | The arm attached to the base provides a great freedom of movement to the microscope head. |
| Tissue forceps - 1X2 Teeth | FST | 11021-15 | Stainless steel forceps allowing to grasp, hold and manipulate tissues (skin and muscles). |
| Transpore Surgical Tape | 3M | 1527-1 | Medical tape used to immobilized the rats' forelimbs and hindlimbs. |
| Vetbond Tissue Adhesive (3 mL) | 3M | 1469SB | Surgical glue that can be applied in small amounts on the skin It can be used as a complement to subcutaneous sutures. |
| Vetergesic Multidose (0.3 mg/mL) 10 mL | Ceva Canada | 2342510 | Diluted injectable solution of buprenorphine administered as an analgesic drug. |
| Veterinary anesthesia evaporator Tec 4 | Dispomed | 34001 Iso | Enables vaporization of isoflurane and concentration at 0–5%. |
References
- Cassady, S. J., Ramani, G. V. Right heart failure in pulmonary hypertension. Cardiol Clin. 38 (2), 243-255 (2020).
- Campo, A., et al. Outcomes of hospitalization for right heart failure in pulmonary arterial hypertension. Eur Respir J. 38 (2), 359-367 (2011).
- Naeije, R., Manes, A. The right ventricle in pulmonary arterial hypertension. Eur Respir Rev. 23 (134), 476-487 (2014).
- Vonk-Noordegraaf, A., et al. Right heart adaptation to pulmonary arterial hypertension: physiology and pathobiology. J Am Coll Cardiol. 62 (25 Suppl), D22-D33 (2013).
- Olsson, K. M., Nickel, N., Tongers, J., Hoeper, M. M. Atrial flutter and fibrillation in patients with pulmonary hypertension. Int J Cardiol. 167 (5), 2300-2305 (2013).
- Mercurio, V., et al. Pulmonary arterial hypertension and atrial arrhythmias: incidence, risk factors, and clinical impact. Pulm Circ. 8 (2), 2045894018769874(2018).
- Dignam, J. P., Scott, T., Kemp-Harper, B., Hobbs, A. J. Animal models of pulmonary hypertension: Getting to the heart of the problem. Br J Pharmacol. 179 (5), 811-837 (2021).
- Silva, A. L., et al. Monocrotaline induces acutely cerebrovascular lesions, astrogliosis and neuronal degeneration associated with behavior changes in rats: A model of vascular damage in perspective. Neurotoxicology. 94, 59-70 (2023).
- Hiram, R., et al. Right atrial mechanisms of atrial fibrillation in a rat model of right heart disease. J Am Coll Cardiol. 74 (10), 1332-1347 (2019).
- Hirata, M., et al. Novel model of pulmonary artery banding leading to right heart failure in rats. Biomed Res Int. 2015, 753210(2015).
- Jalal, Z., et al. Unexpected internalization of a pulmonary artery band in a porcine model of tetralogy of Fallot. World J Pediatr Congenit Heart Surg. 8 (1), 48-54 (2017).
- Akazawa, Y., et al. Pulmonary artery banding is a relevant model to study the right ventricular remodeling and dysfunction that occurs in pulmonary arterial hypertension. J Appl Physiol. 129 (2), 238-246 (2020).
- Le Quilliec, E., et al. Atrial cardiomyocytes contribute to the inflammatory status associated with atrial fibrillation in right heart disease. Europace. 26 (4), euae082(2024).
- Cheng, H. W., et al. Assessment of right ventricular structure and function in mouse model of pulmonary artery constriction by transthoracic echocardiography. J Vis Exp. (84), e51041(2014).
- Cheng, T. C., Philip, J. L., Tabima, D. M., Hacker, T. A., Chesler, N. C. Multiscale structure-function relationships in right ventricular failure due to pressure overload. Am J Physiol Heart Circ Physiol. 315 (3), H699-H708 (2018).
- Mamazhakypov, A., Veith, C., Schermuly, R. T., Sydykov, A. Surgical protocol for pulmonary artery banding in mice to generate a model of pressure-overload-induced right ventricular failure. STAR Protoc. 4 (4), 102660(2023).
- Prihadi, E. A., et al. Morphologic types of tricuspid regurgitation. Characteristics and prognostic implications. JACC: Cardiovasc Imaging. 12 (3), 491-499 (2019).
- Samson, N., Paulin, R. Epigenetics, inflammation and metabolism in right heart failure associated with pulmonary hypertension. Pulm Circ. 7 (3), 572-587 (2017).
- Liu, Z., et al. Low-voltage zones as the atrial fibrillation substrates: Relationship With initiation, perpetuation, and termination. Front Cardiovasc Med. 8, 705510(2021).
- Tomasello, G., et al. Simple and fast orotracheal intubation procedure in rats. Acta Biomed. 87 (1), 13-15 (2016).
- Halațiu, V. B., Perian, M., Balan, A. I., Scridon, A. Transesophageal atrial burst pacing for atrial fibrillation induction in rats. J Vis Exp. (180), e63567(2022).
- Prophet, E. B., Mills, B., Arrington, J. B., Sobin, L. H. Laboratory Methods in Histotechnology. , American Registry of Pathology. Washington. (1992).
- Silva, J. M. A., et al. Hypertrophy of the right ventricle by pulmonary artery banding in rats: a study of structural, functional, and transcriptomics alterations in the right and left ventricles. Front Physiol. 14, 1129333(2023).
- Camacho, P., Fan, H., Liu, Z., He, J. Q. Small mammalian animal models of heart disease. Am J Cardiovasc Dis. 6 (3), 70-80 (2016).
- Andersen, S., et al. A pulmonary trunk banding model of pressure overload induced right ventricular hypertrophy and failure. J Vis Exp. (141), e58050(2018).
- Ukita, R., et al. A large animal model for pulmonary hypertension and right ventricular failure: Left pulmonary artery ligation and progressive main pulmonary artery banding in sheep. J Vis Exp. (173), e62694(2021).
- Myers, P. O., et al. Impact of age and duration of banding on left ventricular preparation before anatomic repair for congenitally corrected transposition of the great arteries. Ann Thorac Surg. 96 (2), 603-610 (2013).
- Liu, C., et al. Reverse remodeling of pulmonary arterioles after pulmonary artery banding in patients ≥ 2 years old with severe pulmonary arterial hypertension and congenital heart disease. Pediatr Cardiol. 40 (5), 958-964 (2019).
- Roy, B., Vacas, S., Ehlert, L., McCloy, K., Saggar, R., Kumar, R. Brain structural changes in patients with pulmonary arterial hypertension. J Neuroimaging. 31 (3), 524-531 (2021).
- Hiram, R. Resolution-promoting autacoids demonstrate promising cardioprotective effects against heart diseases. Mol Biol Rep. 49 (6), 5179-5197 (2022).
- Hiram, R. Cardiac cytokine therapy? Relevance of targeting inflammatory mediators to combat cardiac arrhythmogenic remodeling. Int J Cardiol Heart Vasc. 37, 100918(2021).
- Al-U'datt, D. G. F., et al. Implications of enigmatic transglutaminase 2 (TG2) in cardiac diseases and therapeutic developments. Biochem Pharmacol. 201, 115104(2022).
Reprints and Permissions
