This protocol presents a microcontroller-based behavioral box to assess prepulse inhibition (PPI) by collecting acceleration data from a sensor beneath the box. This data evaluates sensory gating deficits in socially isolated rats, with an added method for synchronizing data with neuronal activity to advance neurophysiology studies on behavioral disorders.
A subscription to JoVE is required to view this content. Sign in or start your free trial.
Method Article
Developing a Behavioral Box for Assessing Prepulse Inhibition and Neural Activity in Psychiatric Animal Models
In This Article
Summary
Abstract
Early-life distress is recognized as a potential precursor to neurodevelopmental disorders. One approach to investigating this condition in animal models is post-weaning social isolation. This early-life distress in rodents has been shown to lead to neural changes similar to those observed in patients with schizophrenia, including diminished prefrontal cortex volume, decreased dendritic spine density, and increased dopaminergic activity in the ventral tegmental area. The prepulse inhibition (PPI) paradigm is an established method for assessing sensory gating deficits in both human and animal models. PPI refers to the suppression of the startle reflex to a stronger acoustic stimulus (e.g., 120 dB pulse) when it is preceded by a weaker acoustic pre-stimulus (e.g., 65 dB pulse). This phenomenon is often reduced in psychiatric patients and animal models of psychiatric disorders. This article introduces a protocol to build a behavioral box for PPI studies, enabling the use of an accessible, cost-effective animal model of schizophrenia and the synchronization of the behavioral box with neuronal recordings from the model (e.g., electrophysiological recordings). This customized behavioral box effectively detected startle responses and facilitated PPI assessment with simultaneous neuronal recording in freely behaving rodents subjected to post-weaning isolation.
Introduction
Individuals diagnosed with schizophrenia (SCZ) often present sensorimotor deficits. Decreased response to sensory stimulation and difficulty in discerning relevant information from diverse sensory inputs is often reported in those patients1,2. For healthy individuals, delivering a weaker stimulus before a stronger one diminishes the usual startle reflex to the stronger stimulus3. This phenomenon is known as prepulse inhibition (PPI) and has been used to investigate sensory gating deficits in patients with SCZ and animal models of SCZ4.
In an acoustic PPI task, a startle response to a single strong acoustic pulse (e.g., ~120 dB) is compared to the startle response when the same stimulus is preceded in a short interval (30 to 500) by a weaker stimulus (e.g., ~65 dB)3,4. In healthy individuals, the startle response to the pulse is diminished when the weaker prepulse is presented (when compared to the startle response to the single strong pulse alone). This phenomenon is disrupted in individuals with SCZ, who exhibit less suppression of the startle response even when the weaker prepulse is presented preceding the strong pulse1,5,6,7,8.
Similar to SCZ patients, rats with mesolimbic dopamine overactivity also present diminished acoustic PPI9, making this paradigm a useful tool to investigate behavioral and physiological alterations in animal models of schizophrenia. Generally, the commercial apparatus for PPI consists of an acoustic chamber containing sensors, speakers, and software for setting the experimental parameters (e.g., inter-pulse interval and intensity of stimuli), recording rodents' startle response, and processing the data. However, commercial systems often offer limited customization options and are costly. Do-it-yourself (DIY) approaches to building flexible research apparatus are increasing access to equipment and transferring knowledge10. DIY solutions to study sensorimotor gating mechanisms like PPI must consider several key factors to ensure effectiveness and reliability. Some essential considerations include design specifications, environment and light control, sound attenuation, stimulus delivery systems, behavioral measurement sensors, and data acquisition and analysis.
DIY solutions for behavioral boxes have been developed for different functions, such as operant licking experiments11, auditory discrimination tasks12, and forelimb function13. Although several DIY approaches focus on video tracking14, this type of data requires high computational resources to be analyzed. An open-source hardware and software platform can be used to build a low-cost PPI behavioral box with the flexibility to test customized experiments15,16,17, and synchronize neuronal recordings of freely behaving animals.
This article introduces a method for developing a behavioral box to assess PPI with a low-cost platform to investigate the post-weaning isolation rat model, an early-life stress contributing to the development of SCZ-like symptoms, that can also be used with simultaneous electrophysiological brain recordings.
Access restricted. Please log in or start a trial to view this content.
Protocol
Animal testing was conducted in accordance with the Guide for the Care and Use of Laboratory Animals. This project was approved by the Ethics Committee of CEUA Santos Dumont Institute (approval number 04/2016). For PPI testing, 35 Wistar rats (3 months old, 290-490 g; 19 males and 16 females) were evaluated individually in the PPI box. All 35 rats underwent a protocol of post-weaning isolation, where they were housed individually under a 12/12-h light cycle at a temperature of 23 °C and 70% humidity in a controlled facility with ad libitum access to food and water. Details of the reagents and equipment used in the study are provided in the Table of Materials.
1. PPI box
- Make an acrylic transparentbox with 25 cm length, 20 cm width, and 25 cm height to keep a freely behaving rat with a wired headstage. This height is important to prevent rats from escaping and to keep the headstage free and safe for neuronal recordings.
- Use self-adhesive rubber pads to isolate the acrylic box from external mechanical vibration (e.g., laboratory bench with other equipment) and to keep the accelerometer attached underneath the box without physical contact with other parts (e.g., bench or wires).
NOTE: Adjust the size of the transparent acrylic box according to the task requirements (e.g., mouse, rat, marmoset).
- Use self-adhesive rubber pads to isolate the acrylic box from external mechanical vibration (e.g., laboratory bench with other equipment) and to keep the accelerometer attached underneath the box without physical contact with other parts (e.g., bench or wires).
- Solder a ribbon cable (26 AWG) directly to the four pin holes of an accelerometer board: VCC (voltage), GND (ground), SCL (serial clock), and SDA (serial data). Clean the center of the acrylic and the flat faceboard of the accelerometer. Use cyanoacrylate glue or epoxy resin to attach the accelerometer firmly underneath the acrylic box.
- Wait until it is completely cured (Figure 1). Connect the other side of the ribbon cable to the microcontroller as follows: VCC to 3.3V, GND to GND, SCL to SCL (I2C SCL), and SDA to SDA (I2C SDA). Keep the accelerometer attached under the box without physical contact with other parts (e.g., bench or wires).
NOTE: There are several brands of DYI accelerometers and microcontrollers. The size and type of microcontroller and accelerometer depend on the intended use and box dimensions/specifications. Consider the cleaning procedures after each testing session, and if needed, apply a layer of electronic varnish over the solder joints and circuits to insulate and protect against accidental splashes on the accelerometer metal parts. For comparison purposes, the DYI accelerometer and commercial accelerometer were attached side by side under the box.
- Wait until it is completely cured (Figure 1). Connect the other side of the ribbon cable to the microcontroller as follows: VCC to 3.3V, GND to GND, SCL to SCL (I2C SCL), and SDA to SDA (I2C SDA). Keep the accelerometer attached under the box without physical contact with other parts (e.g., bench or wires).
- Make a soundproof chamber with a frontal door and edges of 80 cm using 15 mm thick medium-density fiberboard (MDF). Line the interior of the box with acoustic foam. Place a speaker 20 cm above the acrylic box in a way that allows the headstage and cable to move freely.
- Connect the computer audio-out to the microcontroller board (analog input and GND) and the speaker through a commercial audio detector, which receives acoustic stimuli from the speaker and generates TTL (transistor-transistor logic) event markers to synchronize behavioral and neuronal data (Figure 2).
NOTE: Build an acoustic chamber according to experimental requirements (e.g., consider the need for cameras, additional light, and speakers). Use a resistor divider (e.g., 10 kΩ and 10 kΩ resistors) to keep the computer audio out to the microcontroller analog input range of 0-5 V. A commercial audio detector device receives audio input and sends TTL (Transistor-Transistor-Logic) as a stimulus onset mark for each acoustic stimulation sent by the computer (0-0.4 V is considered as low state, and 2.8-5 V as high state). Generally, electrophysiology systems have female BNC input ports to receive TTL or analog signals (e.g., audiologic stimuli).
- Connect the computer audio-out to the microcontroller board (analog input and GND) and the speaker through a commercial audio detector, which receives acoustic stimuli from the speaker and generates TTL (transistor-transistor logic) event markers to synchronize behavioral and neuronal data (Figure 2).
- Connect the microcontroller board to the computer with a USB cable. Open the integrated development environment software for the microcontroller board.
- Select the corresponding microcontroller board, COM port, and baud rate. Open the file sketch, compile, and upload the code to the microcontroller board. Click on the monitor serial port to check incoming data. Close the development environment software.
NOTE: When connecting the microcontroller board to a computer via USB, it is assigned a COM port. Open the device manager in the Windows control panel and click on Ports (COM & LPT) to see the microcontroller assigned COM port (COM number). The COM number must match the development software COM port setting. An example of a sketch is available at https://github.com/neurodeveloperISD.
- Select the corresponding microcontroller board, COM port, and baud rate. Open the file sketch, compile, and upload the code to the microcontroller board. Click on the monitor serial port to check incoming data. Close the development environment software.
- Place a digital sound lever meter in the same place where the animal will be in the box. Check the background noise in the chamber with the door closed. Play the acoustic stimuli and adjust the detection range of the sound level meter (30-80 dB or 80-130 dB) to calibrate the acoustic stimulus levels sent by the computer.
NOTE: According to the experimental protocol, different stimuli sequences can be created using a preferred open-source language (e.g., Python). For this study, 68 dB white noise was presented for 7 min with random prepulse and pulse combinations. Export the file as a wave file and the table sequence of the prepulse/pulse combination for offline analysis. - Open a preferred open-source software program to acquire and save serial port data. Configure the COM port, microcontroller board, and baud rate. Click on connect to read the raw data or chart. Click on save to start recording the experiment's data.
NOTE: There is open-source software to record serial ports (e.g., CoolTerm, Python), and commercially available (e.g., Matlab). - Before placing an animal, ensure each component (stimulus delivery, response detection) properly functions. Verify the timing and sequence of stimuli (according to the chosen PPI protocol). Check for accurate detection and recording of accelerometer responses.
- Collect and analyze the response data to evaluate the PPI effect (step 5). Use statistical tools to interpret the results and evaluate sensory-motor gating deficits.

Figure 1: Accelerometer firmly attached under the behavioral box. The figure shows a low-cost accelerometer board (left) and a high-end commercial accelerometer (right) for data comparison purposes. The accelerometer must be firmly attached to the acrylic box, and the flat cable must be attached to the acrylic to avoid breaking it due to cleaning procedures and animal changes. Please click here to view a larger version of this figure.
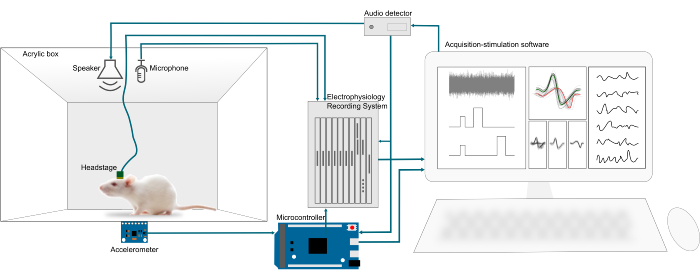
Figure 2: Integrated microcontroller-based behavioral box. Schematic showing a rat in the acrylic box with a wired headstage connected to a brain electrophysiology recording system. An accelerometer underneath the box connected to the microcontroller sends triaxial accelerometer data to the computer and gets stimuli trigger marks for offline data processing. A speaker plays the noise background and sound pulses, which trigger markers for the accelerometer data. A microphone acquires acoustic stimuli to synchronize with electrophysiological data (e.g., acquiring vocalization behavior during tasks). Please click here to view a larger version of this figure.
2. Post-weaning isolation procedure in rats
- Isolate the rats' pups in individual cages immediately after weaning (17th to 21st day after birth) and keep them isolated for a minimum of 90 postnatal days.
- Perform the neurosurgical microelectrodes array implant after 90 postnatal days using established protocols18,19.
- Conduct the PPI task after 7-10 days post-surgery (see step 4).
3. Surgical procedure for electrode array brain implantation
- A microelectrode array must be previously sterilized (this study utilized 32 Tungsten wires of 50 µm in diameter, Figure 3A). Place the animal in an isolated box with isoflurane anesthesia (5% in 0.5 L/min O2, following institutionally approved protocols).
- Remove the animal from the box and keep it under isoflurane anesthesia with an anesthesia nose cone (1% in 0.5 L/min O2). Administer atropine intramuscularly dose of 0.05 mg/kg. Shave the animal's head with a lamina using an antiseptic liquid. After 5 min, administer ketamine intraperitoneal at 70 mg/kg and xylazine intramuscularly at 3 mg/kg.
- Place the animal on a heating pad at 37 ± 0.2 °C in the multiaxial stereotaxic deviceunder inhalable isoflurane (1%-5% in 0.5 L/min O2). Insert a rectal sensor to control the heating pad together with a rectal sensor to monitor the PO2 saturation and heart rate. Ensure that the oxygen saturation is above 95% and the heart rate is between 200-300 bpm.
NOTE: Observe these parameters throughout the surgical procedure and, if necessary, adjust the isoflurane concentration. - Apply sterile ophthalmic lubricant to the animal's eyes and cover the animal with a sterile surgical drape.
NOTE: Carry out all the following surgical procedures under aseptic conditions. - Open the surgical field in the animal's head region and fix it with the skin using sutures (4-0). Apply lidocaine 20% subcutaneously to the animal's cranium and perform a longitudinal incision (~1.5 cm) of the head skin, followed by the removal of the calvarial periosteum. Clean the bone surface with hydrogen peroxide.
- Align bregma and lambda in the same horizontal plane for better accuracy of the craniotomy, especially if recording from multiple brain areas (this study recorded from the Ventral Tegmental Area, Amygdala, Nucleus Accumbens, Hippocampus, and Prefrontal Cortex, Figure 3B).
- Mark the burr hole positions with a robotic drill and insert 3 to 4 screws in distributed locations on the skull distant location of the craniotomy without perforating the dura mater (Figure 3C,D).
- Perform a manual craniectomy19, drilling out the perimeter of the craniotomy using a dental drill at maximum speed for the brain targets (Figure 3E).
- Remove the bone, keep the dura mater with sterile saline, and remove the dura mater.
NOTE: Pay attention to the entire process of extracting the dura mater to prevent brain injury, which could jeopardize depth accuracy. - Place the electrodes of the array at the craniectomy positions and move down the electrode array until the deepest position electrodes lightly touch the brain tissue. Use a wire for electrical grounding of the electrodes, placed on the surface of the skull, arranged around the four screws (Figure 3F).
NOTE: See the training for neurosurgery implant in animal model19 using an alternative subject. - Insert the electrodes every 100 µm until the target location, and fix it with dental cement to keep the connector firmly fixed to the skull and out of the skin.
NOTE: Be careful to avoid dropping dental cement on the brain tissue or in the connector pin holes. - Administer tramadol (5 mg/kg; subcutaneous, [SC]), enrofloxacin (5 mg/kg; SC), and ibuprofen (5 mg/kg; oral) twice daily for three consecutive days.
NOTE: Monitor the animal during anesthetic recovery at intervals of 5-10 minutes for at least one hour. Make sure the animal shows the ability to right itself when lying on its side, maintain a sternal body position, and exhibit spontaneous movement in response to environmental stimulation, such as cage manipulation.
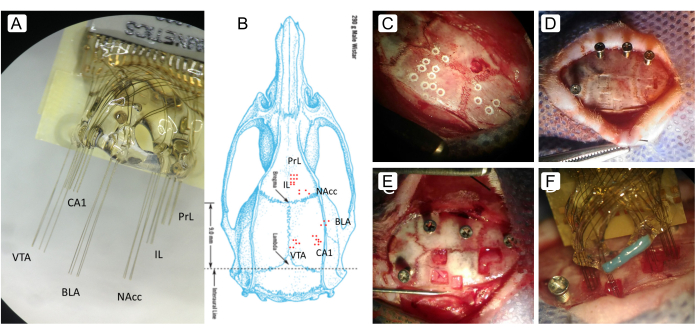
Figure 3: Microelectrode array implant. (A) Microelectrode array with 32 Tungsten wires of 50 um for the Prelimbic and Infralimbic PFC, VTA, AMY, NAcc, and hipc. (B) Rat skull showing the brain targets, bregma, and lambda. (C) Drilling positions for craniectomy and screws. (D) Screws to support the microelectrode array implant and craniectomy drawing. (E) Skull openings without dura mater. (F) Microelectrodes penetrating the brain. Please click here to view a larger version of this figure.
4. PPI and neuronal recordings
- Connect the headstage to the connector implant on the rat skull very carefully.
NOTE: Acclimate the animals for 10 min to the respective test room and recording chamber for 3 days to minimize stress before undergoing any experimental procedures.
This step is crucial to avoid breaking the micro pins of the head stage male connector or damaging the dental acrylic on the skull. To connect the head stage to the cranial implant in awake animals, perform 3 habituation sessions of 10 min of handling. First session: habituate the animal to being held in the palm of the hand, with the thumb and index fingers gently supporting the head, and the body resting against the experimenter. Using the other hand, make light and repetitive movements over the animal's head and the connector area until the animal becomes accustomed to the handling. Second session: Introduce the head stage and perform small, gentle movements simulating the connection process. Gradually increase the contact until the animal becomes habituated to the mild pressure applied to the head during the alignment. Third session: Complete the connection process while holding the animal's head securely, yet allowing for slight natural movements to prevent stress. If the animal moves its head, pause the procedure and reestablish habituation by holding the animal in the palm with its head between the fingers. Once calm, restart the connection process.
The animal can be placed in a box with isoflurane anesthesia (5% in 0.5 L/min O2) to help connect if needed. When using anesthesia to connect the head stage, wait for the isoflurane to wash out so it does not affect PPI behavior and brain activity. - Turn on the neuronal data acquisition system and ensure it receives data from the acoustic stimuli through the microcontroller or a TTL generator connected to the audio detector or microphone. Turn on the serial port open-source recorder previously checked in step 1.6.
NOTE: Depending on the laboratory facility, these synchronization procedures can differ. - Start acquiring electrophysiological (spike and local field potential) and accelerometer data with electrophysiology acquisition software.
NOTE: Check the incoming data and adjust the gain setting to avoid clipping the signal or undetecting spike waveforms and the spike detection threshold. Depending on the recording system and data recorded, one can only adjust gain and threshold in online mode. Ensure the filter setting for the low-frequency signals (LFP), usually 0.5 Hz to 100 Hz, high-frequency (spikes), usually 300 Hz to 5000 Hz, and low-frequency noise, usually 50/60 Hz, are correctly specified to allow an offline analysis. - Expose the animal to white background noise (~68 dB) for 7 min with random presentation of all types of pulses, for 10 times each type (Figure 4). Figure 4 exemplifies five types of pulses used in this protocol: pulse 1 (75 dB prepulse, 30 ms interval, and 120 dB pulse), pulse 2 (85 dB prepulse, 30 ms interval, and 120 dB pulse), pulse 3 (75 dB prepulse, 100 ms interval and 120 dB pulse), pulse 4 (85 dB prepulse, 100 ms interval and 120 dB pulse), and pulse 5 (120 dB single pulse).
- At the end of the recording session, turn off the acquisition software and disconnect the headstage connector.
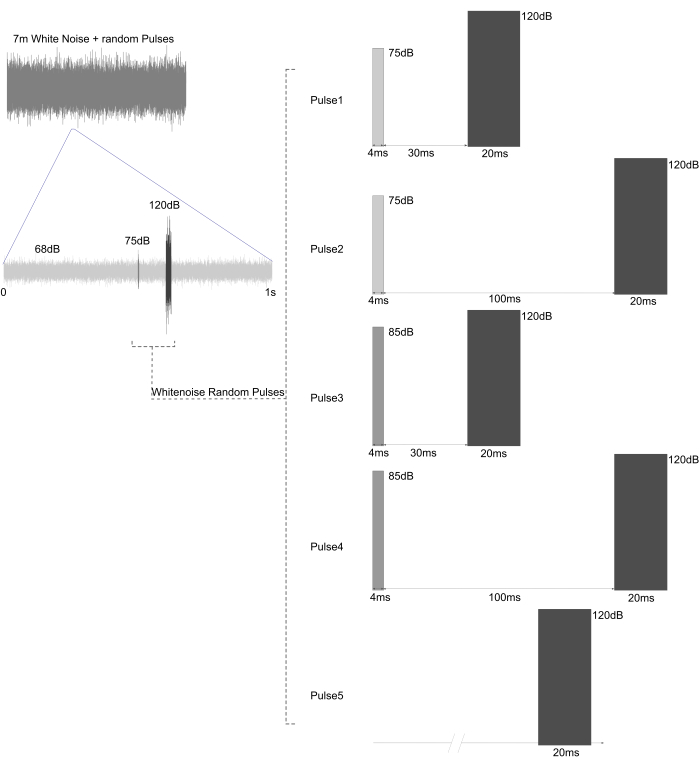
Figure 4: Types of auditory stimuli. An illustrated session of 7 min of white noise with 5 types of prepulse + pulse combinations was presented randomly. Please click here to view a larger version of this figure.
5. Electrophysiological and behavioral analysis
- Import the raw data containing brain data, acceleration, and acoustic stimuli in a signal processing platform. Extract epochs centered on each acoustic stimulus.
- Normalize the means accordingly to compare values between animals. Use the single pulse (pulse 5 in this protocol) as the maximum response and normalize the reflex to other pulses to this value.
- Consider the startle amplitude for pulse 5 as 100% and the other pulses as a function of pulse 5.
NOTE: The amplitudes are extracted using the root mean square (RMS) of the three accelerometer axes (Figure 5A) to express the magnitude of the startle (Figure 5B) in a set of n values. The RMS is a mathematical formula20, where:

ax = accelerometer x-axis, ay = accelerometer y-axis, az = accelerometer z-axis
t = begin of the acoustic stimulus plus 200 ms
n = collection values
To calculate the percent of RMS startle of pulses 1 to 4 related to pulse 5:
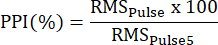
RMSpulse = RMSstartle for the Pulse 1, 2, 3, 4
RMSpulse5 = RMSstartle for the Pulse 5 - Use the TTLs sent to the neuronal data acquisition system to analyze brain data surrounding the acoustic stimuli and reflex responses accordingly.
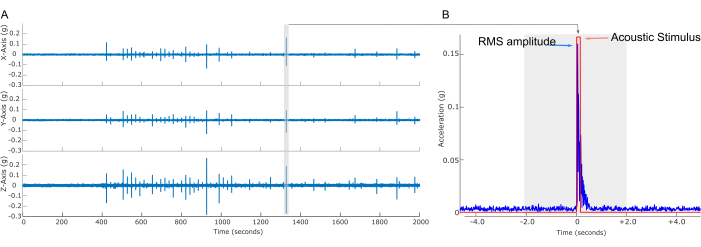
Figure 5: Triaxial accelerometer data and RMS. (A) Illustrative triaxial accelerometer (x, y, z axis (g)) data was recorded during 6 min of baseline and random white noise 80 PPI stimulation. (B) Startle RMS calculation from the three accelerometer axes (x, y, z highlighted gray column, expanded in B). Please click here to view a larger version of this figure.
Access restricted. Please log in or start a trial to view this content.
Results
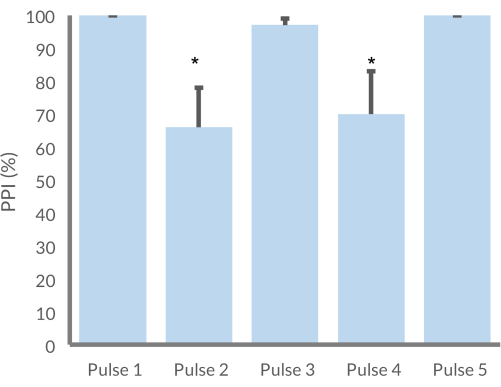
Prepulse inhibition showed no difference for pulse 1 and 3 compared to pulse 5 (120dB only), but showed a statistical difference for pulse 2 and 4 (p < 0.05) (Figure 6).
Access restricted. Please log in or start a trial to view this content.
Discussion
This protocol presented a DIY behavioral box to study prepulse inhibition tasks in freely behaving Wistar rats while recording brain data (in this example, local field potential and spiking activity). The box can be built and customized with components commonly found in neuroscience laboratories, thus being accessible and cheap. Such DIY solutions also allow for more flexibility in designing and personalizing experiments.
Many benefits can be observed with the use of a DIY system, including lo...
Access restricted. Please log in or start a trial to view this content.
Disclosures
The authors declare that they have no competing financial interests.
Acknowledgements
Edith Granados, Cinvestav Guadalajara, for kindly supporting this project with PPI scripts and data synchronization. This work was funded by the Santos Dumont Institute, Ministry of Education, CNPq, CAPES, and FINEP.
Access restricted. Please log in or start a trial to view this content.
Materials
| Name | Company | Catalog Number | Comments |
|---|---|---|---|
| Acrylic box | Custom made | 5mm thick acrylic sheet, 20 cm x 25 cm x 25 cm | |
| Adhesive rubber bumper pads | Gorilla grit | MPU6050 | Diameter 0.8" and height 0.38". Rubber pads to stabilize the acrylic box and isolate from external vibration. The height should be more that 5mm due to MPU6050 underneath the box. |
| Arduino Uno | Arduino | ATmega328P | Arduino microcontroller board based on the ATmega328P with 14 digital input/output pins, 6 analog inputs, and clock speed of 16 MHz. |
| Cedrus stim tracker (audio detector) | Cedrus | https://cedrus.com/stimtracker/index.htm | Cedrus stim tracker detects acoustic stimuli and sends TTL markers to accelerometer data. |
| Cineplex Research System | Plexon | https://plexon.com/plexon-systems/cineplex-behavioral-research-system/ | Recording video of the animal synchornized with electrophysiological data. |
| Cyanoacrilate glue | MPU6050 | Super glue to attach firmly the MPU6050 underneath the box. | |
| Digital sound lever meter | Decibel meter to calibrate the stimuli set before the experiment. | ||
| IBM SPSS | SPSS (Statistical Package for the Social Sciences, USA) | IBM SPSS Statistics software platform. | |
| Matlab | MathWorks | https://www.mathworks.com/products/matlab.html | MATLAB platform for data analysis, algorithm development, and model creation. |
| Micro stainless steel screw | Glasses screws with 1.2mm diameter and 4 mm length. | ||
| Microeletrode array | In house custom made | It uses omnetics connector and tungsten 50micron wires coated with parylene of California Fine Wire. | |
| Microphone | Microphone to acquire acoustic stimulation synchronized with electrophysiological data. | ||
| MPU-6050 | InvenSense | https://invensense.tdk.com/products/motion-tracking/6-axis/mpu-6050/ | MPU-6050 is a 3-axis gyroscope and a 3-axis accelerometer |
| Multichannel acquisition processor | Plexon | SPIKE/LFP | MAP Plexon to acquire neuronal electrophyiological data SPIKE/LFP and auxiliar channels (microphone, TTL markers, accelerometer). |
| NeuroExplorer | Nex | https://www.neuroexplorer.com/ | NeuroExplorer data analysis program of continuously recorded signals and timestamps (spike trains, behavioral events) |
| Neuroexplorer | Nex Technolgie | https://www.neuroexplorer.com/ | Software for SPIKE and LFP neurophysiological data analysis. |
| Offline Sorter | Plexon | https://plexon.com/products/offline-sorter/#38957t34842 | Software for offline spike sorting. |
| OffLineSorter | Offline Sorter | https://plexon.com/products/offline-sorter/ | Offline Sorter is a offline spike sorting software |
| Rectal veterinary SpO2 sensor | KTMED | FS-03 | SpO2 sensor for small animals |
| Ribbon cable | Thin ribbon cable to connect MPU6050 to Arduino. | ||
| Roboti drill | Neurostar | https://robot-stereotaxic.com/drill-injection-robot/ | Robotic drill used with Neurostar stereotaxic. It can be replaced by manual drill. |
| Speaker | Speaker has range of 100 to 40 kHz and intensity of up to 150 dB. | ||
| Stereotaxic apparatus | Neurostar | Stereotaxic used for neurosurgery in rodents |
References
- Braff, D. L., et al. Impact of prepulse characteristics on the detection of sensorimotor gating deficits in schizophrenia. Schizophr Res. 49 (1-2), 171-178 (2001).
- Jahshan, C., et al. Automatic sensory information processing abnormalities across the illness course of schizophrenia. Psychol Med. 42 (1), 85-97 (2012).
- Oranje, B., Geyer, M. A., Bocker, K. B., Kenemans, J. L., Verbaten, M. N. Prepulse inhibition and P50 suppression: Commonalities and dissociations. Psychiatry Res. 143 (2-3), 147-158 (2006).
- Geyer, M. A., Swerdlow, N. R. Measurement of startle response, prepulse inhibition, and habituation. Curr Protoc Neurosci. 3 (1), 8.7(1998).
- Braff, D. L., Grillon, C., Geyer, M. A. Gating and habituation of the startle reflex in schizophrenic patients. Arch Gen Psychiatry. 49 (3), 206-215 (1992).
- Grillon, C., Ameli, R., Charney, D. S., Krystal, J., Braff, D. L. Startle gating deficits occur across prepulse intensities in schizophrenic patients. Biol Psychiatry. 32 (10), 939-943 (1992).
- Kumari, V., Soni, W., Sharma, T. Normalization of information processing deficits in schizophrenia with clozapine. Am J Psychiatry. 156 (7), 1046-1051 (1999).
- Weike, A. I., Bauer, U., Hamm, A. O. Effective neuroleptic medication removes prepulse inhibition deficits in schizophrenia patients. Biol Psychiatry. 47 (1), 61-70 (2000).
- Swerdlow, N. R., Braff, D. L., Geyer, M. A., Koob, G. F. Central dopamine hyperactivity in rats mimics abnormal acoustic startle response in schizophrenics. Biol Psychiatry. 21 (1), 23-33 (1986).
- Wenzel, T. Open hardware: From DIY trend to global transformation in access to laboratory equipment. PLoS Biol. 21 (1), e3001931(2023).
- Longley, M., Willis, E. L., Tay, C. X., Chen, H. An open-source device for operant licking in rats. Peer J. 5, e2981(2017).
- Ribeiro, M. W., et al. OBAT: An open-source and low-cost operant box for auditory discriminative tasks. Behav Res Methods. 50 (2), 816-825 (2018).
- Wong, C. C., Ramanathan, D. S., Gulati, T., Won, S. J., Ganguly, K. An automated behavioral box to assess forelimb function in rats. J Neurosci Methods. 246, 30-37 (2015).
- White, S. R., Amarante, L. M., Kravitz, A. V., Laubach, M. The future is open: Open-source tools for behavioral neuroscience research. eNeuro. 6 (4), (2019).
- Bridge, E. S., et al. An Arduino-based RFID platform for animal research. Front Ecol Evol. 7, 257(2019).
- Chen, X., Li, H. ArControl: An Arduino-based comprehensive behavioral platform with real-time performance. Front Behav Neurosci. 11, 244(2017).
- Oliveira Silva, J. W., Lima, R. A., Morya, E., Brasil, F. L., Gonçalves, L. M. G. Improved behavioral box and sensing techniques for analysis of tactile discrimination tasks in rodents. Sensors. 23 (1), 288(2022).
- Gage, G. J., et al. Surgical implantation of chronic neural electrodes for recording single unit activity and electrocorticographic signals. J Vis Exp. (60), e3565(2012).
- Andreoli, L., Simplício, H., Morya, E. Egg model training protocol for stereotaxic neurosurgery and microelectrode implantation. World Neurosurg. 111, 243-250 (2018).
- Althobaiti, T., Katsigiannis, S., Ramzan, N. Triaxial accelerometer-based falls and activities of daily life detection using machine learning. Sensors (Basel). 13, 3777(2020).
- Heidbreder, C., et al. Behavioral, neurochemical, and endocrinological characterization of the early social isolation syndrome. Neuroscience. 100 (4), 749-768 (2000).
- Weiss, I. C., Iorio, L. D., Feldon, J., Domeney, A. M. Strain differences in the isolation-induced effects on prepulse inhibition of the acoustic startle response and on locomotor activity. Behav Neurosci. 114 (2), 364(2000).
- Cromwell, H. C., Klein, A., Mears, R. P. Single unit and population responses during inhibitory gating of striatal activity in freely moving rats. Neuroscience. 146, 69-85 (2007).
- Kosobud, A. E., Harris, G. C., Chapin, J. K. Behavioral associations of neuronal activity in the ventral tegmental area of the rat. J Neurosci. 14, 7117-7129 (1994).
- Carcea, I., Insanally, M. N., Froemke, R. C. Dynamics of auditory cortical activity during behavioural engagement and auditory perception. Nat Commun. 8, 14412(2017).
- Rosa, M., et al. Routine post-weaning handling of rats prevents isolation rearing-induced deficit in prepulse inhibition. Braz J Med Biol Res. 38 (11), 1691-1696 (2005).
Access restricted. Please log in or start a trial to view this content.
Reprints and Permissions
