Here we present a longitudinal evaluation of golden hamsters infected intraperitoneally (IP) or via intragingival (IG) with L. infantum-Luc by bioluminescent imaging and by PCR. Hamsters were evaluated 1 day post infection (1 dpi), 1 week after infection (8 dpi), and 3 weeks after infection (22 dpi) and euthanized at the 50th dpi and 8 months post infection.
Method Article
In Vivo Imaging of Leishmania infantum-infected Hamsters by Gingival Inoculation of Axenic Amastigotes Expressing Luciferase
In This Article
Summary
Abstract
American tegumentary leishmaniasis (ATL) and visceral leishmaniasis (VL) are considered neglected by the World Health Organization. VL can be lethal if not treated; the drugs used in treatment are toxic, and there are cases of resistance. Preclinical tests can represent a bottleneck in discovering new medicines for treatment, depending on the animal model, the strain used, and the inoculum route. The golden hamster stands out for its high susceptibility to subgenera Viannia and Leishmania species, displaying many of the clinical and immunopathological processes observed in human disease.
By hamster anatomy, which has a short tail and limbs, the intracardiac route is usually the choice for intravenous injection of Leishmania. However, it is an inoculum that can lead to bleeding and eventually to animal death. Thus, we standardized an alternative intravenous inoculation route for infection at the gingival vein, which is minimally invasive, allows easy venous access, and causes few local and systemic injuries to the animal. Therefore, hamsters infected by the intraperitoneal (IP) or intragingival (IG) route with Leishmania Infantum expressing luciferase (Luc) were followed up for 22 days by the bioluminescence imaging system and 50 days and 8 months post infection by PCR.
After gingival inoculation of both axenic amastigotes and promastigotes of L. infantum-Luc, bioluminescence was restricted for at least 2 weeks at the site of injection, which is an indicator of infection in the tissues around the gingival plexus. Hamsters infected intraperitoneally with L. infantum-Luc displayed bioluminescence dispersed throughout the abdomen, as expected. However, by the bioluminescence imaging system infection declined until the 50th dpi and was only detectable by PCR. Axenic amastigotes showed better infection than promastigotes, as evaluated by PCR. Indeed, 8 months after infection, parasites were detected by PCR in the liver of animals inoculated with axenic amastigotes by the intravenous route, which can be a characteristic of the reference strain of L. infantum MHOM/BR/1974/PP75, whose infection progresses slowly and display low parasite burden, below the bioluminescent imaging resolution. Thus, axenic amastigotes can be a better choice for infection and follow-up than promastigotes, and the gingival inoculum is a feasible route for intravenous injection of Leishmania and other pathogens.
Introduction
The leishmaniasis are considered neglected and re-emerging diseases caused by more than 20 species of Leishmania, endemic in several countries in the four central eco-epidemiological regions: Latin America, North and East Africa, and West and Southeast Asia1. They can be grouped as tegumentary (TL) and visceral leishmaniasis (VL), which is lethal if not treated. The etiological agent of VL in Brazil is Leishmania infantum, and treatment is carried out using pentavalent antimonials or Amphotericin B. These drugs are administered intravenously, have high toxicity, display adverse reactions, and there are cases of resistance2.
Thus, it is necessary to invest in the search for new chemotherapy. Preclinical tests are, in fact, a bottleneck in the discovery of new drugs for VL treatment, depending on the animal model, the strain used, the inoculum route, and other logistical, technical, and operational factors. The golden hamster stands out for its high susceptibility to species of the Viannia and Leishmania subgenera, displaying many of the clinical and immunopathological processes observed in the human disease as observed in previous studies with Leishmania braziliensis3,4. The hamster infected with L. infantum also develops most of the immunopathological processes characteristic of VL in humans and dogs5, such as anemia, leukopenia, thrombocytopenia, and hepatosplenomegaly. In addition, the golden hamster is an outbred animal and does not show a uniform response, reproducing the heterogeneity of clinical manifestations as seen in humans3.
Another aspect to consider for infection outcome is the L. infantum strain and the route of inoculation. Several strains of L. infantum differ in genetic background and susceptibility to treatment2,6,7. Some strains have low parasitic load in the liver and spleen after promastigotes infection8, and axenic amastigotes can be an alternative to improve the infection that is not much explored. Indeed, the intravenous route favors infection and increases the frequency of animals with clinical signs; but intraperitoneal inoculation is the most used. The intracardiac route is the choice for intravenous infection with L. infantum5,8,9. However, in hamsters, intragingival inoculation is an alternative route for intravenous injection, not described as a site for infection. Despite being reported, gingival venipuncture is minimally invasive, allows easy venous access, and causes few local and systemic injuries10. The gingival vein puncture agrees the most with recommendations to maximize the quality and applicability of results while preserving animal well-being11.
Preclinical evaluation of compounds for VL using traditional methods requires more animals, which must be euthanized for histopathological analysis and assessment of parasite load in the tissues. In contrast, the bioluminescent imaging system can speed up preclinical studies and reduce the number of animals. The bioluminescent sites in the infected tissues can be followed up in real time in the same animal for several weeks. Several studies on the standardization of this crucial technological tool have shown its application in studies with mice infected with Trypanosoma cruzi, Leishmania spp., and Toxoplasma gondii12,13,14,15. However, depending on the the parasite burden in tissue, bioluminescence can be underdetected by the in vivo imaging system, which requires evaluation by quantitative PCR of the affected organs. Therefore, we propose to develop a methodology based on the intravenous injection of L. infantum expressing luciferase in the gingival vein of golden hamsters for follow-up by the bioluminescent imaging system and PCR.
Protocol
The protocols involving hamsters followed the guidelines of the Instituto Oswaldo Cruz/IOC Committee of Ethics in Animal Research (approval: CEUA/IOC L-015/2022).
1. Cloning of Firefly luciferase gene into the Leishmania expression plasmid
- Digest the plasmid pLEXSY-hyg2 with BglII (10 U/μL) and NotI (10 U/μL) endonuclease. Digest first with BglII: add 50μL of plasmid (9 μg of DNA), 30 μL of restriction enzyme buffer, 3 μL of bovine serum albumin (BSA), 3 μL of BglII, and nuclease-free water to a final volume of 300 μL. Incubate for 3 h at 37 °C.
- Digest the TOPOII/LUC plasmid with BamHI (10 U/μL) and NotI to release the firefly luciferase open reading frame with the Kozak sequence (Kozak-LUC), cloned in TOPOII vector16. Digest first with BamHI: mix 100μL of plasmid (8.5 μg of DNA) with 30 μL of restriction enzyme buffer; 3 μL of BSA, 3 μL of BamHI, and nuclease-free water to 300 μL final volume. Incubate for 3 h at 37 °C.
- Clean up each plasmid on a silica membrane and elute the DNA twice with 50 μL of water for a final volume of 100 μL.
- Double digest the previously linearized pLEXSY-hyg2 and TOPOII/LUC plasmids with NotI. Mix 100μL of the DNA eluted from the silica membrane to 15 μL of buffer D, 2 μL of NotI, and nuclease-free water to 150 μL final volume. Incubate for 1 h at 37 °C.
- Gel purify the double-digested vector (pLEXSY-hyg2) and the insert, Kozak-LUC, from a 1% agarose gel after electrophoresis with Tris-acetate EDTA (TAE) buffer. Excise the bands of ~8 kb and 1.6kb with a scalpel. Weigh the slices, add three volumes of buffer to 1 volume of gel, incubate at 50 °C to dissolve the gel, transfer to the silica membrane, and wash and elute the DNA twice with 20 μL of water, with a final volume of 40 μL.
- Ligate the double-digested vector (pLEXSY-hyg2) and the insert, Kozak-LUC, with the T4 ligase: mix 2 μL of vector and insert, both at 55 ng/μL, molar ratio of 1:5; add 5 μL of ligation buffer; 1 μL of T4 DNA ligase (1U/ mL), final volume of 10 μL. Incubate overnight at 16 °C.
- Add 40 μL of nuclease-free water to the 10 μL of ligation reaction and precipitate the DNA with 10 volumes of butanol. Centrifuge at top speed for 10 min in a microcentrifuge, wash the pellet with 70% ethanol, centrifuge at top speed for 10 min, let the pellet dry on the bench, and add 4 μL of water.
- Mix 4 μL of the ligation reaction with electrocompetent bacteria, JM109 (40 μL), transfer the mixture to a cuvette (d = 0.2 cm), and keep it on ice. Electroporate at 2,500 V, 200 Ω, 25 μF, put the cuvette in ice, and add 1 mL of LB medium. Immediately transfer the mixture to a 15 mL conical tube and incubate at 37 °C for 60 min and 100 rpm.
- Plate the mixture onto two LB agar/ampicillin (100 µg/mL) plates: one with 200 μL and another with the whole electroporated bacteria. Concentrate the volume by centrifuging transformed bacteria at 2,000 × g for 10 min, re-suspend the pellet in 100 μL, and plate the entire volume/pellet. Incubate the plates for 24-30 h at 30 °C and wait for clones to grow.
- Select clones with a toothpick and transfer to 50 mL conical tubes containing 5 mL of LB/ampicillin (100 µg/mL) medium. Incubate for 20-24 h at 30 °C and 100 rpm to allow miniprep cultures to grow.
- Purify the plasmid with the miniprep kit and elute the DNA with 30 μL of water. Screen clones containing the construct pLESXY-LUC-hyg2 by digestion with BamHI.
- Mix 10 μL of DNA from miniprep; 2 μL of restriction enzyme buffer; 0.2 μL of BSA: 1 μL of BamHI and nuclease-free water to 20 μL final volume. Incubate for 1 h at 37 °C-expected fragments of positive clones in 1% agarose gel electrophoresis: 3,450 and 6,290 base pairs.
- Prepare a maxiprep culture to purify the construct pLESXY-LUC-hyg2 on a larger scale. Add an Erlenmeyer (1 L), 250 mL of LB medium supplemented with ampicillin, and 1 mL of the miniprep transfected JM109 and incubate for 18-20 h at 30 °C and 200 rpm.
2. Production and selection of Leishmania infantum expressing luciferase
- To release the Leishmania integration cassette, restriction digest the plasmid pLESXY-LUC-hyg2 to completion with SwaI. Add 40 μL of plasmid (50 μg), 10 μL of fast digest buffer, 4 μL of SwaI, and nuclease-free water to the 100 μL final volume. Incubate overnight at 30 °C.
- Precipitate with ethanol, wash once with 70% ethanol, re-suspend with 50 µL of water, and keep on ice.
- Centrifuge Leishmania MHOM/BR/1974/PP75 promastigotes at 1,000 × g for 10 min at the exponential growth phase in Schneider's medium. Wash the pellet with brain and heart infusion (BHI) medium, and centrifuge at 1,000 × g for 10 min. Re-suspend the pellet to 108 promastigotes/mL in BHI.
- Mix the L. infantum promastigotes (500 μL) with pLESXY-LUC-hyg2 integration cassete (50 µg) in the electroporation cuvette (d = 0.4 cm), on ice. Electroporate with two pulses of 1,500 V/25 micro F and 10 s intervals. After the pulse, keep on ice for 10 min.
- Transfer the transfected promastigotes to a flask with Schneider's medium supplemented with 20% FCS at 26 °C. After 24 h, add hygromycin-first 50 µg/mL, then increase to 100 µg/mL after 48 h, and 150 µg/mL after 1 week.
- Clone transfected promastigotes of L. infantum-Luc by limiting dilution in a 96-well plate with Schneider's supplemented with 20% FCS and 150 µg/mL hygromycin. Incubate at 26 °C for clone growth.
- Screen clones to select genetically homogeneous and highly expressive L. infantum-Luc by bioluminescent emission-relative luminescence unit (RLU), in the microplate reader.
- Briefly, mix 106 promastigotes in a white 96-well plate with the 100 μL of substrate D-luciferin (300 µg/mL) in buffer composed of 25 mM HEPES pH 7.8, 15 mM MgCl2, 4 mM EGTA, 1 mM DTT, 1 μg/mL BSA, 2.5 mM ATP, 0.1% Triton X-100, and 300 μM Coenzyme A, immediately evaluated in the microplate reader.
3. PCR to evaluate genomic integration into the 18S rRNA (ssu) ribosomal locus
- Purify genomic DNA from promastigotes expressing luciferase and wild type (108). Centrifuge promastigotes at 1,000 × g for 10 min in 15 mL conical tubes, add phosphate-buffered saline (PBS) to the pellet, count with a Neubauer chamber, and centrifuge at 1,000 ×g for 10 min. Re-suspend the pellet with lysis buffer: 100 mM NaCl, 10 mM Tris, 25 mM EDTA, 0.5% SDS, and 0.1 mg/mL proteinase K to the density of 108/mL. Incubate overnight at 56 °C.
- Perform two cycles of DNA clean-up with one volume of Phenol/Chloroform/Isoamyl Alcohol, 25:24:1 (v/v), and with one volume of chloroform. Between each extraction cycle, transfer the aqueous phase to new tubes and centrifuge at 2,000 × g for 10 min.
- Precipitate the DNA with two volumes of ethanol and centrifuge at 5,000 × g, 10 min, 4 °C. Add 1 mL of 70% ethanol, transfer to a microtube, and centrifuge at 15,000 × g for 5 min.
- Perform a second wash with 70% ethanol. After centrifugation, discard the supernatant and dry the pellet on the bench.
- Re-hydrate the genomic DNA with 50-100 µL of ultrapure water in a water bath at 65 °C for 30 min, quantify the DNA, and store at -20 °C.
- Carry out diagnostic PCR to evaluate the integration of the pLEXSY cassette in the Leishmania genome by setting up the following PCR reaction: 10 μL of PCR Buffer, 0.2 mM dNTP, 1 U of DNA polymerase, 1 μg of genomic DNA, 0.5 μM of each primer, and nuclease-free water to 50 μL final volume.
- Select primers that hybridize in the pLEXSY vector and the Leishmania genome: (1) aprt reverse primer A1715 5'-TATTCGTTGTCAGATGGCGCAC-3', hybridize in the utr1 (aprt) region; and (2) ssu forward primer F3001 5'-GATCTGGTTGATTCTGCCAGTAG-3', in the Leishmania chromosomal 18SrRNA (ssu) locus.
- Use the following amplification protocol: One cycle of denaturation at 94 °C for 2 min; 30 cycles of amplification, 30 s at 94 °C, 30 s at 60 °C, 1 min at 72 °C; final extension of 10 min at 72 °C. The expected size of the PCR product is 1.1 Kb.
- Use a second set of primers: (1) hyg forward primer A3804 5'-CCGATGGCTGTGTAGAAGTACTCG-3, and (2) the ssu reverse primer F3002 5'-CTGCAGGTTCACCTACAGCTAC-3', which hybridize in the resistance marker of the pLEXSY vector and the 18SrRNA (ssu) locus of Leishmania genome. Use the same PCR protocol described in step 3.6.2 except for the annealing temperature of 53 °C, instead of 60 °C. The expected product is 1.8 kb (hyg - 3`ssu).
- Analyze the PCR products by 1% agarose gel electrophoresis to check whether there was integration into the ribosomal 18S rRNA locus of the L. infantum genome.
4. L. infantum- Luc metacyclic promastigote and axenic amastigote differentiation
- Cultivate L. infantum-LucMHOM/BR/1974/PP75, constitutively expressing Luciferase, in BHI medium, supplemented with 25 mg/L hemin and 20% fetal calf serum (FCS).
NOTE: Hygromycin was withdrawn from the medium of stable transfectants. - To obtain metacyclic promastigotes of L. infantum-Luc, seed 106/mL promastigotes in 75 cm2 flasks, add 20 mL of BHI medium supplemented with 20% FCS at 26 oC and keep in the horizontal position for 4 days or slightly inclined until the stationary phase of growth. After 6-8 consecutive days, the flask contains increased metacyclic promastigotes; centrifuge the promastigotes at 1,000 × g for 10 min at 4 oC.
- Re-suspend the pellet of promastigotes with 20 mL of DMEM low glucose, count using the Neubauer chamber, and centrifuge at 1,000 × g for 10 min at 4 oC.
- Add DMEM low glucose to the pellet at 3-5 × 10⁷ promastigotes/mL density. Pour 5 mL of promastigotes onto a 10 mL Ficoll cushion, diluted in DMEM, 2:1 (v/v). Centrifuge the gradient at 100 × g for 15 min at 4 oC, with the brake off and slow acceleration.
- Collect metacyclic promastigotes at the interface, on the top of the Ficoll cushion, count using the Neubauer chamber, and centrifuge at 1,000 × g for 10 min at 4 oC. Wash the pellet with PBS to remove any residual Ficoll, count using the Neubauer chamber, and centrifuge at 1,000 × g for 10 min at 4 oC.
- Re-suspend the pellet in PBS to 2 × 10⁹/mL. Keep promastigotes on ice before inoculation.
- Diferentiate promastigotes of L. infantum-Luc to axenic amastigotes in vitro, in modified medium for axenically grown amastigote (MAA)17.
- Prepare MAA by adding 9.55 g/L of medium 199 with Early's salts and glutamine, 0.5% trypto-casein, 3 mM L-cysteine, 15 mM D-glucose, 4 mM NaHCO3, 0.33 mM Na2HPO4, 25 mM HEPES to a final pH of 6.5, and supplement with 20% fetal calf serum (FCS).
- Start cultures in medium flasks (75 cm2) with 9 mL of medium MAA and 1 mL of promastigotes at the stationary phase of growth (7th day), 2-3 × 10⁷ promastigotes/mL. Incubate for 24-48 h at 32 °C to allow amastigote differentiation.
- Keep axenically grown amastigotes by two to three passages per week until whenever they reach a density of 2-3 × 10⁷/mL.
- Scale up axenic amastigotes culture for hamster infection. Prepare 150 cm2 flasks with a high density of amastigotes (5 × 10⁶/mL) in 20 mL of MAA medium supplemented with 20% FCS.
- After 24 h, centrifuge at 1,000 × g for 10 min at 4 oC, wash with the same volume of PBS, count using the Neubauer chamber, and centrifuge at 1,000 × g for 10 min at 4 oC. Add PBS to prepare the inoculum of 108 amastigotes in 50 μL.
5. Animals
- Procure male golden hamsters at the age of 4–6 weeks and keep them in quarantine for 2 weeks. Ensure they are 6–8 weeks old and weigh 80-100 g when they are infected with L. infantum MHOM/BR/1974/PP75.
NOTE: This protocol applies to both male and female hamsters. However, due to their availability at the time, only male hamsters were used in this study. - Divide the hamsters into four groups: group 1, infected intraperitoneally with amastigote (n = 3); group 2, infected intraperitoneally with promastigotes (n = 3); group 3, infected in the gingival vein with amastigote (n = 2); group 4, infected in the gingival vein with promastigote (n = 2); group 5, uninfected hamsters as control (n = 2).
- Keep the animals in ventilated racks, equipped with a controlled ventilation system (10-15 air changes/h), 12 h light/dark cycle, at 21 ± 2 oC and 40-60% humidity. Provide environmental enrichment, such as paper, hay, hydrophobic cotton, cardboard rolls, autoclaved water, and food ad libitum.
6. Infection via the intraperitoneal route
- Physically restrain the hamster on the grid of the cage, using the thumb and forefinger as tweezers to pinch the skin on the back from the sides near the head, and the other fingers pull the skin along the back, trying to get as much skin as possible.
- Align the inoculum site in the abdominal lower right quadrant with the posterior muscles of the thigh.
- Inoculate with the animal body tilted 45º, the head lower than the abdomen, and the needle positioned at 15° to 20°.
- Inoculate axenic amastigotes or promastigotes, 50 µL (108) in PBS, with a 13 x 0.45 mm needle coupled to 1 mL syringe. Insert 0.5 cm beyond the bevel. After inserting the needle into the abdomen, pull the plunger to confirm that it has not been inserted into the vein, and inject the liquid carefully.
7. Intravenous infection by gingival inoculation
- Restrain the hamster by following section 6. Administer intraperitoneally a mixture of 200 mg/kg of 10% ketamine hydrochloride and 10 mg/kg of 2% xylazine hydrochloride, final volume of 1.3 mL, in a 3 mL syringe coupled to a 13 x 0.45 mm needle.
- Pinch the paw by clamping the interdigital base of the cushion to ensure that the animal is anesthetized.
- Restrain the anesthetized hamster in the supine position with both hands and gently pull down the lower lip with the thumbs to expose the gum and the gingival vein
- Position a thinner needle (8 x 0.30 mm) coupled to a 1 mL syringe below the lower incisors along the middle line between the pair of teeth at an angle of 25º, and insert 2-4 mm into the mandibular labial vein.
- To confirm that the inoculum was intravenous and that the needle was inserted into the mandibular labial vein, aspirate blood until the barrel of the needle (yellow part).
- Slowly and carefully inject the inoculum of 50 µL (108) amastigotes or promastigotes in PBS over 1 min until the entire volume has been inoculated to avoid the leakage of the inoculum and blood from the vein to the external environment and allow the dispersion in the bloodstream.
- Before needle removal, apply light pressure with a cotton swab. Simultaneously, remove the needle from the vessel by keeping the cotton swab to promote hemostasis at the site, applying light pressure for 1 min to avoid bleeding and loss of the inoculum
8. Euthanasia by cardiac puncture exsanguination
- Restrain the animal to anesthetize, as described in section 7. Perform cardiac puncture with a 20 x 0.55 mm needle coupled to a 5 mL syringe, inserted at a 45º angle and slightly inclined to the left, just below the xiphoid cartilage.
- Withdraw 1 mL of blood. After the terminal blood collection, remove the syringe but maintain the needle in the heart.
- If the animal is already breathing and displays a heartbeat, administer thiopental sodium 5% (200 mg/kg) with a 5 mL syringe and couple it to the 20 x 0.55 mm needle that is already in the heart.
- After 5 min, with a stethoscope, verify if there are any respiratory movements and heartbeat.
9. DNA extraction from organs and tissues
- After euthanasia, collect the spleen, mesenteric lymph nodes, and fragments of the liver.
- Cut the tissues by freezing on dry ice, thawing, and cutting with two scalpel blades. Digest 20 mg of minced tissues in 600 µL of lysis buffer with 17.5 µL of proteinase K (20 mg/mL) and incubate at 55 °C overnight.
- Centrifuge at 15,000 × g for 4 min to remove fragments of tissues that are not lysed.
- Add 200 µL of protein precipitation solution, mix vigorously for 20 s, incubate for 5 min on ice, and centrifuge at 15,000 × g for 4 min.
- Transfer the supernatant to another tube, add 600 µL of isopropanol, and mix gently until DNA precipitation. Centrifuge the DNA at 15,000 × g for 2 min, and wash the pellet with 70% ethanol for 30 min in a tilt shaker and centrifuge.
- Discard the ethanol and dry the pellet at room temperature. Re-hydrate the DNA with 50-200 µL of ultrapure water at 65 °C for 30 min, quantify and dilute the DNA to 0.1 μg/mL and store at -20 °C.
10. Evaluation of infection in tissues and organs by PCR
- Evaluate the parasite load in genomic DNA of tissues and organs by conventional PCR: 2.5 μL of PCR Buffer, 1.5 mM MgSO4, 0,2 mM dNTP, 1 U of DNA polymerase, 300 ng of genomic DNA, 0.2 μM of each primer, and nuclease-free water to a 25 μL final volume.
- Amplify using the protocol of L. infantum kDNA18: One cycle of denaturation at 94 °C for 2 min; 39 cycles of amplification, 30 s at 94 °C, 15 s at 60 °C, 30 s at 72 °C, final extension of 5 min at 72 °C. The expected size of the PCR product is 145 bp. (1) Fw kDNA (RV1) 5´-CTTTTCTGGTCCCGCGGGTAGG-3´; (2) Rv kDNA (RV2) 5´-CCACCTGGCCTATTTTACACCA-3´.
- Amplify hamster GAPDH, the endogenous control of PCR3: One cycle of denaturation at 94 °C for 2 min, 39 cycles of amplification, 30 s at 94 °C, 15 s at 58 °C, 30 s at 72 °C, final extension of 5 min at 72 °C. (1) Fw GAPDH hamster 5´- GGTTGCCAAACCTTATCAGAAATG-3´; (2) Rv GAPDH hamster 5´- TTCACCTGTTCCACAGCCTTG -3´.
- Analyze the PCR products by 1% agarose gel electrophoresis.
11. Hamster follow-up by in vivo bioluminescence imaging
- Evaluate the progression of infection over time by the bioluminescence emission of the whole animal in the bioluminescence in vivo imaging system, which consists of a cooled charge-coupled camera (CCD) mounted on a light-tight chamber. Keep the animal anesthetized during image acquisition with a nose cone delivery.
- Before bioluminescence acquisition and 5 min before inducing anesthesia, inject D-luciferin (150 mg/kg) intraperitoneally into hamsters by following section 6. Prepare a 15 mg/mL D-luciferin potassium salt stock solution in PBS, filter-sterilize, and store at -80 oC.
- Five minutes after injecting the animals with D-luciferin, anesthetize them with 2% isoflurane in an oxygen-rich induction chamber. After another 5 min, capture bioluminescence images using the CCD camera. Obtain images of hamsters in ventral position 2 h and 24 h after infection, 8 and 22 days post infection (dpi).
NOTE: Maintain anesthesia during the imaging process with the isofluorane-oxygen delivery device. - Based on the level of bioluminescence emission, use the following parameters: exposure time, ranging from 30 s to 5 min, Binning medium or large, f/stop 1 and field of view D (12, 5 cm).
12. Bioluminescence quantification in animals infected with L. infantum- Luc
- Use the manual measurement tool to identify the regions of interest (ROI), size, and area in the head and body of the animal. Quantify bioluminescence acquired by the CCD camera in the selected ROI.
- Measure the background signal with the average background ROI and subtract from the bioluminescent emission obtained from the manual ROI.
- Express the bioluminescence emission in radiance, a unit normalized by time and area: photons.sec-1.cm-2.sr-1
Results
Stable expression of luciferase in L. infantum
Genetically modified L. infantum was produced using the plasmid of the pLEXSY line, which integrates into the genome of Leishmania in the 18S rRNA (ssu) ribosomal locus, whose transcription is driven by RNA polymerase I. Thus, L. infantum-Luc clones were evaluated for plasmid integration in the genome of Leishmania, and for stable expression by bioluminescence emission in vitro. The highly expressing clone displaying bioluminescence >120 fold above the background was chosen for evaluation of genomic integration by PCR. See Figure 1 for agarose gel electrophoresis of PCR products to evaluate plasmid integration in the genome and bioluminescence emission (RLU) of promastigotes of the L. infantum-Luc clone. Fragments of the expected size were obtained from each PCR; one product of approximately 1,1 kb (5'ssu - utr1), and another of 1.8 kb (hyg- 3'ssu) were amplified from the genome of L. infantum- Luc (Figure 1A), confirming the integration of the plasmid cassette and the luciferase gene in the ssu locus of L. infantum genome.
The firefly luciferase expression was also evaluated in promastigotes of L. infantum-Luc by bioluminescence emission (RLU) in the microplate reader, as described in protocols, section 2. Even after several passages in culture and in BALB/c mice for 5 days, it maintained the level of bioluminescence; 569.3 ± 19.5 for the wild type background, and 59361.9 ± 2673.3 (n = 2) for cloned L. infantum- Luc (Figure 1B). Thus, the L. infantum-Luc clone stably expressing firefly luciferase, was used to infect hamsters via intragingival or intraperitoneal routes.
Intravenous inoculum in the gingival vein
To inoculate the Leishmania into the bloodstream of hamsters, care should be taken to minimize vein perforation, bleeding and leakage of the inoculum. Thus, the lower lip has to be pulled down gently to expose the gingival vein (Figure 2A); and a smaller gauge 30 G needle has to be used to avoid excessive perforation of the vein. The needle has to be positioned with the bezel facing up to insert into the vein in a proper angle (Figure 2B). Indeed, to ensure that the needle was injected into the vessel-the mandibular labial vein, the syringe plunger has to be pulled down until blood is aspirated into the needle barrel (Figure 2C). Before needle removal, light pressure has to be applied with a cotton swab to promote hemostasis (Figure 2D).
Longitudinal evaluation by bioluminescence imaging
Hamsters infected intraperitoneally (IP) or via intragingival (IG) with L. infantum-Luc were followed up until the 50th dpi and were evaluated by bioluminescence imaging until 22 dpi (Figure 3). Images were acquired 2 h after intraperitoneal infection with 108 parasites in the peritoneal cavity; images were acquired for 30 s or 1 min exposition binning medium. The bioluminescence signal was >65 fold more intense in the abdomen in amastigote-infected animals (4.6 × 10⁵ ± 3.7 × 10⁵) than promastigote-infected ones (6.8 × 10³ ± 3.8 × 10³) (Table 1), which demonstrates that amastigotes differentiated in vitro are more bioluminescent than the metacyclic promastigotes at the stationary phase and purified in the Ficoll cushion.
One day post infection (1 dpi), bioluminescence images were acquired for 3 min of exposition (Figure 3). There was a 45% decrease in the bioluminescence signal in the abdominal region in promastigote-infected hamsters and 70% decay in amastigote-infected ones (Figure 3), which suggests that amastigotes had degraded to a greater extent than metacyclic promastigotes (Table 1 and Figure 4). One week after infection (8 dpi), promastigote-infected animals sustained the bioluminescence signal (3.3 × 10³ ± 5 × 10³). However, the bioluminescence emission in amastigote-infected hamsters dropped off 95%, from 1.3 × 10⁵ ± 1.1 × 10⁵ to 6.7 × 10³ ± 7.5 × 10³ (Table 1) and reached the same level of promastigote-infected hamsters. Three weeks after infection (22 dpi), a bioluminescence signal was acquired for 5 min of exposition and binning large (Figure 3); the signal was much lower for promastigotes and amastigotes-infected animals (Table 1 and Figure 4).
Another group of hamsters was infected via the intragingival route with amastigotes and promastigotes of L. infantum-Luc (108); bioluminescence emission was observed in the maxillary region (Figure 3). The follow-up started 1 day after infection, and amastigote-infected hamsters displayed more bioluminescence signal and radiance (7.3 × 10³ ± 4.1 × 10³) than promastigote-infected ones (1 × 10³ ± 5.7 × 10²). One week after infection (8 dpi), a 36% drop in bioluminescence signal was observed in promastigotes-infected animals and 90% in the amastigote-infected hamsters; radiance varied from 7.3 × 10³ ± 4.1 × 10³ to 7.8 × 10² ± 5.6 × 10² (Table 1). Three weeks after infection (22 dpi), a bioluminescence signal was also acquired for 5 min of exposition and binning large (Figure 3). The bioluminescence signal was similar and low for promastigote- and amastigote-infected animals (Table 1 and Figure 4) in the head of animals infected at the gingiva and was not observed dispersion of the infection to the abdominal region by bioluminescence signal.
Evaluation of infection in tissues and organs by PCR
We performed conventional PCR to investigate infection in specific organs, such as liver, spleen and lymph nodes, that could be below the detection limit of the in vivo imaging. The target region of kDNA was more specific for L. infantum DNA amplification in infected tissues and organs, and the PCR for the enzyme GAPDH from the hamster was a control of DNA integrity and PCR reaction. Only the samples that were amplified for GAPDH were considered in the analysis. Thus, by PCR, two of three hamsters infected via the intraperitoneal route with axenic amastigotes displayed infection in tissues and organs; animal two (A2) in the spleen and animal three (A3) in the liver, at 50 dpi (Figure 5A). One hamster was infected intraperitoneally with axenic promastigotes; animal three (A3) (Figure 5B) displayed amplification in the lymph node. Hamsters inoculated intragingivally with promastigotes or axenic amastigotes at 50 dpi could not display a clear amplification-just a band in the liver of animal one (A1) infected with promastigotes (Figure 5C). Notably, we had three animals maintained for 8 months whose inoculum delivered by the intragingival route with amastigotes leaked slightly during the injection. Two of three animals displayed a clear infection in the liver, animals one and two (Figure 5D).
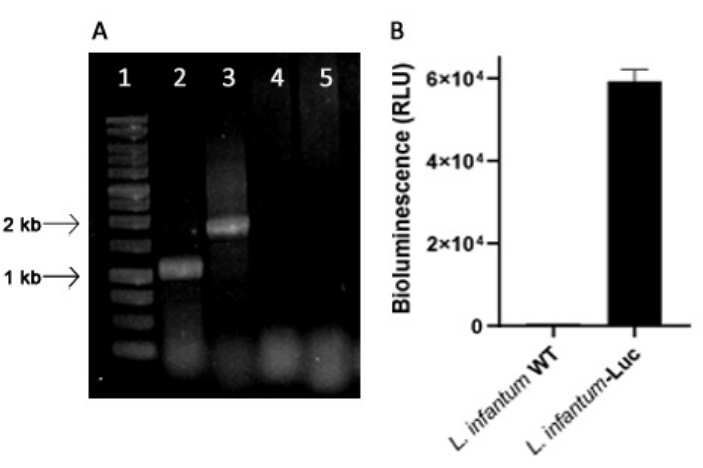
Figure 1: Evaluation of the Leishmania infantum-Luc clone by PCR and bioluminescence emission. (A) Agarose gel electrophoresis of PCR products to evaluate plasmid integration in the genome: lane 1 - 1 kb DNA ladder; PCR of L. infantum-Luc genomic DNA, lane 2 - 5'ssu - utr1 (1.1 kb) and lane 3- hyg- 3'ssu (1.8 kb); PCR of L. infantum-wt genomic DNA, lanes 4 and 5.(B) Bioluminescence emission (RLU) of promastigotes of L. infantum-Luc clone (106) in the microplate reader. Please click here to view a larger version of this figure.
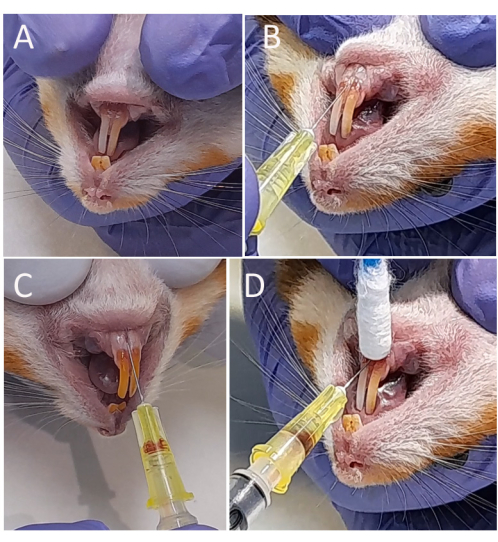
Figure 2: Intravenous injection of Leishmania infantum-Luc into the gingival vein. (A) The hamster was placed in dorsal decubitus, and the lower lip was pulled down. (B) A thinner needle (8 x 0.30 mm) coupled to a 1 mL syringe was positioned below the lower incisors along the middle line between the pair of teeth at an angle of 25º and inserted 2-4 mm into the mandibularis labialis vein. (C) Inoculation of 50 µL (108) of amastigotes or promastigotes in PBS. (D) Hemostasis using a cotton swab and applying light pressure to the inoculation site. Please click here to view a larger version of this figure.

Figure 3: Follow-up by in vivo bioluminescence imaging. Representative images of one animal per group: Infected via intraperitoneal (upper panels) or intragingival (lower panels), with amastigotes or promastigotes of L. infantum-Luc, for 1, 8, and 22 dpi. Red ROI representing the probed regions at the abdomen and head, for intraperitoneal or intragingival infection, respectively. Data show that at 1 dpi, all animals displayed bioluminescence signal in the abdomen or mandible. The signal was dropping after 8 dpi and was almost undetectable in any group at 22 dpi. Please click here to view a larger version of this figure.
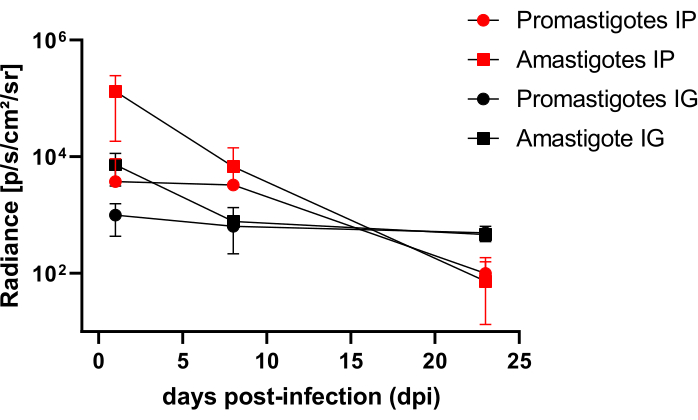
Figure 4: Comparative analysis of radiance from bioluminescence images. Radiance quantification photons.sec-1.cm-2.sr-1 was performed in the abdomen or head of hamsters with manual ROI measurement tools. Average background ROI was subtracted from measurement ROI to remove any spurious signal. Please click here to view a larger version of this figure.
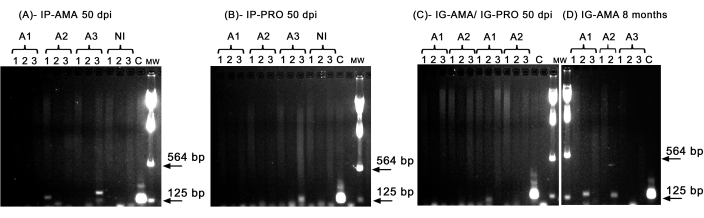
Figure 5: PCR amplification of kDNA. (A) IP-AMA, hamsters infected via intraperitoneal route with amastigote, 50 dpi (n = 3); (B) IP-PRO, infected via intraperitoneal route with promastigotes, 50 dpi (n = 3); (C) IG-AMA, infected via intragingival route with amastigote (n = 2), IG-PRO, infected via intragingival route with promastigote (n = 2); (D) IG-AMA, infected via intragingival route with amastigote, 8 months post infection (n = 3). NI, uninfected hamsters as negative control (n = 2); C- genomic DNA of L. infantum-Luc, positive control of PCR. Tissues and organs: 1- spleen, 2- liver, 3- lymph nodes. mw- molecular weight marker, arrows indicate the lower molecular weight bands. A1- animal one, A2- animal two, and A3- animal three. Please click here to view a larger version of this figure.
| dpi | Amastigotes IP | Promastigotes IP | Amastigotes IG | Promastigotes IG | ||||||||
| Mean | SD | N | Mean | SD | N | Mean | SD | N | Mean | SD | N | |
| 0 | 4.6 x 10⁵ | 3.7 x 10⁵ | 3 | 6.8 x 10³ | 3.8 x 10³ | 3 | - | - | - | - | - | - |
| 1 | 1.3 x 10⁵ | 1.1 x 10⁵ | 3 | 3.8 x 10³ | 5.5 x 10³ | 3 | 7.3 x 10³ | 4.1 x 10³ | 2 | 1.0 x 10³ | 5.7 x 10² | 2 |
| 8 | 6.7 x 10³ | 7.5 x 10³ | 3 | 3.3 x 10³ | 5.0 x 10³ | 3 | 7.8 x 10² | 5.6 x 10² | 2 | 6.4 x 10² | 8.2 x 101 | 2 |
| 22 | 7.3 x 101 | 8.5 x 101 | 3 | 9.9 x 101 | 8.6 x 101 | 3 | 4.6 x 10² | 7.5 x 101 | 2 | 5.0 x 10² | 1.5 x 10² | 2 |
Table 1: Raw data from comparative radiance analysis of bioluminescence images. Radiance quantification average photons.sec-1.cm-2.sr-1 by group and route. Abbreviations: dpi = days post infection; SD = standard deviation; N = sample size.
Discussion
Blood collection or intravenous injection of substances into hamsters is necessary for various scientific studies. Several methods have been developed to access different collection or inoculation routes directly related to the research objectives19. Due to the hamster anatomy-a short tail and limbs-the intracardiac route is usually the choice for intravenous injection of Leishmania. Depending on the strain used, the intracardiac route proved advantageous as the reference strain L. infantum MHOM/BR/1974/PP75, whose infection occurs over the long term, 6-9 months5. However, it is an inoculum that can lead to bleeding and the death of the animal. Thus, we standardized an alternative intravenous inoculation route for infection at the gingival plexus, mandibular labial vein, that causes less harm to the animal. The animals were infected with the genetically modified reference strain L. infantum MHOM/BR/1974/PP75, which stably expressed the firefly luciferase even after several passages in culture and mice (Figure 1), as related for other Leishmania species transfected by the same integrative plasmid20.
The mandibularis labialis vein or gingival vein is a better route for blood sampling, and for multiple blood collection10,11. However, this is the first demonstration that the gingival vein is a feasible site for intravenous infection by Leishmania in hamsters. In contrast to blood sampling that usually uses a high gauge 26 G needle to avoid blood hemolysis10, this needle gauge was not appropriate for Leishmania inoculation, due to vein perforation, bleeding, and leakage of the inoculum. For Leishmania infection via the maxillary mandibularis vein, a smaller gauge 30G-needle was essential. Another aspect that differentiates the vein puncture to infection via gingival vein is the rate of administration, at approximately 1 μL/s; and to ensure that it is injected into the vessel-the mandibular labial vein, and it is not lodged in the mucosa, subcutaneous or intradermal. Owing to the low blood turnover of the gingival plexus, the 50 μL of a high-density inoculum of axenic amastigotes or promastigotes of L. infantum-Luc, 2 x 10⁹ parasites/mL, had to be inoculated slowly (~ 1 min), and the needle has to be removed by keeping the swab pressed for 1 min to allow the inoculum dispersion in the bloodstream (Figure 2).
For longitudinal evaluation of infection hamsters were infected intraperitoneally (IP) or via the intragingival (IG) route with L. infantum-Luc and were followed up for 50 dpi by the bioluminescence imaging system until euthanasia. Considering that the reference strain PP75 could be less virulent per se and that the super-expression of luciferase could also impact the infection effectiveness and maintain the infection for the long term, a high inoculum of 108 parasites was used for infection. After gingival inoculation of both amastigotes and promastigotes of L. infantum-Luc and evaluation by the bioluminescence imaging system, bioluminescence was restricted to the maxillary region of hamsters 24 h after infection. Indeed, hamsters infected intraperitoneally with amastigotes and promastigotes of L. infantum-Luc displayed bioluminescence dispersed throughout the abdomen (Figure 3, 1 dpi). The continuous decrease in bioluminescent emission along the time, from the first day of infection through the 8th day and until the 22nd dpi in hamsters infected with L. infantum-Luc, was independent of the inoculation route (Table 1 and Figure 4).
However, when the parasite burden in the animal tissues is low, it can be below the detection limit of the bioluminescence imaging system but can be detected and quantified by PCR or qPCR. As already reported, the infection caused by strain PP75 is indeed lower than that of other strains5, and only a few developed clinical signs of the disease due to the genetic variability of the animals. In this study, despite the small number of animals and the low virulence of this strain, the axenic amastigotes demonstrated an advantage at 50 dpi, showing better infection than promastigotes, as demonstrated by PCR (Figure 5). Eight months after infection with amastigotes via the gingival route, parasites could be detected by PCR in the liver (Figure 5) and they also displayed moderate piloerection, orbital tightness, and arched posture.
Axenic amastigotes can be a better choice for infection and follow-up than promastigotes21 and have the advantage of being easy to produce on a large scale. The gingival inoculum is feasible and a better route for intravenous inoculation of compounds and for infection of Leishmania and other pathogens, without damage or swelling at the application site in the mandibula or to the animal health.
Disclosures
The authors have no conflicts of interest to disclose.
Acknowledgements
Fundação de Apoio ao Desenvolvimento do Ensino, Ciência e Tecnologia do Estado de Mato Grosso do Sul- FUNDECT. PPSUS/ Decit-MS/CNPq/SES provided financial support for this research. Thanks to Monique Ribeiro de Lima for her advice about the routes of inoculation. This project was developed under the Cooperation Agreement No 258/2017 between FIOCRUZ, and Universidade Federal do Rio de Janeiro- UFRJ. The team is sincerely grateful to the video producers Ricardo Baptista Schmidt and Genilton José Vieira from the Science Popularization Center (IOC) for their invaluable support and assistance in filming the protocols and conducting the interviews.
Materials
| Name | Company | Catalog Number | Comments |
|---|---|---|---|
| 1 kb ladder | Promega | G5711 | |
| 1-Butanol | Sigma-Aldrich | B7906 | |
| Acetyl coenzyme A | Sigma-Aldrich | A2181 | |
| Agarose, LE, Analytical Grade | Promega | V3125 | |
| aprt reverse primer A1715 aprt reverse primer A1715 | Jena Bioscience | PM-111 | |
| BamHI 10 U/mL | Promega | R6021 | |
| BglII 10 U/mL | Promega | R6071 | |
| brain and heart infusion (BHI) | Sigma-Aldrich | 53286 | |
| Cetamin (Ketamine hydrochloride 10%) | Syntec | - | Veterinary use. Anesthetic. Injectable solution containing a 10 mL vial of 10% ketamine hydrochloride. |
| Dextrose Glucose, BD Diagnostics | Difco | 215530 | |
| D-luciferin potassium salt | Promega | E1601 | |
| DMEM low glucose | Sigma-Aldrich | D6046 | |
| eletroporador Gene Pulser Xcell | BioRad Laboratories | ||
| Fetal calf serum (FCS) | vitrocell/embriolife | ||
| Ficoll-plaqueTM PLUS | Cytiva | 17144003 | |
| Gene Pulser/MicroPulser Electroporation Cuvettes, 0.2 cm gap 1652082 | Bio-Rad | 1652082 | |
| Gene Pulser/MicroPulser Electroporation Cuvettes, 0.4 cm gap 1652081 | Bio-Rad | 1652081 | |
| GoTaq Platinum polymerase | Fischer Scientific | 10-966-034 | |
| GoTaq DNA Polymerase | Promega | M3001 | |
| Hemin powder | inlab | ||
| HEPES buffer | Sigma-Aldrich | H3375 Sigma-Aldrich | |
| hyg forward primer A3804 | Jena Bioscience | PM-109 | |
| Hygromycin | Sigma-Aldrich | H3274 | |
| ISOFORINE | Cristalia | Inhalation solution in packs containing 1 bottle of 100 and 240 mL of isoflurane | |
| IVIS Lumina | Perkin Elmer | ISO838N4625 | |
| JM109 Competent Cells | Promega | L2005 | |
| L- Glutamin | Sigma-Aldrich | G8540 Sigma-Aldrich | |
| Lambda DNA/HindIII Marker | Thermo Fischer Scientific | SM0101 | |
| L-cystein | Sigma-Aldrich | 168149 Sigma-Aldrich | |
| Living Image software | Perkin Elmer | - | |
| NotI 10 U/mL | Promega | R6431 | |
| Phenol/Chloroform/Isoamyl Alcohol, 25:24:1 (v/v), Molecular Biology Grade | Sigma-Aldrich | 516726 | |
| Phosphate-buffered saline (DPBS) | Gibco | 14190 | |
| plasmid pLEXSY-hyg2 | Jena Bioscience | EGE-232 | |
| Proteinase K | Promega | V3021 | |
| QIAGEN Plasmid Midi Kit | Qiagen | 12143 | |
| QIAprep Spin Miniprep Kit | Qiagen | 27104 | |
| QIAquick PCR & Gel Cleanup Kit | Promega | A9281 | |
| Schneider's medium | Gibco | 21720-024 | |
| Sodium bicarbonate | Sigma-Aldrich | S6014 | |
| Sodium phosphate dibasic | Sigma-Aldrich | S9763 Sigma-Al | |
| SpectraMax2 microplate reader | Applied Biosystems | ||
| ssu forward primer F3001 primer F3001 | Jena Bioscience | PM-105 | |
| ssu reverse primer F3002 ssu reverse primer F3002 | Jena Bioscience | PM-104 | |
| Steady-Glo Luciferase Assay System | Promega | E2510 | |
| SwaI 10 U/mL | Thermo Scientific | ER1241 | |
| T4 DNA ligase 1 U/mL | Promega | M1801 | |
| T4 fast ligation system | Promega | M8221 | |
| Thermal cycler | Applied Biosystems | Veritiy 96 well plate | |
| TRITON X-100 | Sigma-Aldrich | T8787 Sigma-Aldrich | |
| Tryptic Soy Broth (Soybean-Casein Digest Medium) | Difco-BD | 211823 | |
| Ventilated racks | Alesco | ||
| With Earle′s salts and L-glutamine, without sodium bicarbonate, powder, | Merck | M5017 | |
| Wizard SV Gel and PCR Clean-Up | Promega | A9282 | |
| Xilazina (Xylazine hydrochloride 2%) | Syntec | - | Veterinary use. Sedative, analgesic and myorelaxant. Injectable solution containing a 10 mL vial of 2% xylazine hydrochloride. |
| Zero Blunt TOPO PCR Cloning Kit | Thermo Fischer | 451245 |
References
- Ruiz-Postigo, J. A., et al. Global leishmaniasis surveillance, 2022: assessing trends over the past 10 years. WHO, Weekly epidemiological record n° 40. , (2023).
- Faraut-Gambarelli, F., et al. In vitro and in vivo resistance of Leishmania infantum to meglumine antimoniate: a study of 37 strains collected from patients with visceral leishmaniasis. Antimicrob Agents Chemother. 41 (4), 827-830 (1997).
- Ribeiro-Romão, R. P., et al. Comparative evaluation of lesion development, tissue damage, and cytokine expression in golden hamsters (Mesocricetus auratus) infected by inocula with different Leishmania (Viannia) braziliensis concentrations. Infect Immun. 82 (12), 5203-5213 (2014).
- Gomes-Silva, A., et al. hamster (Mesocricetus auratus) as an experimental model for Leishmania (Viannia) braziliensis infection. Parasitology. 140 (6), 771-779 (2013).
- Moreira, N. D., et al. hematological and biochemical alterations in hamster (Mesocricetus auratus) experimentally infected with Leishmania infantum through different routes of inoculation. Parasit Vectors. 9 (1), 181-194 (2016).
- Carnielli, J. B. T., et al. A Leishmania infantum genetic marker associated with miltefosine treatment failure for visceral leishmaniasis. EBioMedicine. 36, 83-91 (2018).
- Carnielli, J. B. T., et al. Natural resistance of Leishmania infantum to miltefosine contributes to the low efficacy in the treatment of visceral leishmaniasis in Brazil. Am J Trop Med Hyg. 101 (4), 789-794 (2019).
- Moreira, D., et al. Impact of continuous axenic cultivation in Leishmania infantum virulence. PLoS Negl Trop Dis. 6 (1), e1469(2012).
- Fortin, A., et al. Efficacy and tolerability of oleylphosphocholine (OlPC) in a laboratory model of visceral leishmaniasis. J Antimicrob Chemother. 67 (11), 2707-2712 (2012).
- Rodrigues, M. V., et al. The gingival vein is a minimally traumatic site for multiple blood sampling in guinea pigs and hamsters. PLoS ONE. 12 (5), e0177967(2017).
- Oliveira, D. T., et al. Technical report: Gingival vein punction: A new simple technique for drug administration or blood sampling in rats and mice. Scand J Lab Anim Sci. 36 (2), 109-113 (2009).
- Saeij, J. P., et al. Bioluminescence imaging of Toxoplasma gondii infection in living mice reveals dramatic differences between strains. Infect Immun. 73 (2), 695-702 (2005).
- Thalhofer, C. J., et al. In vivo imaging of transgenic Leishmania parasites in a live host. J Vis Exp. 41, e1980(2010).
- Andriani, G., et al. Activity in vivo of anti-Trypanosoma cruzi compounds selected from a high throughput screening. PLoS Negl Trop Dis. 5 (8), e1298(2011).
- Henriques, C., et al. In vivo imaging of mice infected with bioluminescent Trypanosoma cruzi unveils novel sites of infection. Parasit Vectors. 7, 89(2014).
- Henriques, C., et al. Bioluminescent imaging of Trypanosoma cruzi infection in Rhodnius prolixus. Parasit Vectors. 26 (5), 214(2012).
- Sereno, D., Lemesre, J. L. Axenically cultured amastigote forms as an in vitro model for investigation of antileishmanial agents. Antimicrob Agents Chemother. 41 (5), 972-976 (1997).
- Lachaud, L., et al. Value of two PCR methods for the diagnosis of canine visceral leishmaniasis and the detection of asymptomatic carriers. Parasitology. , 197-207 (2002).
- Blood sampling Microsite. , National Centre for the Replacement, Refinement and Reduction of animals in research (NC3RS). https://www.nc3rs.org.uk/3rs-resources/blood-sampling/blood-sampling-hamster (2021).
- Bolhassani, A., et al. Fluorescent Leishmania species: development of stable GFP expression and its application for in vitro and in vivo studies. Exp Parasitol. 127 (3), 637-645 (2011).
- Mendes Costa, D., et al. Murine infection with bioluminescent Leishmania infantum axenic amastigotes applied to drug discovery. Sci Rep. 9 (1), 18989(2019).
Reprints and Permissions
