Here, we provide a comprehensive protocol to resolve initial local Ca2+ signals, known as Ca2+ microdomains, in primary murine and human T cells using fluorescence microscopy. This protocol serves as a valuable resource for researchers examining Ca2+ signaling pathways within immune cells and to further unravel their function.
Method Article
Imaging Initial Ca2+ Microdomains in Primary T Cells
* These authors contributed equally
In This Article
Summary
Abstract
Local, sub-second Ca2+ signals, termed Ca2+ microdomains, are highly dynamic and short-lived Ca2+ signals, which result in a global [Ca2+]i elevation and might already determine the fate of a T cell. Upon T cell receptor activation, NAADP is formed rapidly, binding to NAADP binding proteins (HN1L/JPT2, LSM12) and their respective receptors (RyR1, TPC2) sitting on intracellular Ca2+ stores, like the ER and lysosomes, and leading to subsequent release and elevation of [Ca2+]i. To capture these fast and dynamically occurring Ca2+ signals, we developed a high-resolution imaging technique using a combination of two Ca2+ indicators, Fluo-4 AM and FuraRed AM. For postprocessing, an open-source, semi-automated Ca2+ microdomain detection approach was developed based on the programming language Python. Using this workflow, we are able to reliably detect Ca2+ microdomains on a subcellular level in primary murine and human T cells in high temporal and spatial resolution fluorescence videos. This method can also be applied to other cell types, like NK cells and murine neuronal cell lines.
Introduction
The presented fluorescence microscopy technique enables the visualization of local, temporal initial calcium (Ca2+) signals in primary mouse T cells, termed Ca2+ microdomains. Ca2+ microdomains represent highly dynamic and short-lived Ca2+ signaling events, posing challenges for effective live cell imaging and analysis1.
T cells are challenging for live cell imaging due to the relative differences in central and peripheral fluorescence intensity, which can be attributed to their spherical shape and their small diameter of ~6-8 µm. Upon stimulation and immune synapse formation, T cells undergo morphological changes, further complicating the imaging of T cells1. Therefore, employing a ratiometric analysis becomes imperative, achieved by either recording two images representing different properties of a Ca2+ dye or utilizing a combination of two Ca2+ dyes. The demanding characteristics of Ca2+ microdomains include their rapid, temporally, and spatially limited nature. To capture this, the Ca2+ dyes used must possess both a high basal brightness and a high signal-to-noise ratio (SNR) to obtain the highest temporal and spatial resolution possible. Optimal results have been achieved using a combination of the dual-wavelength dye Fura Red and the single-wavelength dye Fluo-4. Co-loading cells with Fluo-4 and Fura Red mitigate the challenges posed by strong photobleaching of dual-emission wavelength dyes and the temporal delay associated with dual-excitation dyes, ensuring suitability for fast image acquisition. This approach further facilitates the visualization of changes in shape and subtle movements. Special demands are also placed on the imaging system in terms of spatial resolution to enable the visualization of Ca2+ signals originating from the opening of small clusters of channels or even single channels1.
Ca2+ signaling plays a pivotal role in activating immune functions within T cells, including synapse formation and cytokine production and release2,3. The specific fate of the cell is regulated through the differently pronounced and locally distributed Ca2+ signals, the Ca2+ microdomains3. Notably, those local Ca2+ signals precede a widespread rise in intracellular Ca2+ levels in T cells and the formation of Ca2+ microdomains depends on both Ca2+ entry and release1,4,5. Upon T cell receptor (TCR)/CD3 stimulation, the formation of Ca2+ releasing second messengers, like nicotinic acid adenine dinucleotide phosphate (NAADP), D-myo-inositol 1,4,5-trisphosphate (IP3) and cyclic ADP ribose (cADPR) is triggered, leading to rising intracellular Ca2+ levels up to 1 µM6,7. Early Ca2+ signaling events are linked to the release of Ca2+ from intracellular Ca2+ stores such as the endoplasmic reticulum (ER), with channels such as the ryanodine receptor 1 (RyR1) and the IP3 receptor (IP3R) being predominantly responsible for this signaling. This subsequently triggers extracellular Ca2+ influx and results in a global Ca2+ signal via store-operated Ca2+ entry (SOCE)8. In addition, there are other channels involved in Ca2+ signaling during T cell activation9, e.g., P2X4 and P2X7 channels ensure adenosine triphosphate (ATP)-dependent cation influx, contributing to the rise in intracellular Ca2+. Remarkably, initial adhesion-dependent Ca2+ microdomains (ADCMs) are already formed before TCR stimulation but with lower Ca2+ amplitudes and frequencies. These initial TCR-independent Ca2+ signals most likely serve the migration of the T cell to the site of inflammation and prime the T cells for restimulation at the site of infection10,11.
By developing the described method for local Ca2+ imaging, we have gained an additional tool for exploring the origin and significance of early Ca2+ signals in T-cell activation. This method enables the user to detect smaller, short-lived, and more rapidly occurring Ca2+ signals than previously possible. Moreover, Deconvolution, Analysis, Registration, Tracking, and Shape normalization (DARTS), the Python-based analysis pipeline, enables sharing the analysis tools with a broader audience12.
Protocol
All animal experiments were approved and performed in accordance with the animal welfare guidelines of the Institutional Animal Care and Use Committee at University Medical Centre Hamburg-Eppendorf.
1. Isolation of primary mouse T cells from lymph nodes and spleens
- Harvest the spleens/lymph nodes under sterile conditions according to the ethical guidelines and place them in a tube with ice-cold Clicks medium (10% Fetal Calf Serum (FCS), 2 mM L-Glutamine, Penicillin/Streptomycin (P/S) 100 U/mL, 50 nM β-Mercaptoethanol).
NOTE: Wild type and KO mouse T cells are isolated in the same way. - Cool down the centrifuge to 4 °C.
- Place the spleen and lymph nodes in a 70 µm cell strainer in a sterile Petri dish and add spleen isolation medium (RPMI medium + 7.5 % NCS + 1% P/S) to a total volume of 20 mL.
- Thoroughly but gently disrupt the spleen using a plastic mortar. Transfer the cells afterward to a 50 mL centrifuge tube.
NOTE: A total volume of 20 mL should now be in the 50 mL centrifuge tube. Spleen and lymph nodes should be completely disrupted. Work on ice from this point onwards. Keeping the cells on ice slows down their metabolism and prevents cell death, ensuring they remain viable and functionally intact. This helps to preserve their physiological state for a longer period of time, which is especially important for accurate downstream experiments. - Centrifuge the cell suspension at 300 x g for 5 min at 4 °C.
- Discard the supernatant and ensure resuspension of the resulting pellet in 2 mL of Dulbecco`s Phosphate Buffered Saline (DPBS) (without Ca2+ and Mg2+). Transfer to a new 12 mL centrifuge tube.
2. Negative selection of CD4+ T cells
NOTE: For the negative selection of CD4+ T cells, a T cell isolation kit containing a FcR blocker, biotinylated antibodies against non-CD4+ T cells, and streptavidin-coated magnetic particles are used.
- Add 20 µL/mL of mouse FcR blocker from the T cell isolation kit to the cell suspension.
- Further, add 100 µL of the mouse CD4+ T cell isolation cocktails at a concentration of 50 µL/mL, mix well, and incubate for 10 min at room temperature (RT).
- Vortex streptavidin-coated magnetic particles for 30 s, add 150 µL to the cell suspension, mix well, and incubate for 2 min 30 s at RT.
- Add DPBS to the cell suspension, filling it to a total volume of 7 mL. Ensure to pipette up and down gently, then incubate in the magnet for 2 min 30 s at RT.
- Subsequently, gently collect the enriched T cells in the supernatant and transfer them to a new 12 mL centrifuge tube.
- Centrifuge cells at 300 x g at RT for 5 min.
- Discard the supernatant.
- Resuspend the isolated and enriched CD4+ T cells in 1 mL of DPBS, thoroughly pipetting up and down. Incubate the mixture for 2 min 30 s in the magnet at RT to ensure no bead contamination.
- Collect the supernatant, transfer it into a new centrifuge tube and count the enriched T cells.
- To count the cells, stain the cells with trypan blue and count using an automated cell counter.
NOTE: It is best to directly load the isolated CD4+ T cells and image them on the same day of isolation. However, primary murine T cells can be cultured without any stimulation overnight in an incubator at 37 °C with 5 % CO2 in an isolation medium (RPMI 1640 + 10% FCS + P/S).
3. Loading of primary mouse CD4+ T cells
NOTE: To measure free cytosolic Ca2+ concentrations, fluorescent and membrane-permeable dyes are employed in the Ca2+ imaging experiments. A combination of Fluo-4- acetoxymethyl ester (AM) and the ratiometric dye Fura Red-AM serves as an indicator for rapid detection of local Ca2+ signals. Ensure to work in the dark while using fluorescent dyes.
- Centrifuge 2-5 x 10⁶ cells for 5 min, 300 x g, discard the supernatant and resuspend in 480 µL of T cell medium (RPMI 1640, 10% FCS) with 10 µM Fluo-4-AM (Stock: [1 mM]), and 20 µM Fura Red-AM (Stock: [4 mM]).
- Incubate initially for 20 min at RT under the bench in the dark, covering the falcon with aluminum foil.
NOTE: Do not exceed the first incubation time, as the Ca2+ indicators are diluted in DMSO, which could be harmful to the cells at a longer exposure time in the low total volume. Keep the cells shielded from light after loading due to the light sensitivity of the dyes. - At the end of the initial 20-min incubation, add 2 mL of T cell medium to the cells and continue the incubation for an additional 30 min in the dark at RT.
- Centrifuge the cell suspension at 300 x g for 5 min at RT.
- Discard the supernatant and cleanse the pellet by washing it with 2 mL of Ca2+ measuring buffer (140 mM NaCl, 5 mM KCl, 1 mM MgSO4, 1 mM CaCl2, 20 mM HEPES, 1 mM NaH2PO4, 5 mM glucose, pH 7.4) followed by centrifugation at 300 x g for 5 min at RT.
- Finally, discard the supernatant and resuspend it with the Ca2+ measuring buffer. Adjust the cell number to ~100,000 cells per 10 µL.
NOTE: A volume of 10 µL is used for one measurement. Avoid overdiluting the cells, as one might need to further adjust the cell count under the microscope to reach an optimum for the measurement conditions. - Allow the cells to incubate for ~20 min to ensure complete cell infiltration and de-esterification of the dyes. Store cells on ice and in the dark until measurement.
NOTE: Loaded primary murine T cells can be used up to ~4 h after loading.
4. Local Ca2+ imaging
- Slide preparation
- Coat microscope coverslips (24 mm x 46 mm) with bovine serum albumin (BSA, 5 mg/mL) and poly-L-lysine (PLL, 0.1 mg/mL) (Figure 1A). Allow BSA to sit for ~20 min before applying PLL.
NOTE: Coating facilitates cell adhesion. For proper cell adhesion, accurately spread both BSA and PLL until no more streaks are visible. - To create reaction chambers, glue reusable rubber O-rings to the slides using a silicone paste (Figure 1B,C).
NOTE: Other slides/chambers or plates such as 35 mm slides, reusable metal chambers, or 8-, 24- or 48-well plates can be used for image acquisition.
- Coat microscope coverslips (24 mm x 46 mm) with bovine serum albumin (BSA, 5 mg/mL) and poly-L-lysine (PLL, 0.1 mg/mL) (Figure 1A). Allow BSA to sit for ~20 min before applying PLL.
- Coating of Protein G magnetic beads (10 µm in diameter) with antibodies
- Gently mix protein magnetic bead suspension and transfer 12.5 µL to a new tube.
- Place the tube on a magnetic stand to remove the storage buffer and let the beads migrate to the magnet. Gently remove the storage buffer by pipetting it on the opposite side of the magnet.
- To remove any remaining storage buffer, wash the beads by adding 500 µL of PBS-T (PBS, 0.1% Tween) and vortexing for 10 s. Place the tube in the magnetic stand again and remove the buffer.
- To coat the beads with antibodies, resuspend them in 7.5 µL of PBS-T and add 5 µL of anti-CD3 (0.5 mg/mL) and anti-CD28 (0.5 mg/mL), respectively. Incubate for 30-60 min with continuous mixing at RT.
- Wash the coated beads three times with 500 µL of PBS-T, followed by washing once with 500 µL of Ca2+ measuring buffer using the magnetic stand.
- Resuspend beads in 200-400 µL of Ca2+ measuring buffer.
NOTE: Check bead density during measurements, further dilute if necessary.
- Local Ca2+ imaging microscopy
NOTE: Imaging is performed using a brightfield light microscope with a 100-fold magnification, equipped with a xenon arc lamp as a light source. Frames are captured in 14-bit mode with two-fold binning using an electron-multiplying charge-coupled camera. To record and split the emission wavelengths of both dyes, a dual-view module is employed, featuring the following filters in nm (ex, 480/40; bs, 495; em1, 542/50; em2, 650/57). The imaging setup includes an acquisition hub and imaging software for image acquisition.- Place 10 µL of the loaded cells on the prepared slide and let them attach to the slide for 3-5 min.
- Gently add 80 µL of Ca2+ measuring buffer to the slide.
- Select the 100x oil immersion lens and apply a small drop of immersion oil. Place the slide on the microscope table.
- Adjust the focus in the brightfield modus, carefully select a field of view with up to 10 cells that are not in contact with each other, and acquire an image.
NOTE: Overlapping and touching cells will be hard to analyze later.- Turn on the lamp, check the fluorescence and the loading of the T cells, and compare cells in both channels to verify that they are not preactivated.
- Ensure to take pictures of the field of view for both brightfield and fluorescence channels before and after the measurement to check for cell movement and loading.
- Start measurement and capture the basal activity for 1 min with an acquisition rate of 1 frame per 5 s.
- Add 10 µL of compound/stimulant (bead or stimulator/inhibitor) after 1 min and measure for a total of 3 min using 40 frames per s or the maximum frame rate possible.
NOTE: The addition of beads is the crucial step; ensure that the beads are added close to the excitation light on the slide while not moving the slide. Representative examples of Ca2+ microdomains in primary CD4+ T cells upon bead contact from WT and P2x4-/- and P2x7-/- mice are shown in Figure 2.
5. Postprocessing/ data analysis
NOTE: For image processing and data analysis, the Python-based open-source pipeline DARTS is used. It has been developed by Woelk et al.12 based on work by Diercks et al.13.
- Installation of the DARTS pipeline
- Install Python 3.10.014, anaconda15, and git16, and clone the GitHub repository using the terminal command git clone: https://github.com/IPMI-ICNS-UKE/DARTS.git
- Create a conda environment with conda create --name DARTS and install all necessary Python packages with pip install <package>.
NOTE: Follow the installation instructions in the DARTS GitHub repository17,18 for more detailed information. - Before using Bioformats, ensure that a Java Runtime Environment is correctly installed19.
- Usage of the DARTS pipeline
NOTE: Once installed, DARTS can be started from the terminal window.- Navigate to the local copy of the DARTS repository (cd path/to/DARTS) that contains the main.py file. Make sure that the conda environment is activated (conda activate DARTS).
- Execute DARTS by typing python main.py in the terminal window and pressing Enter.
- In the graphical user interface (GUI), specify the source and results directory as well as the image format in the upper left section (see Figure 3).
- Define the properties of measurement, such as the scale (pixels per micrometer), frame rate, cell type, etc. The processing pipeline can be assembled based on the specific image data and research question.
NOTE: Read more about the deconvolution parameters, for instance, in the corresponding documentation20. - Save the settings on the computer before clicking on Start. A more detailed description of the GUI can be found in the DARTS documentation.
- Ca2+ microdomain imaging and bead contacts
NOTE: For local imaging and stimulation with beads and subsequent image analysis, the cell-specific bead contacts need to be defined by the user to identify the starting point (t = 0) of the measurement period of interest (see Figure 4). A bead contact is defined as the contact site of a (stimulatory) bead with a cell of interest. It consists of the specification of (1) the bead contact time, e.g., frame 300, and (2) the bead contact position relative to the center of the cell, e.g., 1 o'clock or 12 o'clock. With the current DARTS version, the user needs to manually define and enter the information for each bead contact. Use the following procedure to define bead contacts:- Use the slider to pinpoint the time of contact between a bead and a cell of interest.
- In the options menu on the right-hand side, select bead contact: x, y, t.
- Select the spot on the left side of the image where the cell and bead make contact.
- Select Choose cell by clicking a point inside. Click on the cell stimulated by this bead, preferably in the center.
- Click on ADD bead contact.
- Repeat steps 5.3.1- 5.3.5 for each additional bead contact in this file. Once all bead contacts are defined, click on the Continue button.
- Proceed with additional files. After the last file is reached, the script will automatically initiate analysis of all files.
- Data analysis
- Find the processed ratio images, microdomain data for each cell over time (incl. localization, amplitude, size), source data for the dartboard projection and further resources in the results folder.
- To create dartboards, navigate to the folder /src/analysis/ inside the DARTS folder (pattern: cd path/to/DARTS/src/analysis) containing the script DartboardPlotGUI.py. Then, type python DartboardPlotGUI.py and press enter.
- Ensure that the necessary information is provided and that the spreadsheet files from the results folder are accurately selected as the source files for dartboard generation.
Results
In this protocol, we outlined an updated method to image and analyze initial Ca2+ microdomains in primary mouse T cells based on previous work by our group1,13. This approach was instrumental in unraveling the involvement of CRAC channels such as ORAI1, STIM1, and STIM2, as well as intracellular Ca2+ release channels like RyR1 in early Ca2+ signaling events4.
To do so, we investigated spontaneous Ca2+ microdomain formation by imaging non-stimulated primary mouse Orai1-/-, Stim1-/-, Stim2-/-, and Ryr1-/- and compared them to WT primary mouse T cells. The analysis of Ca2+ microdomain formation encompassed signal onset velocity, Ca2+ amplitude, and number of signals per confocal plane. Notably, except for Stim2-/- T cells, all KO T cells displayed a significant decrease in local Ca2+ signals and a reduced basal free cytosolic Ca2+ concentration compared to WT cells. This led us to conclude that the formation of Ca2+ microdomains is intricately linked to the interaction of ORAI1, STIM1, and RyR14. In addition, we successfully identified and characterized spontaneous Ca2+ microdomains at the plasma membrane. These Ca2+ microdomains were characterized by a Ca2+ amplitude of 290 nm ± 12 nm. Utilizing a color-coded approach for Ca2+ signals allowed for the visualization of Ca2+ microdomains across the cell. Results further highlighted the rapid onset of Ca2+ microdomains, visible within milliseconds, and the capability of this method to detect Ca2+ signals with a longevity of a few milliseconds4. These spontaneous Ca2+ microdomains were later identified as adhesion-dependent Ca2+ microdomains (ADCM), dependent not only on SOCE but also acting via the FAK/PLC-γ/IP3 signaling cascade10 and involvement of P2X49. Furthermore, this technique was fundamental in confirming dual oxidases 1 and 2 (DUOX1/2) as NAADP-producing enzymes21 and HN1L/JPT222 as one of the newly discovered NAADP-binding proteins23.
Figure 2 shows representative examples of Ca2+ microdomains in primary CD4+ T cells upon bead contact from WT as well as P2x4-/- and P2x7-/- mice. Cells were loaded with the Ca2+ dyes Fluo-4 AM and Fura Red AM and imaged at an acquisition rate of 25 ms (40 frames/s). To mimic T cell synapse formation, cells were stimulated with anti-CD3/anti-CD28 coated beads. Initial Ca2+ microdomain formation was analyzed 1 s prior and up to 15 s after bead contact using the DARTS pipeline. Upon bead contact, the WT cell showed rapid formation of Ca2+ microdomains in the first second after stimulation at the bead contact site (Figure 2A). These Ca2+ microdomains further expanded throughout the cell in the following 15 s after bead contact. Opposed to the WT cell, the P2x4-/- and P2x7-/- cells (Figure 2B) showed decreased Ca2+ microdomain formation upon bead stimulation, as well for the P2x4-/- a lower basal level before bead contact. These representative findings are in line with the previously published results by Brock et al.9, indicating Ca2+ microdomain formation in WT T cells directly after bead contact over 15 s and lower signals per frame in P2x4-/- and P2x7-/- cells. Moreover, the amplitude in P2x4-/- cells was significantly reduced, further establishing the role of purinergic signaling in adhesion-dependent Ca2+ microdomains.
Furthermore, this method can also be used to visualize initial Ca2+ microdomains in primary human CD4+ T cells (Figure 3). In line with primary murine T cells, initial Ca2+ microdomains are evoked at the bead contact site. However, the overall Ca2+ response appears to occur on a different timescale compared to murine CD4+ T cells.
The analysis of local Ca2+ signals in a manual manner is not feasible as it is quite laborious and subjective to the individual investigator. Therefore, we previously developed an algorithm in MATLAB Simulink using its image processing and optimization toolboxes for postprocessing13 for analyzing local Ca2+ microdomains.
Recently, we developed a new, open-source, postprocessing pipeline called DARTS for Ca2+ microdomain analysis in high-resolution live cell imaging using the software platform Python12. Here, different deconvolution algorithms can be selected, depending on the user's preference, a cell shape normalization performed to compensate for morphological cell shape changes, and microscope and measurement specific parameters defined (e.g., scale, frame rate, time measured) (Figure 4).
After selecting parameters for Ca2+ microdomain analysis, a second pop-up window is opened for each individual measurement to define the bead contact (Figure 5). To define the bead contact, the user can manually scroll through the tiff file using the slider and select the bead contact frame individually. Bead contact is selected by clicking at the bead contact site (Figure 5, bead and bead contact indicated by yellow ring and arrow) as well as cell selection. This step must be repeated for each cell of interest. Finally, the automated image postprocessing is applied and the results data is summarized and saved in a spreadsheet.
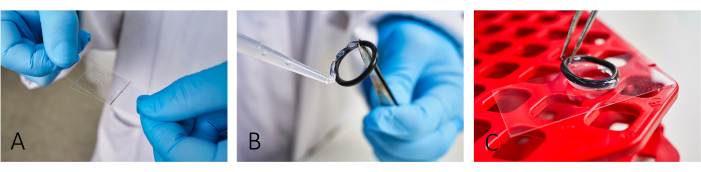
Figure 1: Workflow of slide preparation for imaging. (A) Add and spread both BSA and PLL on the slide using a second glass cover slip. (B,C) To build a chamber, glue the rubber o-rings using silicon grease onto the slide. Ensure that the whole ring is covered with a thin layer of grease to have proper isolation of the chamber. Please click here to view a larger version of this figure.
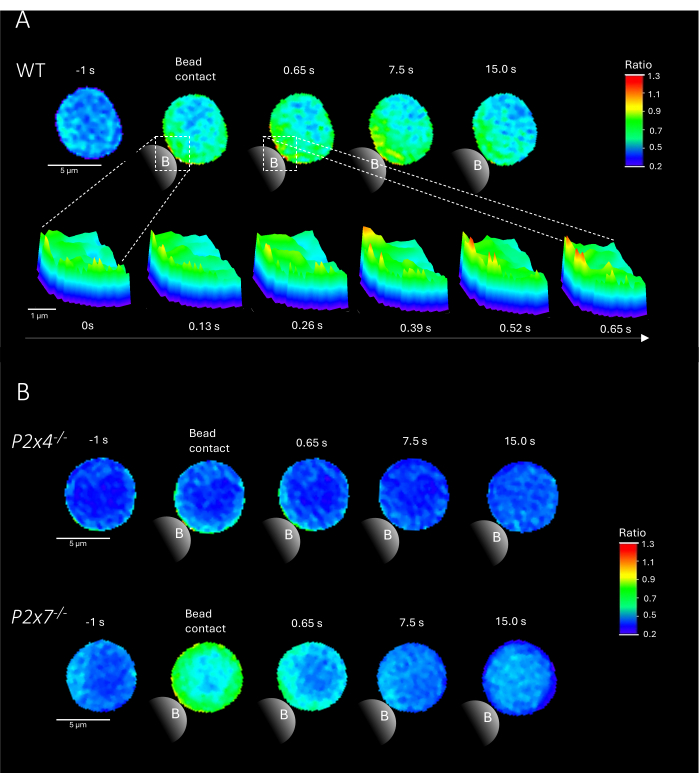
Figure 2: Representative cells of T cell receptor-dependent Ca2+ microdomains in a primary murine wild type (WT) (A), P2x4-/- or P2x7-/- (B) CD4+ T cell. CD4+ T cells were negatively isolated and loaded with Fluo-4 AM and Fura Red, as described above. T cells were analyzed using the DARTS pipeline, resulting in comparable cell images to previously published results9. (A) WT primary T cell 1 s before stimulation with anti-CD3/anti-CD28 coated beads and up to 15 s after stimulation (scale bar 5 µm), as well as 3D surface plot of a zoom-in from 0 s to 0.65 s in the bead contact region (scale bar 1 µm). (B) Upper lane: representative P2x4-/- primary T cell 1 s before and up to 15 s after bead stimulation. Lower lane: representative P2x7-/- primary T cell 1 s before and up to 15 s after bead stimulation. Please click here to view a larger version of this figure.

Figure 3: Ca2+ microdomains in a representative primary human T cell after TCR stimulation. Primary human CD4+ T cells were isolated from peripheral blood mononuclear cells (PBMCs) by fluorescence-activated cell sorting (FACS) from buffy coats and loaded with Fluo-4 AM and Fura Red, as described above. The figure shows a primary human T cell 1 s before stimulation with anti-CD3 coated beads and up to 15 s after stimulation (scale bar 5 µm), as well as 3D surface plot of a zoom-in from 6.25 s to 7.5 s in the bead contact region (scale bar 1 µm). Please click here to view a larger version of this figure.
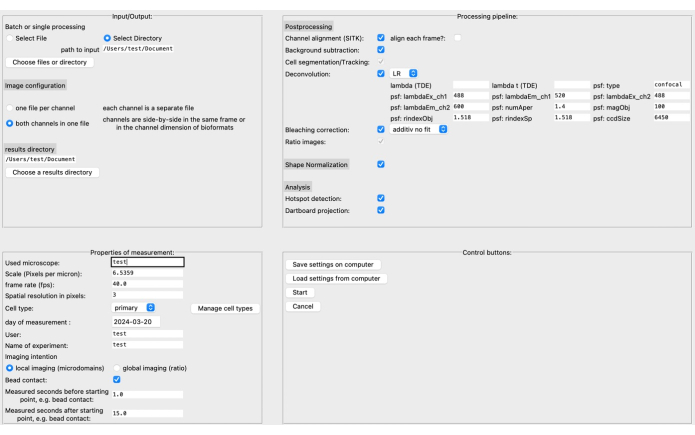
Figure 4: The DARTS graphical user interface (GUI). The GUI is divided into four areas. In the Input/Output area, you need to provide information about the raw data, including the source directory and image configuration (either two channels per file or separate channels), as well as the results directory. In the Properties of Measurement area, the experiment needs to be described with all its relevant information, such as scale (microns per pixel), frame rate, and measurement interval relative to the later determined starting point. Next, a processing pipeline consisting of postprocessing steps, shape normalization, and the actual analysis (microdomain detection and dartboard data accumulation) can be assembled. Finally, the settings can be saved to or loaded from the computer. Once the analysis has been set up, click on Start to proceed. To read more about the setup, visit https://ipmi-icns-uke.github.io/DARTS/General/Usage.html. Please click here to view a larger version of this figure.
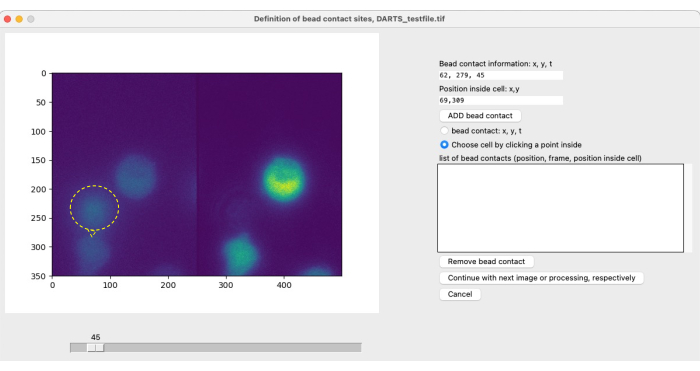
Figure 5: Manual definition of bead contacts. If beads are added to the cells during the experiment, the initial bead contact time with a cell of interest and the contact location have to be manually defined. This is done by scrolling through the frames with the slider and finding a position (x,y) at a time point t. To automatically fill the bead contact information field, the user clicks on the left half of the microscope image at the bead contact position. Next, to associate a cell with the bead contact, the user clicks on a position within the cell that has a bead contact. The information has to be confirmed by selecting ADD bead. Please click here to view a larger version of this figure.
Discussion
We described an extensive protocol for high-resolution live cell imaging of local Ca2+ microdomains in primary murine and human T cells triggered by TCR/CD3 stimulation through antibody-coated beads. Moreover, we implemented a user-friendly and open-source Python-based algorithm to identify and analyze local Ca2+ signals. Notably, the protocol is not limited to the detection of Ca2+ microdomains in the context of TCR/CD3 stimulation but is adaptable to other (immune) cell types such as NK cell lines (KHYG-1)12 or TCR-independent Ca2+ microdomains10,11.
A critical step within the protocol is the size and number of the stimulating beads. To mimic an immune-synapse, the beads should be similar in size to the cells. Hence, for primary murine and human T cells as well as cell lines (Jurkat and KHYG1), we use magnetic beads with a diameter of 10 µm. Furthermore, each cell should be just stimulated by one single bead. Therefore, the number of beads added to each slide should be sufficient on the one hand, but if there are too many beads in the field of view, the background increases, and it is not possible to detect a single activation time point and contact side.
The protocol utilizes the fluorescent Ca2+ dyes Fluo-4 AM and FuraRed AM in a ratiometric manner, therefore allowing for calibration of the data13. Additionally, the protocol could be adapted to other Ca2+ indicator pairs, but caution must be taken in the selection process in terms of Ca2+ binding kinetics, subcellular distribution, and photobleaching1. Moreover, loading conditions must be developed and optimized for each individual cell type, but the concentrations indicated here are a good starting point. To visualize Ca2+ microdomains, the Kd of the Ca2+ dyes should be in the range of 300-1200 nM and the acquisition time per frame should be ≤60 ms. If the fluorescence intensity is too low, the filter set has to be checked, but it is also possible to load a double amount of Ca2+ dye into T cells. However, the Ca2+ dye could mislocate to other organelles or sequester to vesicles, but it might also act as a Ca2+ buffer and affect the Ca2+ responses.
One limitation of the analysis algorithm is that a spherical shape of the cell is assumed; hence, cell types with different morphologies might need adaption of the analysis toolbox. The algorithm has been used to analyze local Ca2+ microdomains in primary murine T cells, as well as Jurkat T cells and an NK cell line (KHYG-1)12 and was successful in the analysis of Ca2+ microdomains for a murine neuronal cell line (N2a, unpublished data). In principle, the protocol and analysis toolbox could be used to analyze non-spherical cell types such as HEK293 or HeLa cells, but for these cell types, the dartboard projection cannot be adapted because it is based on a round structure and shape normalization of the cells. In addition, the protocol to detect localized initial Ca2+ microdomains upon bead stimulation can be adapted to analyze local Ca2+ signals derived from other stimuli, such as soluble activating or inhibiting compounds, as well as adhesion-dependent and TCR/CD3 independent Ca2+ microdomains10,11. Of note, it is easier to define a single bead contact in terms of time and location than to determine the starting point of activation after soluble compounds.
A general limitation for the detection of Ca2+ microdomain formation lies in the required high temporal-spatial resolution and necessary high signal-to-noise ratio (SNR). Currently, the resolution derived from our setup reaches a calculated spatial resolution of ~0.368 µm and temporal resolution of ~40 frames per second (fps)1. Recent advances in camera and detector development, as well as improvement of fluorescent dyes, might lead to the possibility of reaching optical single channel recordings as they have been described for ORAI-GECI (genetically expressed Ca2+ indicators) constructs24 for live cell imaging using Ca2+ indicators with higher temporal and spatial resolution in the future.
Taken together, the protocol and analysis tool for high-resolution Ca2+ microdomain imaging described here can be used not only to analyze initial local Ca2+ signals in T cells but can also be adapted to other cell types to decipher the significance of local Ca2+ signaling in these.
Disclosures
The authors declare that the research was conducted in the absence of any commercial or financial relationship that could be considered a potential conflict of interest.
Acknowledgements
This work was supported by the Deutsche Forschungsgemeinschaft (DFG) (project number 335447717; SFB1328, A02 to B-PD and RW; A14 to ET; project number 516286863 to B-PD). The authors thank the blood donors and the Department of Transfusion Medicine at the UKE for their cooperation.
Materials
| Name | Company | Catalog Number | Comments |
|---|---|---|---|
| α-CD3 | BD Pharmingen | 553058 | |
| α-CD28 | BD Pharmingen | 553295 | |
| Anaconda | Anaconda | https://docs.anaconda.com/free/anaconda/install/index.html | |
| Bovine serum albumin | Sigma-Aldrich | A2058 | |
| Cell strainer | Biofil | CSS-013-070 | 70 µm diameter |
| Countess Automated Cell Counter | Invitrogen | A49865 | |
| Cover slips | Paul Marienfeld GmbH | 101202 | |
| DARTS | GitHub | https://github.com/IPMI-ICNS-UKE/DARTS | |
| Dulbecco’s Phosphate buffered saline | Gibco, Thermo Fisher | 14190144 | |
| EasySep CD4+ T cell Isolation Kit | Stemcell | 19852 | |
| EasySep Magnetic Multistand | Stemcell | 18010 | |
| Fluo 4-AM | Invitrogen | F14201 | |
| Fura Red-AM | Invitrogen | F3020 | |
| Gibco RPMI 1640 medium | Gibco, Thermo Fisher | 11875093 | |
| Git | GitHub | https://git-scm.com/book/en/v2/Getting-Started-Installing-Git | |
| immersion oil | Leica | 11513859 | |
| Newborn calf serum | Sigma-Aldrich | N4637 | |
| Oracle | Oracle | https://www.oracle.com/de/java/technologies/downloads/ | |
| Penicillin/Streptamycin | Gibco, Thermo Fisher | 15240062 | |
| Poly-L-lysine | Sigma-Aldrich | P4707 | |
| Protein G magnetic beads | Merck | LSKMAGG02 | 10 µM diameter |
| Python | Python | https://www.python.org/downloads/ | |
| Silicon grease (basylone) | Bayer | 291-1220 | |
| Time-Dependent Entropy Deconvolution | GitHub | https://ipmi-icns-uke.github.io/TDEntropyDeconvolution/General/2-usage.html#input-parameters | |
| Tween | q-biogene | TWEEN201 |
References
- Wolf, I. M. A., et al. Frontrunners of T cell activation: Initial, localized Ca2+ signals mediated by NAADP and the type 1 ryanodine receptor. Sci Signal. 8 (398), 102(2015).
- Taguchi, T., Mukai, K. Innate immunity signalling and membrane trafficking. Curr Opin Cell Biol. 59, 1-7 (2019).
- Trebak, M., Kinet, J. -P. Calcium signalling in T cells. Nat Rev Immunol. 19 (3), 154-169 (2019).
- Diercks, B. -P., et al. ORAI1, STIM1/2, and RYR1 shape subsecond Ca2+ microdomains upon T cell activation. Sci Signal. 11, 0358(2018).
- Cheng, H., Lederer, W. J., Cannell, M. B. Calcium sparks: Elementary events underlying excitation-contraction coupling in heart muscle. Science. 262 (5134), 740-744 (1993).
- Feske, S. Calcium signalling in lymphocyte activation and disease. Nat Rev Immunol. 7 (9), 690-702 (2007).
- Berridge, M. J., Lipp, P., Bootman, M. D. The versatility and universality of calcium signalling. Nat Rev Mol Cell Biol. 1 (1), 11-21 (2000).
- Kummerow, C., Junker, C., Kruse, K., Rieger, H., Quintana, A., Hoth, M. The immunological synapse controls local and global calcium signals in T lymphocytes. Immunol Rev. 231 (1), 132-147 (2009).
- Brock, V. J., et al. P2X4 and P2X7 are essential players in basal T cell activity and Ca2+ signaling milliseconds after T cell activation. Sci Adv. 8 (5), 9770(2022).
- Weiß, M., et al. Adhesion to laminin-1 and collagen IV induces the formation of Ca2+ microdomains that sensitize mouse T cells for activation. Sci Signal. 16 (790), 9405(2023).
- Diercks, B. -P. The importance of Ca2+ microdomains for the adaptive immune response. Biochim Biophys Acta Mol Cell Res. 1871 (5), 119710(2024).
- Woelk, L. -M., et al. DARTS: an open-source Python pipeline for Ca2+ microdomain analysis in live cell imaging data. Front Immunol. 14, 1299435(2024).
- Diercks, B. -P., Werner, R., Schetelig, D., Wolf, I. M. A., Guse, A. H. High-resolution calcium imaging method for local calcium signaling. Methods Mol Biol. 1929, 27-39 (2019).
- Python. Python. , Available from: https://www.python.org/downloads/ (2024).
- Anaconda. Anaconda. , Available from: https://docs.anaconda.com/free/anaconda/install/index.html (2024).
- git. git. , Available from: https://git-scm.com/book/en/v2/Getting-Started-Installing-Git (2024).
- DARTS. DARTS. , Available from: https://github.com/IPMI-ICNS-UKE/DARTS (2024).
- DARTS. DARTS GitHub Repository. , Available from: https://ipmi-icns-uke.github.io/DARTS/ (2024).
- Oracle. , Available from: https://www.oracle.com/de/java/technologies/downloads/ (2024).
- Time-Dependent Entropy Deconvolution. , Available from: https://ipmi-icns-uke.github.io/TDEntropyDeconvolution/General/2-usage.html#input-parameters (2024).
- Gu, F., et al. Dual NADPH oxidases DUOX1 and DUOX2 synthesize NAADP and are necessary for Ca2+ signaling during T cell activation. Sci Signal. 14 (709), 3800(2021).
- Roggenkamp, H. G., et al. HN1L/JPT2: A signaling protein that connects NAADP generation to Ca2+ microdomain formation. Sci Signal. 14 (675), 5647(2021).
- Heßling, L. D., Troost-Kind, B., Weiß, M. NAADP-binding proteins - Linking NAADP signaling to cancer and immunity. Biochim Biophy. Acta Mol Cell Res. 1870 (7), 119531(2023).
- Dynes, J. L., Amcheslavsky, A., Cahalan, M. D. Genetically targeted single-channel optical recording reveals multiple Orai1 gating states and oscillations in calcium influx. Proc Natl Acad Sci U S A. 113 (2), 440-445 (2016).
Reprints and Permissions
