Modeling erythropoiesis provides a valuable chance to comprehend the biological significance of actors in this process and to evaluate novel therapeutic approaches that may alleviate differentiation defects. Here, we describe a simple and reliable method to efficiently differentiate CD34+ hematopoietic stem and progenitor cells ex vivo.
Method Article
A Comprehensive Pipeline to Assess the Efficiency of Human Erythropoiesis In Vitro and Ex Vivo
In This Article
Summary
Abstract
Erythropoiesis, a remarkably dynamic and efficient process responsible for generating the daily quota of red blood cells (approximately 280 ± 20 billion cells per day), is crucial for maintaining individual health. Any disruption in this pathway can have significant consequences, leading to health issues. According to the World Health Organization, an estimated 25% of the global population presents symptoms of anemia. This protocol describes how to generate human erythroid cells both in vitro using hematopoietic stem and progenitor cells (HSPCs) from sources such as umbilical cord blood (UCB) or blood taken from healthy donors and ex vivo with HSPCs isolated from patients' bone marrow. Using genetic approach, genes of interest can be modulated in HSPCs, and their impact on erythropoiesis can be monitored at various stages of the differentiation process. This method allows for the screening of compounds perturbing, enhancing, or rescuing the capacity of HSPCs to differentiate into mature erythroid cells and to investigate the role of genes of interest during the erythroid differentiation process.
Introduction
Every day about 280 billion red blood cells (RBCs) are produced in the bone marrow to ensure oxygen transport throughout the entire body1. Erythropoiesis is a finely tuned differentiation process that produces mature, functional red blood cells from hematopoietic stem cells. Many diseases, both acquired and congenital, can affect this process, including myelodysplastic syndrome, aplastic anemia, thalassemia, and congenital dyserythropoietic anemia2.
The clinical manifestation of disrupted erythropoiesis is anemia, a major cause of morbidity worldwide. Symptoms of anemia range from fatigue, shortness of breath, and dizziness to life-threatening conditions, such as heart failure and cardiac arrest3.With anemia affecting 1.8 billion people worldwide4, modeling erythropoiesis ex vivo in order to investigate these conditions and their underlying mechanisms remains a global priority. The method described here aims to provide a simple and robust model for studying both healthy and diseased erythroid differentiation. This model allows for the dissection of the roles of specific genes in this process and enables the testing of compounds that could benefit anemic patients. Historically, modeling ineffective erythropoiesis has had many challenges, including a paucity of stem cells in some diseased bone marrows and difficulties mimicking the bone marrow niche.
Previous studies have used similar or more complex protocols; for instance, Bondu et al. used a cocktail of cytokines including erythropoietin (EPO), stem cell factor (SCF), and interleukin-6 (IL6) for 4 days before removing IL6 from the cocktail of erythroid differentiation, in contrast, Yip et al. only added EPO to their cytokines cocktail after 7 days of liquid culture. Elvarsdóttir et al. developed a three-dimensional (3D) culture model for CD34+ cells to facilitate the highest expansion and maturation of erythroid cells, including the generation of erythroblastic islands and enucleated erythrocytes, which are important to study phenomena such as ring sideroblasts5,6,7,8. This protocol uses only three cytokines when expanding the cells (i.e., SCF, thrombopoietin [TPO], and FMS-like tyrosine kinase 3 [FLT3]) and three cytokines maintained throughout the whole process of differentiation (i.e., EPO, IGF1, and SCF). One of the key criteria shared across these different studies is the use of CD34+ cells. Although the origin of these cells varies, they are consistently employed across these different protocols. The sources might range from non-invasive collection of UCB to more invasive procedures to obtain adult bone marrow samples that can be harvested either from granulocyte colony-stimulating factor (G-CSF) mobilized patients or bone marrow punctures. In general, liquid culture models are carried over 14 days, while 3D models can maintain cells over longer periods. These protocols are essential for modeling genetic diseases and disruptions in erythropoiesis. Genetic approaches, such as short hairpin RNA (shRNA) knockdowns, can be employed to silence genes of interest and study their roles in erythropoiesis. The impact of gene silencing can then be monitored at various stages of differentiation, providing an ex vivo human model of red blood cell production to study anemia in both health and disease. This protocol includes the transduction of CD34+ cord blood cells with shRNA that constitutively express a reporter gene, such as enhanced green fluorescence protein (EGFP), allowing the samples to be sorted by fluorescence-activated cell sorting (FACS). Cells are then incubated in differentiation media for 2 weeks and monitored by flow cytometry analysis and immunochemistry staining.
Protocol
Research on primary samples was performed in compliance with institutional guidelines (REC reference: 21/EE/0133; IRAS project ID: 283103).
1. Lentivirus production
NOTE Lentiviruses must be produced in a laboratory of biosafety level L2 under sterile conditions. All required PPE for this lab must be worn, including double gloves. Contaminated material is decontaminated with virucide disinfectant prior to disposal in an autoclaved bin. Here, a shRNA scramble (control) harboring an EGFP reporter gene is used to illustrate the process.
Day 1
- Warm gelatin at 37 °C in a water bath until it completely dissolves. Dilute gelatin at 0.1% in phosphate-buffered saline (PBS).
- Coat a 150 mm dish with 2 mL of 0.1% gelatin. Use 2 dishes per virus. Incubate the dishes for 30 min at 37 °C.
- Seed 5 million HEK293T cells per gelatin-coated dish in 20 mL of 10% Dulbecco′s Modified Eagle′s Medium (DMEM) and place the cells in an incubator at 37 °C.
Day 2
- Check that the cells have reached about 50% confluency. Change the medium with 22 mL of 10% DMEM without disturbing the cell layer 2 h prior to transfection.
- Prepare the transfection mix.
NOTE: One transfection mix is prepared per dish, as a larger volume might impact the calcium-phosphate precipitate formation.- Prepare the reaction mix in a 15 mL centrifuge tube as follows: 32 µg of plasmid, 20 µg of PAX (pCMVdR8.74) plasmid, 9 µg of VSVG (pMD.G2) plasmid, and bring the volume up to 1125 µL using H2O.
- Add 125 µL of CaCl2 to the reaction and incubate 5 min at room temperature (RT) on a roller.
- Prepare 1.25 mL of 2x HEPES in a separate 15mL centrifuge tube.
- Add 2x HEPES drop by drop to the reaction mixture while gently vortexing, then place the mixture on a roller for 10 min at RT.
- Dispense the reaction drop by drop on the cells in a spiral pattern and place the cells in an incubator at 37 °C after gently moving the plate in a cross-shape manner to homogenize the medium.
Day 3
- Change the medium with 16 mL of 10% DMEM without disturbing the cell's layer.
Day 4
- Collect the supernatant and store it at 4 °C overnight. Add 16 mL of fresh DMEM to each plate without disturbing the cell layer.
Day 5
- Collect the supernatant and pool with the supernatant from day 4. Filter to eliminate debris with a 0.45 µM filter.
- Transfer each 30 mL (day 4 + day 5) supernatant in a conical tube for ultracentrifugation. Add the tubes in a swing bucket, with adapters for the conical bottom if required.
- Balance the tubes face to face at 0.02 g accuracy and ultracentrifuge at 90,000 x g for 2 h at 4 °C.
- Discard the supernatant and add 200 µL of stem cell medium per tube. Close tubes with parafilm and incubate the tube in a cold room for 2-4 h under agitation.
- Make 20 µL aliquot of each virus and store the vials at -80 °C. Keep 2 µL of each virus and add 400 µL of DMEM.
NOTE: This dilution will be used for titration.
2. Lentivirus titration
NOTE Lentiviruses must be handled in a laboratory of biosafety level L2 under sterile conditions. All required PPE for this lab must be worn, including double gloves. Contaminated material is decontaminated with virucide disinfectant prior to disposal in an autoclaved bin.
- Seed HEK293T in a 24 well plate. Add 50,000 cells/well in 500 µL of 10% DMEM.
NOTE: Use 6 wells per virus and keep one well for untransduced cells. - Perform the transduction. Add in the different wells: 2 µL, 4 µL, 8 µL, 16 µL, 32 µL, and 64 µL of the diluted virus from step 1.13. Homogenize gently.
- Change the medium 24 h later by adding 500 µL of 10% DMEM.
- At day 4 post transduction, prepare cells for flow cytometry.
- Prepare FACS buffer with PBS, 2% fetal bovine serum (FBS), 1% penicillin-streptomycin (P/S), 2 mM ethylenediaminetetraacetic acid (EDTA) and 1/2,000 4′,6-diamidino-2-phenylindole (DAPI).
- Remove the supernatant and add 500 µL of FACS buffer directly with EDTA to each well.
- Detach the cells by pipetting up and down.
- Filter the cells through a 40 µm strainer and transfer them in FACS tubes.
- Determine the percentage of EGFP cells by flow cytometry.
- Set up the following gates:
- Set up DAPI versus side scatter (SSC-A) to exclude dead cells.
- Set up SSC height (SSC-H) versus SSC area (SSC-A) to exclude cell aggregates and select single cells.
- Set up forward-scatter area (FSC-A) versus SSC-A to gate the cells and remove the debris based on size.
- Set up green fluorescence protein (GFP) versus SSC-A to select GFP+ cells.
- Titer the virus.
- Calculate the particle concentration (number of particles/mL) for each condition:
- EGFP cells x Dilution factor virus (200) x Number of seeded cells x1000)/ volume of virus.
NOTE: For example, cells were treated with 64 µL of virus diluted at 1/200. Following flow cytometry analysis, 54% of cells were EGFP+. In those conditions, the titer will be (54% x 200 x 50 000 x 1000)/64 = 8.44 x 10⁷ particles/mL.
3. Transducing CD34+ cells isolated from umbilical cord blood
NOTE This part is performed under sterile conditions. Here, CD34+ UCB cells (purity >85%) are transduced with one shRNA (control) harboring an eGFP reporter. The experiment is performed with three technical replicates. Proportion must be adjusted to the number of samples.
Day 1
- Prepare the following media and buffer:
- Prepare defrosting medium: FBS supplemented with 1% P/S and 10 µg/mL DNAse
- Prepare FACS buffer: PBS supplemented with 1% P/S and 2% FBS (± 10 µg/mL DNAse)
- Prepare stimulation media (in stem cell medium) by adding 150 ng/mL SCF, 150 ng/mL FLT-3, 10 ng/mL IL-6, 25 ng/mL G-CSF, 20 ng/mL TPO, and 1% HEPES.
- Thaw 100,000 CD34+ UCB cells by dipping for 30 s in the water bath at 37 °C. Add 1 mL of defrosting medium dropwise to each vial and then resuspend gently by pipetting up and down.
- Transfer the cell suspension drop by drop in a total of 5 mL defrosting medium gently.
NOTE: To avoid losing cells, keep a 2 mL aliquot of defrosting medium aside that will be used at the end to wash the tip and vial. - Centrifuge for 8 min at 320 x g at RT. Wash cells in 10 mL of FACS buffer + DNAse.
- Centrifuge for 8 min at 320 x g at RT. Resuspend the cell pellet in 2 mL of stimulation media (washing tip and tube with stimulation medium).
- Count the cells using 5 µL of cell suspension and 5 µL of trypan blue.
NOTE: Aim for 75,000 cells total minimum (25,000 cells/condition). - Transfer the 2 mL of cell suspension into a 24 well plate and incubate for ≥4-6 h at 37 °C.
NOTE: All the cells (75,000-100,000) are seeded in one well at this step. - Collect the cells in FACS tubes and top up with 1 mL of stem cell medium. Centrifuge for 8 min at 320 x g at RT.
- Thaw the virus and add the required volume to stimulation media at a multiplicity of infection (MOI) of 30.
- Resuspend the pelleted cells in virus-containing media at 100,000 cells per 100 µL virus into 1 well of a 96-well plate. Add PBS to empty wells and incubate overnight at 37 °C.
Day 2
- Prepare expansion medium (in stem cell medium) by adding 150 ng/mL SCF, 150 ng/mL FLT3-L, and 20 ng/mL TPO.
- Add the full volume of cell suspension from the 96-well plate well to FACS tubes with 1 mL of stem cell medium. Wash the well and the tip with stem cell medium, resulting in the addition of 2 mL stem cell medium to the cell suspension in the FACS tube.
- Centrifuge for 8 min at 320 x g at RT.
- Discard the supernatant and resuspend cells in 2 mL of expansion media. Add the cell suspension into a 24 well plate well (wash the well and tip in the process to obtain a total of 2 mL). Incubate the cells for 4 days at 37 °C.
NOTE: Cell sorting is then performed on day 7.
4. CD34+ EGFP+ Cell sorting and erythroid differentiation
NOTE This part is performed under sterile conditions.
- Prepare the following media and buffer.
NOTE: Media with cytokines have to be prepared freshly:- Prepare FACS buffer by supplementing PBS with 1% P/S and 2% FBS.
- Prepare expansion media (in stem cell medium) by adding 150 ng/mL SCF, 150 ng/mL FLT3-L, and 20 ng/mL TPO.
- Prepare erythrocyte differentiation media (in stem cell medium) by adding 25 ng/mL SCF, 3 U/mL EPO, and 50 ng/mL IGF1.
- Prepare 2x Erythrocyte differentiation media (in stem cell medium) by adding 50 ng/mL SCF, 6 U/mL EPO, and 100 ng/mL IGF1.
- Add the full volume of cells to a separate FACS tube (wash the well and tip in the process with stem cell medium). Centrifuge for 8 min at 320 x g at RT. Resuspend the pelleted cells in 100 µL of FACS buffer.
- Add 5 µL of CD34 Ab/tube and incubate in the dark at 4 °C for 20 min.
- Resuspend the cells in 1 mL of FACS buffer with DAPI (1/2000 dilution in FACS buffer) and centrifuge for 8 min at 320 x g at RT.
- Resuspend cells in 200 µL of FACS buffer with DAPI (1/2000 dilution in FACS buffer) and filter cells through a 40 µM strainer prior to sorting.
- Prepare the beads for control:
- Add 0.5 µL of CD34 antibody (Ab) to 1 drop of beads in 100 µL of PBS and incubate in the dark at 4 °C for 20 min.
- Add 1 mL of PBS. Centrifuge for 8 min at 320 x g at RT. Discard the supernatant and resuspend the cells in 500 µL of PBS.
- Prepare leukemic cell lines for GFP control.
NOTE: Use any available GFP+ cell line as control; beads can be used instead.- Add GFP- cells (2 FACS tubes with 100,000 cells) and GFP+(1 FACS tube with 100,000 cells) in the FACS tube.
NOTE: A total of 3 tubes. - Wash cells in 1 mL of FACS buffer. Centrifuge for 8 min at 320 x g at RT.
- Resuspend 100,000 GFP- cells in 500 µL of FACS buffer (Unstained), 100,000 GFP- cells in 500 µL of FACS buffer with DAPI (1/2000 dilution in FACS buffer) (DAPI stained), and 100,000 of GFP+ cells in 500 µL of FACS buffer (GFP+ cells).
NOTE: Control tubes will be used for gating and compensation settings at the flow cytometer. If the cells used are 100% GFP, GFP- cells can be added to the tube (50,000 GFP- cells and 50,000 GFP+ cells). - Filter the cells through a 40 µm strainer prior to sorting.
- Add GFP- cells (2 FACS tubes with 100,000 cells) and GFP+(1 FACS tube with 100,000 cells) in the FACS tube.
- Set up the following gates:
- Set up DAPI versus side scatter (SSC-A) to exclude dead cells.
- Set up SSC height versus SSC area (SSC-A) to exclude cell aggregates and select single cells.
- Set up forward-scatter area (FSC-A) versus SSC-A to remove the debris based on size.
- Set up GFP versus SSC-A to select GFP+ cells.
- Set up CD34 (PerCP-Cy5.5) versus SSC-A to select CD34+ cells.
- Flip the collection FACS tube prior to cell collection to coat the walls of the tube with FBS.
- Collect cells in the stem cell medium.
NOTE: Aim for 75,000-80,000 cells (25,000 cells x 3) - Centrifuge for 8 min at 320 x g at RT and resuspend cells in 3 mL of erythroid differentiation media.
- Resuspend and then dispense 1 mL per well in 3 wells of a 24 well plate. Fill up all outer wells with PBS.
- Perform a half depletion of media every other day and replace it with a 2x erythrocyte differentiation media.
- To refresh the media, make sure the cells are settled at the bottom of the plate. Gently lean the plate and take out 500 µL of media.
- Refresh by adding 500 µL with a 2x cytokine erythroid differentiation media.
- Transfer the cells on day 6 to a 12 well plate and add 1 mL of media to make a final volume of 2 mL.
5. Analyzing erythroid differentiation by flow cytometry twice a week from day 6 until day 14
- Prepare the following media and buffer.
- Prepare FACS buffer by supplementing PBS with 1% P/S and 2% FBS
- Prepare erythrocyte differentiation media (in stem cell medium) by adding 25 ng/mL SCF, 3 U/mL EPO, and 50 ng/mL IGF1.
- Collect 200 µL cells from each well of the 12 well plate and replace them with 250 µL of 2x erythroid differentiation media. Add 1 mL of FACS buffer to each tube.
- Centrifuge for 8 min at 320 x g at RT. Resuspend the pelleted cells in 100 µL of FACS buffer.
- Add 1 µL of CD71 Ab (1/100), 1 µL of CD34 Ab (1/100), and 1 µL of CD235a Ab (1/100) and incubate in the dark at 4 °C for 20 min.
- Resuspend cells in 1 mL of FACS buffer with DAPI (1/2000 dilution in FACS buffer). Centrifuge for 8 min at 320 x g at RT.
- Resuspend cells in 200 µL of FACS buffer with DAPI (1/2000 dilution in FACS buffer).
- Prepare the beads for control:
- Add 1 drop compensation beads to two tubes in 100 µL of PBS and then add 0.55 µL of a single antibody to each tube to make single stain controls (one for CD34, one for CD71, and one for CD235a).
NOTE: 1 drop is sufficient for both controls. - Incubate in the dark at 4 °C for 20 min. Add 1 mL of PBS.
- Centrifuge for 8 min at 320 x g at RT. Discard the supernatant and resuspend the cells in 500 µL of PBS.
- Add 1 drop compensation beads to two tubes in 100 µL of PBS and then add 0.55 µL of a single antibody to each tube to make single stain controls (one for CD34, one for CD71, and one for CD235a).
- Prepare a leukemic cell line for control.
NOTE: K562 cells express the CD71 marker and can be used as a positive control to set up the FACS.- Add GFP- cells (2 FACS tubes with 100,000 cells) and GFP+ (1 FACS tube with 100,000 cells) cells in the FACS tube.
- Wash cells in 1 mL of FACS buffer. Centrifuge for 8 min at 320 x g at RT.
- Resuspend 100,000 GFP- cells in FACS buffer (unstained), 100,000 GFP- cells in FACS buffer with DAPI (1/2000 dilution in FACS buffer) (DAPI stained), and 100,000 GFP+ cells in FACS buffer (GFP+ cells).
- Set up the following gates:
- Set up DAPI versus side scatter (SSC-A) to exclude dead cells.
- Set up SSC height versus SSC area (SSC-A) to exclude cell aggregates and select single cells.
- Set up forward-scatter area (FSC-A) versus SSC-A to remove the debris based on size.
- Set up CD235a (APC-Cy7) versus CD71 (PE).
- Set up CD34 (PerCP-Cy5.5) versus SSC-A.
- Run a sample of unstained GFP- cells and full-stained cells in order to adjust voltages so that cells sit in the correct place.
- Run beads, GFP+ cells, and DAPI-stained cells. Compensate and apply compensation to the cytometer settings.
- Run the samples and record the events.
6. Analysis of erythroid differentiation by Giemsa staining
- Prepare 5 slide staining jars:
- Prepare a slide staining jar with May-Grünwald's eosin-methylene blue solution 1:1 stock and PBS.
- Prepare a slide staining jar with 2.5 mL of Giemsa stock + 50 mL of PBS.
- Prepare a slide staining jar with distilled water.
- Prepare a slide staining jar with PBS.
- Prepare a slide staining jar with iced cold methanol.
- Collect 100,000 cells for optimum staining, add 1 mL of PBS, and centrifuge 300 x g for 5 min.
- Discard the medium and resuspend in 150 µL of PBS.
- Prepare slides, filter paper, and conical adaptor into a cytocentrifuge and drop cell preparation slowly into the conical adaptor.
- Spin at 800 x g for 3 min. Remove the slides and place them in the methanol slide jar in ice for 15 min.
- Immerse the slides in the May-Grünwald solution for 5 min and agitate occasionally to ensure proper staining.
- Then, immerse the slides in the PBS jar until no stain runs off.
- Immerse the slides in the Giemsa solution for 20 min and agitate occasionally to ensure proper staining.
- Carefully immerse slides with PBS until no stain runs off.
- Allow the slides to remain in PBS for an additional 3 min.
- Immerse the slides quickly in distilled water and air dry at RT.
- Add a drop of synthetic resin on each spot of cells and gently add a coverslip on top.
- Let the slides dry for 1 h at RT and seal the coverslip with nail polish to prevent drying slip.
Results
CD34+ cells from umbilical cord blood or bone marrow are firstly thawed, stimulated and transduced with a GFP-expressing shRNA (Figure 1A). CD34+GFP+ cells are sorted 4 days following transduction, according to the gating strategy illustrated in Figure 1B. Representative results showed the maturation of CD34+ cells after transduction and FACS sorting. Cells are analyzed (1) by flow cytometry at different stages of maturation, using CD71/CD235a9,10,11 staining (Figure 1A); (2) by immunochemistry following a Giemsa staining visualized by microscope.
Erythroid differentiation is characterized by the sequential acquisition of CD71 and CD235a, with the final steps of maturation requiring the loss of CD71. These are well-established, reproducible, and robust markers of erythroid differentiation9,10,11. The CD71/CD235a profile is established by flow cytometry (Figure 1). Here, CD34+ UBC cells were transduced with a shRNA (scramble) expressing GFP. Cells were sorted on CD34+/GFP+ and then cultured in erythroid differentiation media for 14 days. Cells were analyzed by flow cytometry via gating successively on live cells (DAPI-), single cell (SSC-A-SSC-H), cells excluding debris (FSC-A, SSC-A), GFP+ populations, and CD71 (Y axis)/CD235a (X-axis) profile.
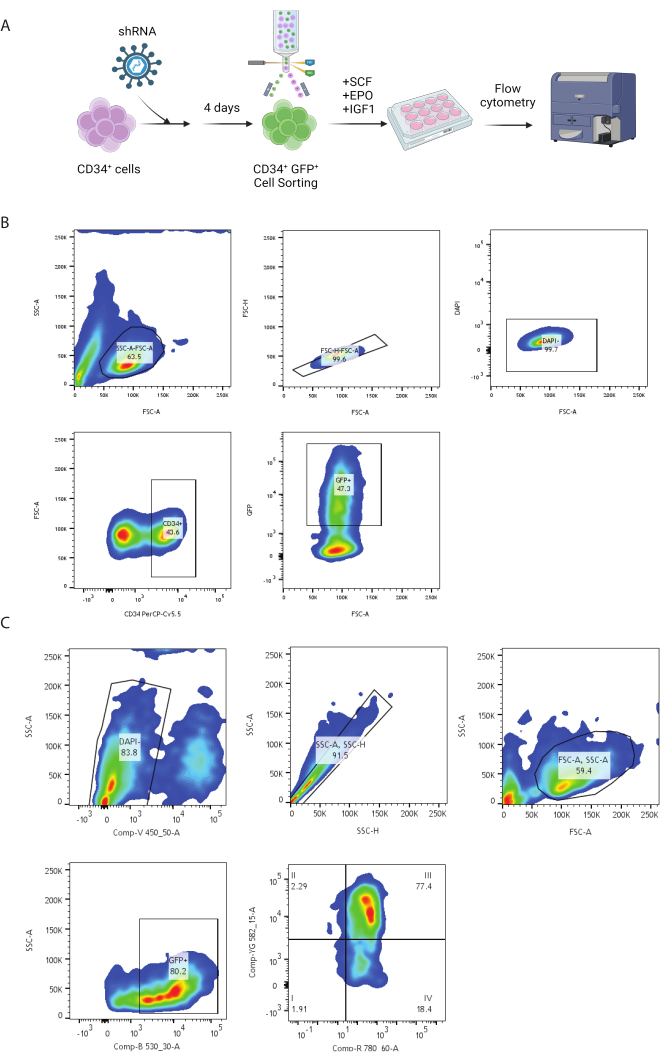
Figure 1: Representative workflow and gating strategy. (A) Schematics of the workflow used for erythroid differentiation. Isolated CD34+ cells are transduced with lentiviral particles and cultured for 4 days prior to FACS sorting. CD34+GFP+ cells are then grown in an erythroid differentiation medium supplemented with SCF, EPO, and IGF1. Flow cytometry is performed to follow the differentiation progress over time. (B) Representation of the gating strategy used for CD34+GFP+ cell sorting. Live cells were gated (DAPI-), single cells (SSC-A, SSC-H), cells excluding debris (FSC-A, SSC-A), CD34+, and then GFP+ cells. (C) Representation of the gating strategy used for the CD71/CD235a analysis by flow cytometry. We successively gated on DAPI- cells, which were gated as single cells (SSC-A-SSC-H). We then cleared the population from small debris (FSC-A, SSC-A) and selected the GFP+ population to assess the CD71/CD235a profile. Please click here to view a larger version of this figure.
The erythroid differentiation kinetic, with CD34+ cells isolated from the umbilical cord or adult healthy donor bone marrow, was compared at days 4, 7, 14, and 17 (Figure 2A,B). A faster differentiation process is usually observed in CD34+ cells from adult bone marrow. The variability between samples is displayed in Figure 2B and is represented by the average and standard deviation of three independent experiments.
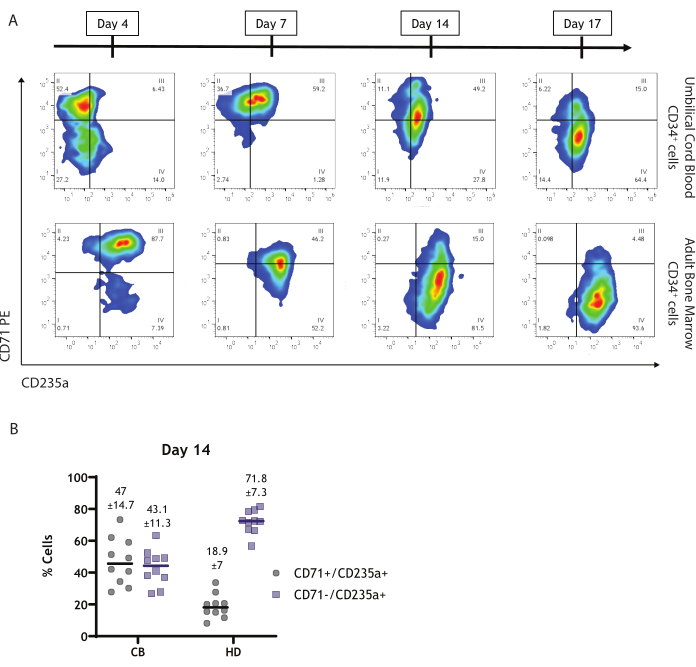
Figure 2: Representative CD71/CD235a flow cytometry plots. (A) The CD71/CD235a profile is assessed at days 4, 7, 14, and 17 of the erythroid differentiation protocol for CD34+ cells isolated from umbilical cord blood (upper panel) or for CD34+ cells isolated from adult bone marrow (bottom panel). (B) CD71+/CD235a+ and CD71-/CD235a+ cells percentage, at day 14 of erythroid differentiation, for 3 individual cord blood samples (CB) and 3 individual adult healthy donors (HD). The average and standard deviation are displayed on the graph. Please click here to view a larger version of this figure.
As differentiated cells eventually undergo apoptosis, we assessed the percentage of Annexin V cells at different time points (Figure 3). CD34+ cells from umbilical cord blood showed an increase in apoptosis by day 17.
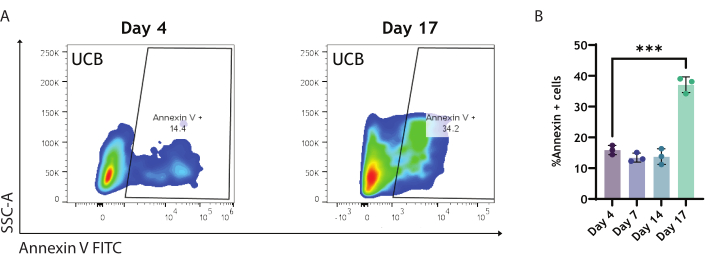
Figure 3: Annexin V flow cytometry plots and quantification. (A) Representative Annexin V flow cytometry plots.(B) The Annexin V percentage of cells is monitored at days 4, 7, 14, and 17 of the erythroid differentiation protocol for CD34+ cells isolated from umbilical cord blood. Please click here to view a larger version of this figure.
In order to determine and compare the different stages of differentiation, we performed a May Grunwald-Giemsa staining (MGG) on erythroid differentiated samples. Here, the staining displayed has been performed at day 14 on cells initially isolated from umbilical cord blood (Figure 4). The staining allows for discrimination of the early basophilic and polychromatic erythroblasts (progenitors) with blue cytoplasm and nucleus from more differentiated orthochromatic erythroblasts that are smaller with a purple cytoplasm and a blue nucleus. The late stage of differentiation is associated with nucleus extrusion and reticulocyte formation, which appear as light pink cells without a nucleus.
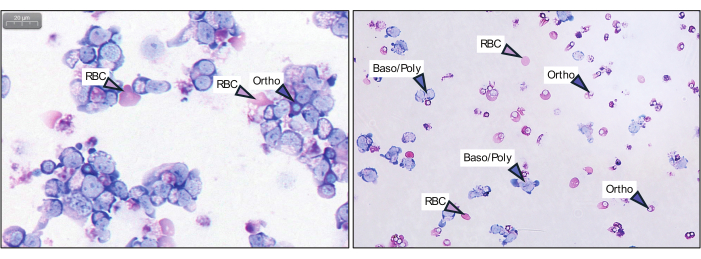
Figure 4: May-Grunwald Giemsa staining. Representative pictures of the May-Grunwald Giemsa staining performed at day 14 of erythroid differentiation with CD34+ cells isolated from umbilical cord blood. Baso/Poly: Basophilic/Polychromatic erythroblasts. Ortho: Orthochromatic erythroblasts. RBC: Red blood cells. Please click here to view a larger version of this figure.
Discussion
Here, we described an efficient and reliable method to induce erythroid differentiation of CD34+ hematopoietic stem cells (HSPCs) isolated either from adult bone marrow (BM) or from umbilical cord blood (UCB). This pipeline includes the editing/modification of primary cells to investigate the function of any gene of interest during the erythroid differentiation process. This method has been successfully used to investigate the functional relevance of genes that were not previously linked to erythroid differentiation12,13,14,15 in healthy CD34+ HSPCs and hematopoietic malignancies such as acute myeloid leukemia and myelodysplastic syndrome. Modeling erythroid differentiation is an asset to understanding the biological relevance of genes in this process and testing new therapeutic strategies that could alleviate differentiation defects.
With this protocol, we also provided robust and reproducible read-outs that can be used during the differentiation process and at endpoints. This includes the CD71/CD235a phenotyping by flow cytometry and a May-Grunwald Giemsa (MGG) staining that allows further characterization of the erythroid differentiation stages. Profiling of CD71/CD235a, revealed that BM CD34+ cells are differentiating faster than the UCB CD34+ cells and suggest a bias towards erythroid lineage in adult HSPCs. Our approach allows the production of mature red blood cells, characterized by nucleus extrusion, visualized with an MGG staining on UCB CD34+ cells undergoing erythroid differentiation.
While other methods require many changes in cytokines during the differentiation process5, 3D modeling using scaffold6, or even IPSCs generation8, we offer an alternative simplified method, requiring only changes in cytokines between expansion and differentiation, and that allows the production of mature red blood cells in less than 20 days. Critical steps include an optimal CD34+ purity (>80%-90%), efficient transduction of the cells, the sort of CD34+GFP+ cells post-transduction, and proper maintenance of the differentiation medium with fresh cytokines added every other day. A possible limitation is the maintenance of differentiated red blood cells that start dying soon after 14 days in culture. This duration is, for example, not compatible with the time necessary to observe ring sideroblasts' formation, which are abnormal erythroid progenitors with iron accumulation that characterize myelodysplastic syndrome with SF3B1 mutations8. The heterogeneity among primary samples is likely to affect the kinetic of differentiation and needs to be carefully monitored when using new samples. Finally, the addition of a step of transduction requires the production of viral particles, a greater number of primary cells at the start, and access to the FACS facility to sort the cells.
Overall, this pipeline offers a simplified, robust, and reproducible assay to assess human erythropoiesis in vitro and ex vivo.
Disclosures
The authors have nothing to disclose.
Acknowledgements
C.P., S.B., and K.RP. were supported by the HARP program, the Barts Charity (G-002167), the Kay Kendall Leukaemia fund (KKL1149) and the Academy of Medical Sciences (SBF004\1099). We thank Dr. Pantelitsa Protopapa for the MGG staining and microscopy acquisition. We also acknowledge the flow cytometry and microscopy facilities of the Barts Cancer Institute, Queen Mary University of London. We thank the UK Charity Anthony Nolan for providing us with the umbilical cord blood units used in this manuscript.
Materials
| Name | Company | Catalog Number | Comments |
|---|---|---|---|
| 2x HEPES | Merck | 51558 | |
| Beads | Thermo Scientific | 01-2222-42 | |
| CD235a APC Cy7 | Biolegend | 349115 | |
| CD34 PerCP Cy5.5 antibody | BD Biosciences | 347222 | |
| CD71 PE antibody | Biolegend | 334106 | |
| DAPI | Merck | D9542 | |
| DMEM | Thermo Scientific | 41966-029 | |
| DNAse | Merck | D4527-200KU | |
| DPX mounting medium | VWR | 1.00579.0500 | |
| FACSAria Fusion | BD Biosciences | NA | |
| FBS | Merck | F9665 | |
| Gelatin | Merck | G1393 | |
| Giemsa solution | Abcam | ab150670 | |
| HEPES | Merck | H0887-100mL | |
| Human EPO | PeproTech | 100-64 | |
| Human Flt-3 ligand | PeproTech | 300-19 | |
| Human G-CSF | PeproTech | 300-23 | |
| Human IGF1 | PeproTech | 100-11 | |
| Human IL-6 | PeproTech | 200-06 | |
| Human SCF | PeproTech | 300-07 | |
| Human TPO | PeproTech | AF-300-18 | |
| LSRFortessa Cell Analyzer | BD Biosciences | NA | |
| May-Grunwald solution | Generon | 26250-01 | |
| Pannoramic 250 High Throughput Scanner | 3DHISTECH | NA | |
| Penicillin/Streptomycin | Thermo Scientific | 15140-122 | |
| Shandon Cytospin 3 | Thermo Scientific | NA | |
| Stem Cell Medium medium | Stem Cell Technologies | 9655 |
References
- Sender, R., Milo, R. The distribution of cellular turnover in the human body. Nat Med. 27 (1), 45-48 (2021).
- Cazzola, M. Ineffective erythropoiesis and its treatment. Blood. 139 (16), 2460-2470 (2022).
- Silverberg, D. S., Iaina, A., Wexler, D., Blum, M. The pathological consequences of anaemia. Clin Lab Haematol. 23 (1), 1-6 (2001).
- Safiri, S., et al. Burden of anemia and its underlying causes in 204 countries and territories, 1990-2019: results from the Global Burden of Disease Study 2019. J Hematol Oncol. 14 (1), 185(2021).
- Bondu, S., et al. A variant erythroferrone disrupts iron homeostasis in SF3B1-mutated myelodysplastic syndrome. Sci Transl Med. 11 (500), eaav5467(2019).
- Elvarsdottir, E. M., et al. A three-dimensional in vitro model of erythropoiesis recapitulates erythroid failure in myelodysplastic syndromes. Leukemia. 34 (1), 271-282 (2020).
- Yip, B. H., et al. Effects of L-leucine in 5q- syndrome and other RPS14-deficient erythroblasts. Leukemia. 26 (9), 2154-2158 (2012).
- Clough, C. A., et al. Coordinated missplicing of TMEM14C and ABCB7 causes ring sideroblast formation in SF3B1-mutant myelodysplastic syndrome. Blood. 139 (13), 2038-2049 (2022).
- Chao, R., Gong, X., Wang, L., Wang, P., Wang, Y. CD71(high) population represents primitive erythroblasts derived from mouse embryonic stem cells. Stem Cell Res. 14 (1), 30-38 (2015).
- Loken, M. R., Shah, V. O., Dattilio, K. L., Civin, C. I. Flow cytometric analysis of human bone marrow: I. Normal erythroid development. Blood. 69 (1), 255-263 (1987).
- Marsee, D. K., Pinkus, G. S., Yu, H. CD71 (transferrin receptor): an effective marker for erythroid precursors in bone marrow biopsy specimens. Am J Clin Pathol. 134 (3), 429-435 (2010).
- Berastegui, N., et al. The transcription factor DDIT3 is a potential driver of dyserythropoiesis in myelodysplastic syndromes. Nat Commun. 13 (1), 7619(2022).
- Mian, S. A., et al. Vitamin B5 and succinyl-CoA improve ineffective erythropoiesis in SF3B1-mutated myelodysplasia. Sci Transl Med. 15 (685), eabn5135(2023).
- Armes, H., et al. Germline ERCC excision repair 6 like 2 (ERCC6L2) mutations lead to impaired erythropoiesis and reshaping of the bone marrow microenvironment. Br J Haematol. 199 (5), 754-764 (2022).
- Hug, N., et al. A dual role for the RNA helicase DHX34 in NMD and pre-mRNA splicing and its function in hematopoietic differentiation. RNA. 28 (9), 1224-1238 (2022).
Reprints and Permissions
