Neurite outgrowth assays provide a quantitative value about regenerative neuronal processes. The advantage of this semi-automatic software is that it segments cell bodies and neurites separately by creating a mask and measures various parameters such as neurite length, number of branch points, cell-body cluster area, and number of cell clusters.
Method Article
Standardization of a Novel Semi-Automatic Software for Neurite Outgrowth Measurement
* These authors contributed equally
In This Article
Summary
Abstract
Effective live-imaging techniques are crucial to assess neuronal morphology in order to measure neurite outgrowth in real time. The proper measurement of neurite outgrowth has been a long-standing challenge over the years in the neuroscience research field. This parameter serves as a cornerstone in numerous in vitro experimental setups, ranging from dissociated cultures and organotypic cultures to cell lines. By quantifying the neurite length, it is possible to determine if a specific treatment worked or if axonal regeneration is enhanced in different experimental groups. In this study, the aim is to demonstrate the robustness and accuracy of the Incucyte Neurotrack neurite outgrowth analysis software. This semi-automatic software is available in a time-lapse microscopy system which offers several advantages over commonly used methodologies in the quantification of the neurite length in phase contrast images. The algorithm masks and quantifies several parameters in each image and returns neuronal cell metrics, including neurite length, branch points, cell-body clusters, and cell-body cluster areas. Firstly, we validated the robustness and accuracy of the software by correlating its values with those of the manual NeuronJ, a Fiji plug-in. Secondly, we used the algorithm which is able to work both on phase contrast images as well as on immunocytochemistry images. Using specific neuronal markers, we validated the feasibility of the fluorescence-based neurite outgrowth analysis on sensory neurons in vitro cultures. Additionally, this software can measure neurite length across various seeding conditions, ranging from individual cells to complex neuronal nets. In conclusion, the software provides an innovative and time-effective platform for neurite outgrowth assays, paving the way for faster and more reliable quantifications.
Introduction
In sciatic nerves, it is possible to measure axonal regeneration1. Additionally, in vitro studies have shown the feasibility of monitoring axonal outgrowth2,3 to comprehend its various phases, from axonal sprouting to axonal degeneration, in both healthy and injured neurons. By tracking these processes, it is possible to measure parameters such as axonal polarity, initiation, stability, and branching. The last parameter is crucial to understand neuropathic pain perception4,5,6. Similarly, axonal degeneration can be monitored in vivo7 or in vitro8,9. During neurite outgrowth, actin and microtubule cytoskeletal networks stabilize or change according to the needs of the cell10. The actin cytoskeleton reorganizes to allow the formation of the axonal growth cone, and the microtubules re-align into bundles to stabilize the growing neurite11. In order to study neurite outgrowth of central and peripheral neurons in vitro, three common parameters are quantified: total axonal length, maximal distance, and branch points. These parameters are used to study the neuronal outgrowth response to treatment (i.e., neurotrophins, compounds, inhibitors, retinoic acid, siRNA, shRNA) or in genetically modified animals12,13,14. In order to assess if neurons have more elongated neurites and/or more branching, these three parameters allow us to assess the morphology of a neuron. Neurite length measurement is the top-interest parameter in several in vitro experimental setups. From dorsal root ganglia, mainly two types of cultures are performed: dissociated in vitro culture or organotypic culture of whole DRG explants. In either case, neurite length is a gold parameter to assess the outcome of the experiment. In a motor neuron-like cell line (NSC-34), axonal outgrowth and branching are measured after differentiation induced by retinoic acid15,16. In fact, by measuring the neurite outgrowth, it is possible to determine if a specific treatment has worked17, the growth rate18, or the regeneration capacity after an injury procedure19.
How to properly assess neurite outgrowth has posed a significant number of challenges over the years in the research field. However, there is no standardization of neurite length measurements. Some of the most utilized methods for in vitro cell cultures are, for example, the manual NeuronJ plug-in on Fiji18,20 or MetaMorph21,23 and the semi-automatic Neurolucida23,24. Other than manual methodologies, there are automatic methods, too, such as the NeuriteTracer plug-in on Fiji25, HCA Vision software26,27, or WIS-NeuroMath2,28. Other less accurate methodologies rely on the measurement of the overall dimension of the neurons. These methods include the measurement of the vector distance from the cell body to the tip of the longest axon29 or the Sholl analysis30. However, these measurement methods are suitable for very low-density cultures or single neurons. Moreover, all these methodologies are mainly utilized on stained neurons or neurons that are expressing genetically encoded fluorophores (i.e., GFP, Venus, mCherry). The type of neuron and the density of the cell culture deeply affect the choice of measurement methodology. For example, manually segmenting neurons with very intricate and complicated morphologies, such as DRG neurons, can easily become an impossible task. If convoluted neurons are already a challenge to segment, neural nets are completely out of reach for manual approaches due to their highly complex organization.
On the one hand, manual segmentation is very precise because it is performed by human eyes and intelligence; on the other hand, it is really time-consuming. The elevated time expenditure required by manual methods is the main drawback. For this reason, only a few neurons are acquired for analysis, making it less accurate and costly in terms of time. Automatic or semi-automatic approaches, on the other hand, partially reduce the time expenditure. However, they also have some disadvantages. Automatic methods need to be trained in order to work properly, and if the software is not interactive enough with the user, the segmentation can be wrong.
Other than neurite outgrowth measurement, the number of branch points is also valuable information. With manual segmentation, the number of branch points can be calculated, whereas this is not possible with a vector distance. With automatic methods, the number of branch points is usually provided, whereas with the Sholl analysis, it has to be calculated with a mathematical formula.
In this methods paper, we aim to describe the functionality and effectiveness of this semi-automatic software in measuring the total axonal length and other parameters. The machine allows for the automatic acquisition of images at defined time points or for conducting long-term studies (days, weeks, months), preserving a physiological environment for live cells. Measuring neurite outgrowth using phase-contrast time-lapse imaging has the benefit of enabling continuous monitoring of neurite kinetics and growth. Additionally, it is also possible to monitor cell death through the addition in the media of specific dyes that target dead cells31,32,33. Although the software has been released in 2012, we are the first to standardize this methodology in a reproducible and unbiased way for the accurate quantification of neurite outgrowth. However, it is important to note that the software is not included with the purchase of the machine. Despite this additional expense, its use offers significant advantages in measuring total axonal length and other parameters, thereby contributing to research in the field of neuroscience.
Protocol
1. Scanning the vessel on the machine
NOTE: The detection is performed by the built-in Basler Ace 1920-155 µm camera.
- Open the program by clicking Connect to Device and selecting Schedule - To Acquire. Then click the + sign.
- Specify whether the vessel will be scanned repeatedly or only 1x by choosing the option Scan on Schedule or Scan Once Now, respectively.
- Select New to create a brand-new vessel to scan. If a new vessel is not added, create a new scan using one of the options described below.
- Select Copy Current to create a new vessel by copying a vessel from the current schedule. Select Copy Previous to create a new vessel by copying a previously scanned vessel.
- Select Add Scan to restore a previously scanned vessel for additional scans.
- Select the scan type based on the assay and application. For the analysis, select Standard.
- Specify scan settings. Choose one of the Cell-by-Cell options, either None, Adherent Cell-by-Cell, or Non-adherent Cell-by-Cell, and specify the image channels depending on the fluorescent molecules utilized. Select the None option for adult and embryonic sensory neuron cultures. For cell lines, select None or Adherent Cell-by-Cell options.
- Select the microscope objective (4x, 10x, 20x). Acquire with the higher magnification (20x) in primary cultures, while in cell lines, 10x is sufficient.
- Select the type of vessel to scan from the options provided. Indicate the vessel's location in the drawer by selecting its position on the virtual map of the drawer.
- Specify the scan pattern for the image acquisition by selecting the wells to scan. Select the desired number of images per well. An estimation of the scan duration will appear.
- Provide information about the vessel by typing the name and specify the plate map by clicking on the + sign.
- Click Next. Choose the Analysis Type, and click Next. A summary screen of the selected options will appear. If correct, click on Scan Now and the scan will start.
2. Setup for phase contrast image analysis
NOTE: Neurotrack analysis can only be performed on images previously acquired by the machine.
- Select the Scanned Vessel to analyze. Select Launch Analysis. Select Create New Analysis Definition.
- Select Neurotrack. Select Image Channels. Select a representative set of images to perform the analysis on. Select all images for each well to train the algorithm.
- Refine the Analysis Definition settings by adjusting the following parameters.
NOTE: By default, neurites are segmented in magenta, whereas cell bodies in yellow. It is possible to modify the colors as desired.- For cell-body cluster segmentation, adjust the following as described below.
- Segmentation mode: The images' segmentation is done to distinguish cell bodies from background and neurites. Choose between Brightness and Texture. For primary cultures and cell lines select Brightness mode.
- Segmentation adjustment: Use the slider to adjust the segmentation sensitivity toward more background or more cells. It ranges from 0 (Background) to 2 (Cells). It increases or decreases the size of the yellow mask. Move the slider towards 0 (Background) so the size of the yellow mask will gradually reduce leaving space for the magenta mask. The opposite occurs if the slider is moved towards 2 (Cells).
- For cleanup, adjust the following as described below.
- Hole Fill (µm2): Adjust this to remove any hole in the cell body mask smaller than the area specified by the user.
- Adjust size (pixels): Increase (if positive) or shrink (if negative) the yellow mask by the specified number of pixels. It ranges from -10 to +10. Adjust this to add or remove yellow segmentation on the high contrast objects such as dead cells and cellular debris.
- Min cell width (µm): Choose a value to define the size at which cell bodies will be considered as neurites.
- For cell-body cluster filters, adjust the following as described below.
- Area (µm2): Set a minimum and a maximum value of cell body area. Values above and below the set values will not be considered as cell bodies.
- For neurite parameters, adjust the following as described below.
- Filtering: It reduces the masking of small vessel imperfections and debris. Choose between None, Better, and Best options. Choose None only for very clean cultures and vessels. Choose Better for faster processing at the expense of losing detection of very fine neurites. It may be sufficient for cells with thick or high-contrast neurites; also, it can be useful for vessels with many imperfections or debris. Choose Best for longer processing time, but it is the most sensitive filter setting to ensure the detection of very fine neurites.
- Neurite sensitivity: Use to adjust the detection sensitivity. Increase sensitivity to detect finer neurites. It ranges from 0.25 (Less) to 0.75 (More).
NOTE: It increases or decreases the software's sensitivity to recognize neurites. If the slider is moved towards 0.25 (Less), the software will be stricter in its recognition of neurites. Instead, if the slider is moved towards 0.75 (More), the software will be less strict in this detection, and therefore, more imperfections (i.e., cell debris, dirt) will be considered neurites. - Neurite width (µm): Use it to tune the detection to the size of the neurons. It can be 1, 2 or 4. By increasing it, the thinner neurites will not be considered. Set it to 1 for primary adult sensory neuron cultures and 2 for cell lines and embryonic sensory neuron cultures.
- For cell-body cluster segmentation, adjust the following as described below.
- Click Preview Current to visualize the segmented image. The following measurements will be provided for each image: Neurite Length (mm/mm2), Neurite Branch Points (Per mm2), Cell-Body Clusters (Per mm2), and Cell-Body Cluster Area (mm2/mm2).
- Repeat steps 2.3 and 2.4 for all the selected images. Click Next.
- Select the Scan time and well to analyze. Assign a Definition Name and, if needed, Analysis Notes. Click Next > Finish.
3. Setup for immunocytochemistry (ICC) image analysis
- Follow the same steps illustrated from 2.1 to 2.4. Select the Image Channels for neurites and nuclei. Select the Set of images; select All images for each well to train the algorithm.
- Refine the Analysis Definition settings by adjusting the following parameters as described below.
NOTE: By default, neurites are segmented in blue, whereas cell bodies are purple. However, the colors can be modified as desired.- Cell-body cluster segmentation: Use this to segment the image into objects of interest. Estimate the background brightness at every pixel in the image. After the background is found, perform one of the following options.
- No background subtraction: Use this to segment without altering the original picture. Choose between Adaptive or Fixed Threshold. Adaptive: the background is used to find objects but not explicitly subtracted; with this option, it is possible to set the Threshold Adjustment (GCU). Fixed Threshold: objects that are brighter than this threshold are detected in the original image; with this option, it is possible to set the Threshold (GCU).
- Background subtraction: Use this option to subtract the background from the image using a Top-Hat transform, then apply a threshold to it. With this option, set Radius and Threshold. Radius: a disk of this radius is used; the disk should be large enough that it does not fit entirely within any object in the image. Threshold: objects that are brighter than this threshold are detected in the background-subtracted image.
- Cleanup: Use the following option to perform this.
- Hole fill (µm2): Use this to remove any holes in the cell body mask that are smaller than the area specified.
- Adjust size (pixels): Use this to increase (if positive) or shrink (if negative) the purple mask by the specified number of pixels. The range is -10 to +10. It adds or removes purple on high-contrast objects such as dead cells and cellular debris.
- Min cell width (µm): Use this to define the size at which cell bodies will be considered as neurites.
- Cell-body cluster filters: Use the following option to apply the filters.
- Area (µm2): Set a minimum and a maximum value of cell body area. Values above and below the set values will not be considered as cell bodies.
- Neurite parameters: Use the following option to set these.
- Neurite coarse sensitivity: Use this to adjust for neurite brightness. Sensitivity should be increased if the neurites' fluorescence intensity is low. It ranges from 0 (Less) to 10 (More). It increases or decreases the sensitivity of the software to recognize less bright neurites. Optimal values range from 7 to 10; note that if it is set to 10, it is very likely that also background will be considered in the neurite measurement.
- Neurite fine sensitivity: Use this to adjust the detection sensitivity. Sensitivity should be increased to detect finer neurites. It ranges from 0.25 (Less) to 0.75 (More). It increases or decreases the sensitivity of the software to recognize fine and less bright neurites. If the slider is moved towards 0.25 (Less) the software will not consider faint neurites. Instead, if the slider is moved towards 0.75 (More) the software will detect also very faint (almost background) neurites.
- Neurite width (µm): Use this to tune the detection to the size of the neurons. It can be 1, 2 or 4. By increasing it, the thinner neurites will not be considered. Set it on 1 for primary adult sensory neurons cultures, on 2 for cell lines and embryonic sensory neurons cultures.
- Cell-body cluster segmentation: Use this to segment the image into objects of interest. Estimate the background brightness at every pixel in the image. After the background is found, perform one of the following options.
4. Data export
- Open the analysis. Click on Graph Metrics.
- Select the Metric, Timepoints, and Wells of interest.
- Select the grouping option between All, None, Columns, Rows, and Plate Map Replicates.
- Click on Export Data and select the folder of destination and, if needed, other options. A .txt file will be created.
NOTE: The machine will provide a single average value of the chosen metric for each well. Manual annotation is required during the analysis to retrieve single image values.
5. Image export
- Open the vessel. Click on Export Images and Movies.
- Select the export type for the images.
- Select As Displayed to export images as displayed. Click Next and select the Images of Interest for export. Click Next.
- Select the Sequence Type between a Single Movie or Series of Images and the time points of interest. Click Next.
- Adjust the export options as needed and click Next. Set the output folder, file format, and name of the file, then click Export.
- Select As Stored to export images in the raw format. Select the Image Type.
- Select the Timepoints and Wells of interest. Click Next. Set the output folder, file format and name of the file, then click Export.
- Select As Displayed to export images as displayed. Click Next and select the Images of Interest for export. Click Next.
- Image export with the segmentation masks
- Open the analysis. Click on the Icon of Image Layers. Select the Desired Channels Masks (Phase Neurite and Phase Cell-Body Cluster). Follow step 5.2.
Results
The neurite outgrowth measurement algorithm is robustly capable of detecting neurites in both neural networks and single neurons. It generates a yellow mask that segments objects with high contrast, such as cell bodies, cellular debris, dead cells, tissue explants, and shadows. Additionally, a magenta mask appears on neurites of various thicknesses. Neurite length values are provided in mm/mm2, indicating that the axonal length has been divided by the area of the image, which is 0.282739 mm2 and constant for every scanning condition. Therefore, in order to obtain pure values of neurite length in mm, the numbers provided by the software need to be multiplied by the area of the image.
Semi-automatic versus manual method
The software used is a semi-automatic methodology to measure the total axonal length. To assess the accuracy of the software, we conducted measurements on the same neurons using the manual method with the NeuronJ plug-in as well. As depicted in Figure 1, the segmentation mask on the neurons is highly similar between the two methods (Figure 1A).
Additionally, we conducted statistical analysis on the values obtained to examine their correlation. The Spearman correlation analysis yielded a high coefficient r of 0.8526, hence providing strong evidence of the accuracy and precision of the algorithm (Figure 1B). Automatic measurement requires high standards of culture quality based on its cleanliness, density, and purity. The results obtained with semi-automatic segmentation are reproducible and not affected by individual judgment. Unbiased reproducibility is an issue for manual methodologies.
Sometimes, semi-automatic segmentation errors can occur because of different causes. In phase contrast images, dirt in the culture could be detected as neurites by the semi-automatic segmentation. Moreover, the presence of different cell types can disturb the segmentation process. Such issues do not arise with manual segmentation because it is performed by human eyes. Nonetheless, if such issues arise, they can be overcome by using immunocytochemistry images as a control.
Segmentation of neurites
For adult DRG neuron primary cultures, the optimal starting point for a reliable phase analysis is to have neurons uniformly plated in the well and clean culture. If errors occur during seeding and cells concentrate in one spot, as illustrated in Figure 2A-B, the values will be more of an estimation than a close reflection of reality. In such situations, the yellow mask will cover most of the neurites in between cells (Figure 2A-B), thereby resulting in the loss of neurite length. Moreover, the software will be significantly biased in the recognition of neurites, and it is very likely that a magenta mask will appear on objects that are not neurites (Figure 2D). In an optimal image, there should be up to 15 neurons at 20x magnification.
When neurons are correctly plated and the culture is clean, as illustrated in Figure 3A-B, it is advisable to adjust the segmentation slider towards the background (0.5 - 0.7; Figure 3C). This helps to reduce the yellow component that will appear on high-contrast objects in the image, such as branching points that should be in magenta. Moreover, if neurites are bold, a neurite sensitivity between 0.4 and 0.5 should be sufficient to cover most of them (Figure 3C-D).
Another common situation that can arise is a dirty culture with many cell debris and dead cells, as shown in Figure 4A-B. In such conditions, there are many high-contrast objects. Therefore, it is advisable to increase the size of the yellow mask by adjusting the segmentation slider towards the cell or by increasing the adjust size parameter (+1, +2, and so on; Figure 4C). Nonetheless, it would also be useful to decrease the neurite sensitivity slightly to prevent the software from incorrectly identifying as neurites objects that are not neurites as such. (Figure 4C-D).
At times, neurites can appear very thin and pale, as shown in Figure 5A-B, posing challenges for the software to accurately segment them (Figure 5D). In this case, it is advisable to increase the neurite sensitivity to at least 0.6 (Figure 5C). However, bear in mind that the higher the sensitivity, the greater the probability the software will incorrectly mark objects that are not neurites as such (Figure 5D). Some precautions can be taken to prevent the sensitivity bias from increasing too much, for example, by adjusting the segmentation slider towards cells. However, if neurites are too thin to be detected by the software, the neurite length values will be biased regardless.
In the case of immunocytochemistry images, the main issue lies in the background. Apart from the seeding conditions for which the aforementioned rules apply, the primary source of bias is the fluorescence itself. The software effectively recognizes very bright neurites while thinner, less intense neurites are left behind (Figure 6A-B). To prevent loss of neurite length, the neurite fine sensitivity can be increased up to 0.75 (Figure 6C). However, it is strongly advisable to reduce the neurite coarse sensitivity to at least 8-9 to prevent excessive detection bias by considering neurites in the background (Figure 6C-D). If the latter is not reduced, then all the background will be segmented, as depicted in Figure 7.
A common problem with fluorescence acquisition is the scattering of the light. Often, immunocytochemistry images present flashlights in the image, which significantly affect the quality and precision of the analysis (Figure 8A-B). In such a situation, not much can be done to improve the analysis, and values will be more of an estimation. Light scattering interferes with neurite recognition so that only very bright neurites will be detected (Figure 8C-D). Another issue in immunocytochemistry images is the quality of the staining per se. Frequently, due to human errors, axons can be broken (Figure 9A), and cell bodies can be torn away during washes (Figure 9B). These mistakes pose a critical problem as neurite length values lose precision and accuracy. Consequently, the interpretation of biological data is altered, leading to wrong conclusions.
For embryonic cultures, the situation differs. In this type of culture, the presence of glial cells is predominant. Consequently, errors significantly increase as the software also detects the linings of glial cells (Figure 10A-B). To minimize this issue, the segmentation slider should be moved towards cells, typically around values of 1.7-2 (Figure 10C-D). This approach ensures that most of the glial cells are covered by the yellow mask and thus not considered in the neurite length measurement. Another useful tip is to keep the neurite width at 2, as embryonic neurons in culture typically exhibit bipolar or unipolar shapes with thick neurites (Figure 10C-D). This precaution filters out most of the linings of glial cells that usually are very thin. Lastly, be careful not to increase the neurite sensitivity too much; otherwise, what has been filtered out by the neurite width parameter will be included again in the neurite length measurement.
In the case of embryonic cultures, where the glial cell component is predominant, immunocytochemistry might be the better option. By specifically staining neurons, the issue of segmentation of glia is resolved since glia will not be stained, making analysis much easier and more accurate (Figure 11).
Lastly, the software can also be exploited to evaluate the differentiation program of cell lines and/or iPSCs to assess their growth state. Thus, the application of similar parameters and precautions can be used for different goals.
Concerning the differentiation process, the software's robustness has been proved in the NSC-34 cell line (hybrid cell line constituted by mouse neuroblastoma cells and motoneurons derived from the spinal cord of mouse embryos) during the maturation into motoneurons-like cells. As for DRG primary cultures, the optimal starting point for good analysis is uniform cell seeding. The undifferentiated and differentiated cells, upon retinoic acid treatment, can be followed using acquisitions during the entire culture period or as shown in Figure 12, at the last time point.
Indeed, in addition to neurite length, the algorithm also provides the branch point parameter. However, it is important to note that the branch point parameter does not represent the exact number of branch points; rather, it indicates the density of branching in the image as it is expressed in mm/mm2. This measurement is significantly influenced by debris in the culture and seeding concentration. Therefore, the density of neurons in the image and the cleanliness of the culture are crucial factors for obtaining reliable values. If the culture presents many cell debris, not filtered away by the yellow mask, they will be included in the neurite length as well as in the branch point measurement.
Consequently, it is recommended to normalize these values for the cell count, as the number of neurons in the image influences neurite length and branch point measurements.
Segmentation of cell bodies
Among all the parameters provided by the system, there are cell-body cluster and cell-body cluster area. However, these two parameters are not reliable to use as values for cell counting. As illustrated in Figure 4, the software segments high-contrast objects in the yellow mask, including shadows caused by medium movement in the well. Additionally, it also segments dead cells and cellular debris (Figure 4). To obtain a reliable cell count of the growing neurons, a manual method, such as the Cell Counter tool in Fiji (Figure 13), can be utilized.
A summary of the suggested analysis parameters sorted by type of culture is provided in Table 1 for phase images and Table 2 for immunocytochemistry images. Moreover, a summary of the suggested analysis parameters to solve specific issues is provided in Table 3.

Figure 1: Correlation analysis between manual and semi-automatic neurite segmentation. (A) On the left, a representative phase image of a neuron segmented with the NeuronJ plug-in in Fiji. On the right, a representative phase image of a neuron is segmented with the semi-automatic software. (B) A simple linear regression run on 20 neurons was analyzed with both manual and semi-automatic methods. Spearman correlation coefficient r = 0.8526, p**** < 0.0001. Images were acquired 48 h after seeding. Magnification 20x. Scale bar, 50 µm. The figure was created with BioRender. Please click here to view a larger version of this figure.
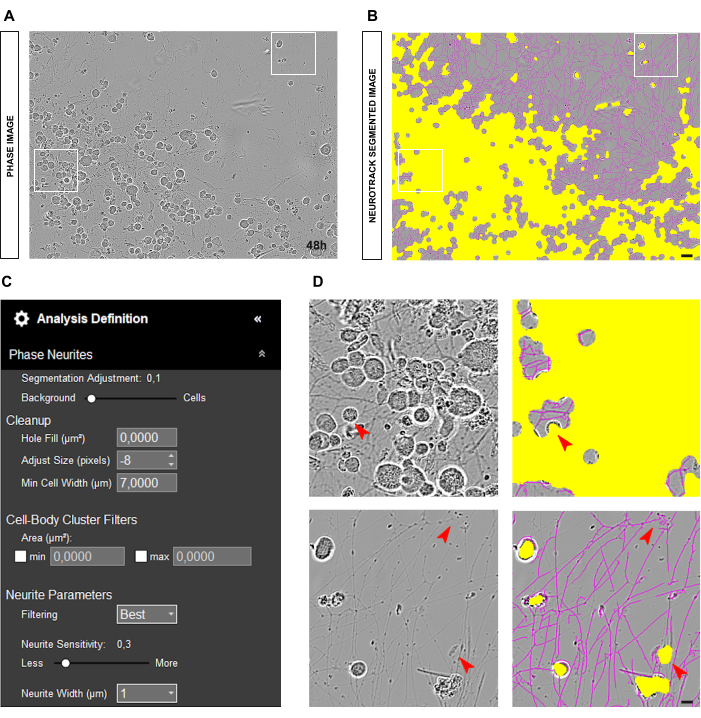
Figure 2: Seeding error in adult sensory neuron culture. (A) Representative phase image of the seeding error. (B) Representative automatically segmented image. The yellow mask segments cell bodies, the magenta mask segments neurites. (C) Illustrative neurite outgrowth analysis definition parameters. (D) Top panel: zoom on the error of cell body segmentation (yellow mask) due to clustering of cell bodies. Bottom panel: zoom on the error of neurites segmentation (magenta mask) due to cellular debris. Images were acquired 48 h after seeding. Magnification 20x. Scale bar, 50 µm. The figure was created with BioRender. Please click here to view a larger version of this figure.

Figure 3: Ideal adult sensory neuron culture for neurite outgrowth analysis. (A) Representative phase image of an ideal seeding condition for neurite outgrowth analysis. (B) Representative automatically segmented image. The yellow mask segments cell bodies, the magenta mask segments neurites. (C) Illustrative neurite outgrowth analysis definition parameters. (D) Zoom on cell body segmentation (yellow mask) and on neurites segmentation (magenta mask). Images were acquired 48 h after seeding. Magnification 20x. Scale bar, 50 µm. The figure was created with BioRender. Please click here to view a larger version of this figure.
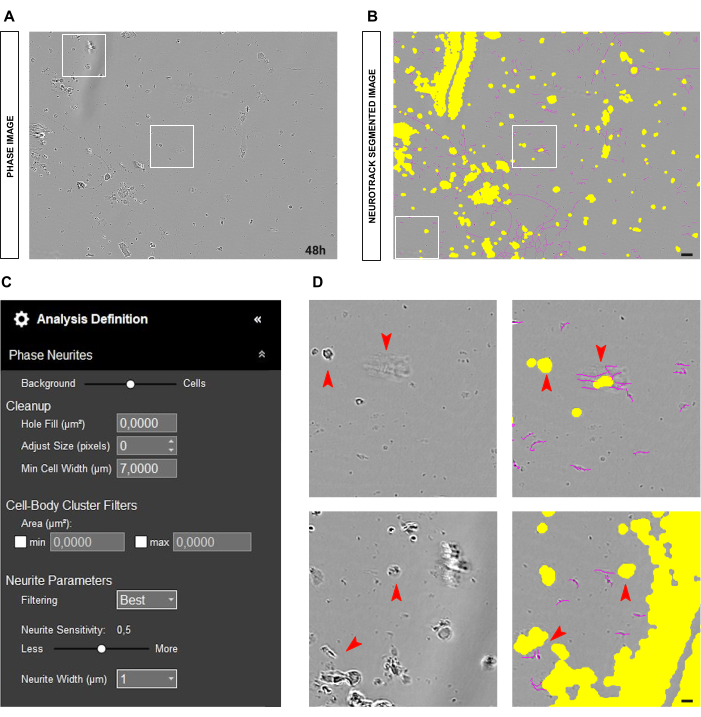
Figure 4: Disturbing elements in neurite outgrowth analysis in adult sensory neurons culture. (A) Representative phase image of cellular debris and shadows due to medium movements. (B) Representative automatically segmented image. The yellow mask segments cell bodies, the magenta mask segments neurites. (C) Illustrative neurite outgrowth analysis definition parameters. (D) Zoom on the error of cell body segmentation (yellow mask) and neurites segmentation (magenta mask) due to cell debris and shadows of the moving medium. Images were acquired 48 h after seeding. Magnification 20x. Scale bar, 50 µm. The figure was created with BioRender. Please click here to view a larger version of this figure.

Figure 5: Thin neurites in neurite outgrowth analysis in adult sensory neurons culture. (A) Representative phase image of neurons characterized by very thin neurites. (B) Representative automatically segmented image. The yellow mask segments cell bodies, the magenta mask segments neurites. (C) Illustrative neurite outgrowth analysis definition parameters. (D) Top panel: zoom on the loss of neurite length due to detection limits of the neurites segmentation (magenta mask). Bottom panel: zoom on the error of neurite segmentation (magenta mask) on foreign objects. Images were acquired 48 h after seeding. Magnification 20x. Scale bar, 50 µm. The figure was created with BioRender. Please click here to view a larger version of this figure.

Figure 6: Neurites' brightness in neurite outgrowth analysis in adult sensory neurons culture. (A) Representative immunocytochemistry image (neuronal marker Tuj1) of neurons characterized by very bright and thick neurites. (B) Representative automatically segmented image. The purple mask segments cell bodies, the blue mask segments neurites. (C) Illustrative neurite outgrowth analysis definition parameters. (D) Top panel: zoom on the cell body segmentation error (purple mask) due to the thickness of the neurites. Bottom panel: zoom on the loss of neurite length due to intense fluorescence brightness of thick neurites. Images were acquired 48 h after seeding. Magnification 20x. Scale bar, 50 µm. The figure was created with BioRender. Please click here to view a larger version of this figure.

Figure 7: Background fluorescence in neurite outgrowth analysis in adult sensory neurons culture. (A) Representative immunocytochemistry image (neuronal marker Tuj1) of high background fluorescence noise. (B) Representative automatically segmented image. The purple mask segments cell bodies, the blue mask segments neurites. (C) Illustrative neurite outgrowth analysis definition parameters. (D) Zoom on the neurite segmentation error (blue mask) due to the interference of the background fluorescence. Images were acquired 48 h after seeding. Magnification 20x. Scale bar, 50 µm. The figure was created with BioRender. Please click here to view a larger version of this figure.
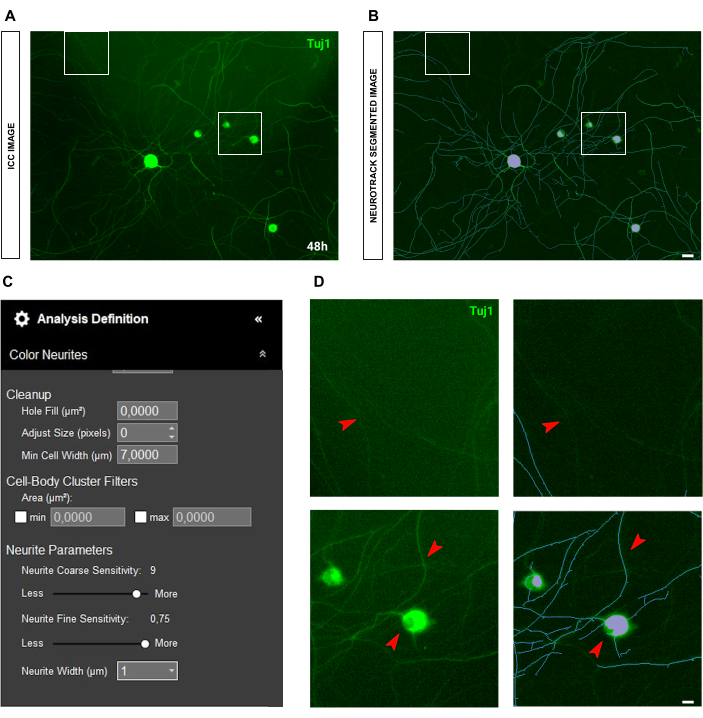
Figure 8: Light scattering in neurite outgrowth analysis of adult sensory neurons culture. (A) Representative immunocytochemistry image (neuronal marker Tuj1) of the light scattering. (B) Representative automatically segmented image. The purple mask segments cell bodies, the blue mask segments neurites. (C) Illustrative neurite outgrowth analysis definition parameters. (D) Top panel: zoom on the loss of neurite length due to the interference of the light scattering. Bottom panel: zoom on the cell body segmentation error (purple mask). Images were acquired 48 h after seeding. Magnification 20x. Scale bar, 50 µm. The figure was created with BioRender. Please click here to view a larger version of this figure.

Figure 9: Quality-affecting errors of the staining procedure interfering with neurite outgrowth analysis of adult sensory neurons culture. (A) On the left, a representative phase image of adult sensory neurons. On the right, a representative immunocytochemistry image (neuronal marker Tuj1) of broken neurites due to washing in the staining procedure. (B) On the left, a representative phase image of adult sensory neurons. On the right, a representative immunocytochemistry image (neuronal marker Tuj1) of cell body removal due to washes of the staining procedure. Images were acquired 48 h after seeding. Magnification 20x. Scale bar, 50 µm. The figure was created with BioRender. Please click here to view a larger version of this figure.

Figure 10: Ideal embryonic (E13.5) sensory neuron culture for neurite outgrowth analysis. (A) Representative phase image of an ideal seeding condition for neurite outgrowth analysis in embryonic sensory neuron culture. (B) Representative automatically segmented image. The yellow mask segments cell bodies, the magenta mask segments neurites. (C) Illustrative neurite outgrowth analysis definition parameters. (D) Zoom on cell body segmentation (yellow mask) and on neurites segmentation (magenta mask). Images were acquired 24 h after seeding. Magnification 20x. Scale bar, 50 µm. The figure was created with BioRender. Please click here to view a larger version of this figure.

Figure 11: Ideal embryonic (E13.5) sensory neuron culture for neurite outgrowth analysis. (A) Representative immunocytochemistry image (neuronal marker Tuj1) of an ideal embryonic sensory neurons culture for neurite outgrowth analysis. (B) Representative automatically segmented image. The purple mask segments cell bodies, the blue mask segments neurites. (C) Illustrative neurite outgrowth analysis definition parameters. (D) Zoom on cell body segmentation (purple mask) and on neurites segmentation (blue mask). Images were acquired 24 h after seeding. Magnification 20x. Scale bar, 50 µm. The figure was created with BioRender. Please click here to view a larger version of this figure.
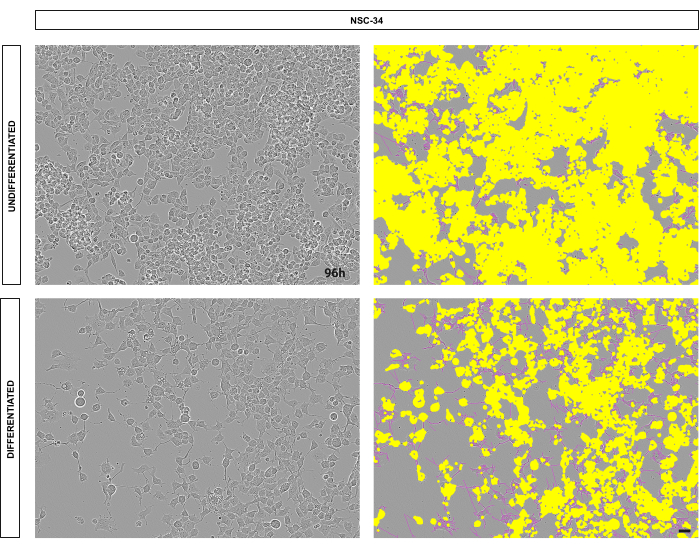
Figure 12: Differentiated NSC-34 cells have increased neurites and branching compared to undifferentiated controls. Representative images of NSC-34 cells. Top panel: undifferentiated NSC-34 cells (control). Bottom panel: differentiated NSC-34 cells after 96 hours of retinoic acid treatment. On the left side of both panels, phase contrast images, while on the right side of both panels, automatically segmented images (soma in yellow, neurites in magenta). Images were acquired 96 h after seeding. Magnification 10x. Scale bar, 50 µm. The figure was created with BioRender. Please click here to view a larger version of this figure.
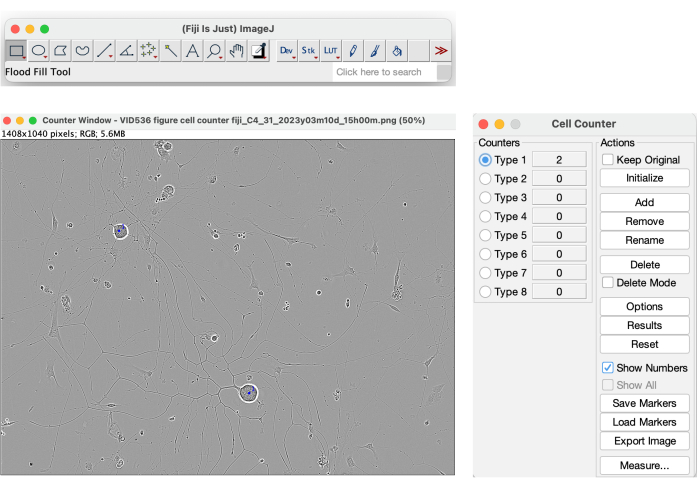
Figure 13: Cell Counter tool on Fiji. Manual cell count performed on a phase image of an ideal seeding condition for neurite outgrowth analysis. Magnification 20x. The figure was created with BioRender. Please click here to view a larger version of this figure.
| Type of Culture | Adult DRG culture (Phase) | Embryonic DRG culture (Phase) | NSC-34 (Phase) |
| Magnification | 20x | 20x | 10x |
| Segmentation Mode | Brightness | Brightness | Brightness |
| Segmentation Adjustment | 0.5 - 0.7 | 1.7 - 2 | 1 |
| Adjust Size (pixels) | 0, +1, +2 | 0, +1 | 0 |
| Filtering | Best | Best | Best |
| Neurite Sensitivity | 0.4 - 0.5 | 0.25 - 0.4 | 0.3 - 0.5 |
| Neurite Width | 1 | 2 | 2 |
Table 1: Summary of suggested analysis definition parameters for adult sensory neuron cultures, embryonic (E13.5) sensory neuron cultures, and NSC-34 cultures in phase contrast images.
| Type of Culture | Adult DRG culture (ICC) | Embryonic DRG culture (ICC) |
| Magnification | 20x | 20x |
| Segmentation Mode | Brightness | Brightness |
| Segmentation Adjustment | 0.5 - 0.7 | 1.7 - 2 |
| Adjust Size (pixels) | 0, +1, +2 | 0, +1 |
| Filtering | Best | Best |
| Neurite Coarse Sensitivity | 8 - 9 | 8 - 9 |
| Neurite Fine Sensitivity | up to 0.75 | 0.5 - 0.75 |
| Neurite Width | 1 | 2 |
Table 2: Summary of suggested analysis definition parameters for adult sensory neuron cultures, embryonic (E13.5) sensory neuron cultures, and NSC-34 cultures in immunocytochemistry images.
| ISSUE | SUGGESTIONS |
| Dirty culture | Adjust the segmentation slider towards cells |
| Increase adjust size parameter (+1,+2…) | |
| Slightly decrease neurite sensitivity | |
| Pale/thin neurites | Increase neurite sensitivity (at least 0.6) |
| Adjust the segmentation slider towards cells. | |
| Thin neurites in ICC | Increase fine neurite sensitivity (up to 0.75) |
| Reduce neurite coarse sensitivity (at least to 8-9) | |
| Glial cells | Adjust the segmentation slider towards cells (1.7-2) |
| Neurite width at 2 |
Table 3: Summary of the suggested analysis definition parameters to solve specific issues in different types of cultures.
Discussion
Accurately measuring how neurons grow in healthy, injured, and diseased conditions is a critical parameter in many experimental setups within the neuroscience field. Whether working with organotypic cultures of whole DRG explants or dissociated cultures, properly measuring axonal outgrowth has been a significant challenge over the last 20 years. Without reliable and accurate quantification of neurite outgrowth, it is impossible to assess if a specific treatment, such as retinoic acid (for 4 days) for NSC-34 cells34 or neurotrophins (for 1-2 days) for embryonic DRG neurons14,35, has been effective. Neurons typically exhibit continuous growth when healthy; however, following injury the axonal growth rate increases12,13. Timing is crucial when measuring axonal growth; therefore, before commencing an experiment, it is essential to conduct a trial test to determine the optimal time for fixing the cells based on their growth rate plateau curve.
The choice of the method, manual or automatic, marks a watershed in terms of time expenditure and accuracy. Some of the most common manual methods include NeuronJ18,20 and Metamorph (Visitron)2,22,28. Manual methods require users to manually trace neurites, which is extremely time-consuming and requires single-cell images. With manual segmentation of neurites, neural networks are completely out of reach. Typically, these methodologies measure only the longest axon or use the vector distance measurement, thereby losing important information such as the number of branch points and the total axonal length. Somewhat of an improvement is provided by the Sholl analysis30, which anyway is limited to single-cell conditions. Single-cell analysis presents several challenges, starting with the seeding of cells. Neurons must be plated at a very low concentration, which may not be the most suitable growth condition for every cell type. Another issue arises from image acquisition. Usually, the confocal microscope is utilized for imaging, which requires trained users and fluorescent neurons and is neither time nor cost-efficient. With the confocal microscope high-resolution images are obtained, but very few neurons get imaged from each experiment. This represents a limitation as more biological replicates are necessary to reach an adequate number of neurons.
Some automatic methodologies such as NeuroMath2,28 solve the issue of the time-consuming neurite segmentation which is performed in an automatic way.
However, due to time constraints, this neurite outgrowth measurement module provides faster results when acquiring images at the time-lapse microscopy machine. The latter, together with this software, significantly improves time and cost efficiency for both students and principal investigators.
The acquisition machine allows the creation of quite a complete map of the well, acquiring a variable number of images based on the diameter of the well. This represents a significant advantage as multiple neurons get imaged at the same time. However, reaching only a 20x magnification is sufficient and suitable to analyze the images with the software. Its power relies in its capability to train on a set of images and perform a semi-automatic measurement of the total axonal length. Additionally, the software can work on both single neurons and neuronal networks. The software is able to segment neurites and cell bodies with two different masks. A yellow mask segments all the high-contrast objects in the image, such as cell bodies, cell debris, and shadows. A magenta mask, instead, segments neurites. The precision and accuracy of the software were proven by the segmentation of the same neurons with both the software and NeuronJ. From the statistical analysis point of view, the values of neurite lengths nicely correlated with a high Spearman correlation coefficient.
After assessing the reliability of the method, we moved to the analysis of various test conditions. For an optimal analysis, some precautions are required. First, neurons have to be uniformly seeded in the well, avoiding spots with high cell concentration. The clustering of neurons causes the software to lose precision in the neurites' detection. Another variable that influences the accuracy and precision of the analysis is the cleanliness of the culture. A clean culture with few cellular debris and dead cells is preferable. However, the software is able to compensate for such issues by modulation of the neurite sensitivity and the cell body segmentation mask. As aforementioned, the yellow mask segments high-contrast objects, among which there are also shadows caused by the movement of the medium in the well. The shadows might cover neurites, thereby resulting in the loss of neurite length. However, such an issue is easily resolved by allowing the medium to settle down before image acquisition.
The algorithm is able to perform neurite length quantification on both phase contrast images and immunocytochemistry images. When fluorescence is involved, other precautions have to be taken in order to obtain a reliable analysis. Firstly, the quality of the staining profoundly influences the outcome of the analysis. If neurites are broken or segmented and cell bodies are torn away during washes, the analysis loses strength and reliability. Additionally, the fluorescence itself represents a potentially disturbing element for the analysis. Since the focus is performed automatically by the machine, the objective puts on focus very bright objects such as artifacts, cell bodies, or thick neurites. As a result, thinner and less bright neurites are left behind, making it difficult for the user to properly measure the neurite length.
As a consequence, the analysis of phase images might be more well-founded compared to the analysis of immunocytochemistry images. The software is capable of working on many different neuronal morphologies from the most intricate and elaborate to the simplest ones, either as single-cells or in neuronal networks. Therefore, it is utilizable in many different research fields, ranging from primary cultures of neurons coming from the central or peripheral nervous system of various developmental stages to iPSC-derived neurons and cell lines such as NSC-34.
Despite the significant potential of the software, some limitations can be noted. Firstly, the precision of cell body segmentation is suboptimal. Consequently, parameters such as cell body cluster and cell body cluster area cannot be reliably used for cell counting. Secondly, in addition to the necessary precautions for optimal neurite segmentation, insufficiently thick axons may be excluded from the neurite length measurement, thereby resulting in data loss.
The branch point parameter encounters issues related to both types of segmentation. Shadows, dead cells, or debris in the culture that localize on branch points obscure them as they get covered by the cell body segmentation. Moreover, in the case of thin neurites, the reliability of the branch point parameter is again severely compromised.
Furthermore, the automatic focus during image acquisition can sometimes be suboptimal. The machine's maximal magnification is limited to 20x, which may be inadequate for observing finer details or fluorescence in slender structures such as neurites. Additionally, the machine performs best with homogeneous plastic substrates. If a glass coverslip is inserted in the well, the focus on the glass may fail, resulting in partially blurred images. However, this software not only applies to neurons but also to completely different fields of research, such as fungal growth36.
All things considered, we believe this neurite outgrowth measurement module to be a reliable tool for measuring neurites quickly, unbiasedly and efficiently.
Disclosures
The authors declare that the research was conducted without any commercial or financial relationships that could potentially create a conflict of interest.
Acknowledgements
We want to thank Alessandro Vercelli for the critical comments and Sartorius's technical support for the help. Our research on these topics has been generously supported by the Rita-Levi Montalcini Grant 2021 (MIUR, Italy). This research was funded by Ministero dell'Istruzione dell'Università e della Ricerca MIUR project Dipartimenti di Eccellenza 2023-2027 to Department of Neuroscience Rita Levi Montalcini. D.M.R.'s research has been conducted during and with the support of the Italian national inter-university PhD course in Sustainable Development and Climate Change (link: www.phd-sdc.it).
Materials
| Name | Company | Catalog Number | Comments |
|---|---|---|---|
| Collagenase A | Merck / Roche | 10103586001 | |
| Dispase II (neutral protease, grade II) | Merck / Roche | 4942078001 | |
| Dulbecco's modified eagle's medium | Merck / Sigma | D5796 | |
| Fetal bovin serum | Merck / Sigma | F7524 | |
| Ham's F-12 Nutrient Mix (1X) | ThermoFisher Scientific | 21765029 | |
| Ham's F12 w/ L-Glutamine | Euroclone | ECM0135L | |
| Hanks' Balanced Salt Solution | Euroclone | ECM0507L | |
| HBSS (10X), no calcium, no magnesium, no phenol red | ThermoFisher Scientific | 14185045 | |
| HyClone Characterized Fetal Bovine Serum (U.S.) | Cytiva | SH30071.03 | |
| Incucyte, Neurotrack Analysis Software | Sartorius | 9600-0010 | |
| L-15 Medium (Leibovitz) | Millipore/Sigma | L5520 | |
| Laminin Mouse Protein, Natural | ThermoFisher Scientific | 23017015 | |
| L-Cysteine | Merck / Sigma | C7352 | |
| Leibovitz's L-15 medium w/o L-glutamine | Euroclone | ECB0020L | |
| mouse NGF 2.5S (>95%) | Alomone Labs | N-100 | |
| Neurobasal Medium [-] Glutamine | ThermoFisher Scientific | 21103049 | |
| NSC-34 | CELLutions Biosystems Inc (Ontario, Canada) | CLU140 | |
| Papain from papaya latex | Sigma | P4762 | |
| Penicillin-Streptomycin (5,000 U/mL) | ThermoFisher Scientific | 15070063 | |
| Percoll (Density 1.130 g/mL) | Cytiva | 17089101 | |
| Poly-D-Lysine Solution (1mg/mL) | EMD Millipore/Merck | A-003-E | |
| Poly-L-Lysine Solution (0-01%) | Sigma | P4832 | |
| Recombinant Human NT-3 | PeproTech | 450-03 | |
| Retinoic Acid | Merck / Sigma | R2625 | |
| Trypsin-EDTA solution | Sigma | T3924 | |
| β-Tubulin III (Tuj1) antibody | Merck / Sigma | T8660 |
References
- Terenzio, M., et al. Locally translated mTOR controls axonal local translation in nerve injury. Science. 359, 1416-1421 (2018).
- Marvaldi, L., et al. Enhanced axon outgrowth and improved long-distance axon regeneration in sprouty2 deficient mice. Dev Neurobiol. 75, 217-231 (2015).
- Kalinski, A. L., et al. Deacetylation of Miro1 by HDAC6 blocks mitochondrial transport and mediates axon growth inhibition. J Cell Biol. 218, 1871-1890 (2019).
- Marvaldi, L., et al. Importin α3 regulates chronic pain pathways in peripheral sensory neurons. Science. 369, 842-846 (2020).
- Gangadharan, V., et al. Neuropathic pain caused by miswiring and abnormal end organ targeting. Nature. 606, 137-145 (2022).
- Testa, L., Dotta, S., Vercelli, A., Marvaldi, L. Communicating pain: emerging axonal signaling in peripheral neuropathic pain. Front Neuroanat. 18, (2024).
- Thongrong, S., et al. Sprouty2 and -4 hypomorphism promotes neuronal survival and astrocytosis in a mouse model of kainic acid induced neuronal damage. Hippocampus. 26, 658-667 (2016).
- Yaron, A., Schuldiner, O. Common and divergent mechanisms in developmental neuronal remodeling and dying back neurodegeneration. Curr Biol. 26, R628-R639 (2016).
- Maor-Nof, M., et al. Axonal degeneration is regulated by a transcriptional program that coordinates expression of pro- and anti-degenerative factors. Neuron. 92, 991-1006 (2016).
- Bromberg, K. D. Regulation of neurite outgrowth by Gi/o signaling pathways. Front Biosci. 13, 4544-4557 (2008).
- Girouard, M. P., et al. Collapsin response mediator protein 4 (CRMP4) facilitates wallerian degeneration and axon regeneration following Sciatic nerve injury. eNeuro. 7, (2020).
- van Erp, S., et al. Age-related loss of axonal regeneration is reflected by the level of local translation. Exp Neurol. 339, 113594(2021).
- Wang, X., et al. Driving axon regeneration by orchestrating neuronal and non-neuronal innate immune responses via the IFNγ-cGAS-STING axis. Neuron. 111, 236-255 (2023).
- Kaselis, A., Treinys, R., Vosyliūtė, R., Šatkauskas, S. DRG axon elongation and growth cone collapse rate induced by Sema3A are differently dependent on NGF concentration. Cell Mol Neurobiol. 34, 289-296 (2014).
- Maier, O., et al. Differentiated NSC-34 motoneuron-like cells as experimental model for cholinergic neurodegeneration. Neurochem Int. 62, 1029-1038 (2013).
- Nango, H., et al. Highly efficient conversion of motor neuron-like NSC-34 cells into functional motor neurons by Prostaglandin E2. Cells. 9, 1741(2020).
- Kim, H., Caspar, W. T., Shah, S. B., Hsieh, A. H. Effects of proinflammatory cytokines on axonal outgrowth from adult rat lumbar dorsal root ganglia using a novel three-dimensional culture system. Spine J. 15, 1823-1831 (2015).
- Frey, E., et al. An in vitro assay to study induction of the regenerative state in sensory neurons. Exp Neurol. 263, 350-363 (2015).
- Zhang, Z., et al. Cerebellar injury and impaired function in a rabbit model of maternal inflammation induced neonatal brain injury. Neurobiol Learn Mem. 165, 106901(2019).
- Pemberton, K., Mersman, B., Xu, F. Using ImageJ to assess neurite outgrowth in mammalian cell cultures: Research data quantification exercises in undergraduate neuroscience lab. J Undergrad Neurosci Educ. 16, A186-A194 (2018).
- Marvaldi, L., Hausott, B., Auer, M., Leban, J., Klimaschewski, L. A Novel DRAK inhibitor, SC82510, promotes axon branching of adult sensory neurons in vitro. Neurochem Res. 39, 403-407 (2014).
- Quarta, S., et al. Peripheral nerve regeneration and NGF-dependent neurite outgrowth of adult sensory neurons converge on STAT3 phosphorylation downstream of neuropoietic cytokine receptor gp130. J Neurosci. 34, 13222-13233 (2014).
- Woitke, F., et al. Adult hippocampal neurogenesis poststroke: More new granule cells but aberrant morphology and impaired spatial memory. PLoS One. 12, e0183463(2017).
- Xiao, X., et al. Automated dendritic spine detection using convolutional neural networks on maximum intensity projected microscopic volumes. J Neurosci Meth. 309, 25-34 (2018).
- Pool, M., Thiemann, J., Bar-Or, A., Fournier, A. E. NeuriteTracer: A novel ImageJ plugin for automated quantification of neurite outgrowth. J Neurosci Meth. 168, 134-139 (2008).
- Wang, D., et al. HCA-Vision: Automated neurite outgrowth analysis. SLAS Disc. 15, 1165-1170 (2010).
- Whitlon, D. S., et al. Novel high content screen detects compounds that promote neurite regeneration from cochlear spiral ganglion neurons. Sci Rep. 5, 15960(2015).
- Rishal, I., et al. WIS-neuromath enables versatile high throughput analyses of neuronal processes. Dev Neurobiol. 73, 247-256 (2013).
- Smith, D. S., Pate Skene, J. H. A Transcription-dependent switch controls competence of adult neurons for distinct modes of axon growth. J Neurosci. 17, 646-658 (1997).
- Gardiner, N. J., et al. Preconditioning injury-induced neurite outgrowth of adult rat sensory neurons on fibronectin is mediated by mobilisation of axonal α5 integrin. Mol Cell Neurosci. 35, 249-260 (2007).
- Hauck, J. S., et al. Heat shock factor 1 directly regulates transsulfuration pathway to promote prostate cancer proliferation and survival. Commun Biol. 7, 9(2024).
- Zhu, Y., et al. Loss of WIPI4 in neurodegeneration causes autophagy-independent ferroptosis. Nat Cell Biol. 26, 542-551 (2024).
- Reggiani, F., et al. BET inhibitors drive Natural Killer activation in non-small cell lung cancer via BRD4 and SMAD3. Nat Commun. 15, 2567(2024).
- Ackerman, H. D., Gerhard, G. S. Bile acids induce neurite outgrowth in NSC-34 cells via TGR5 and a distinct transcriptional profile. Pharmaceuticals. 16, 174(2023).
- Tuttle, R., Matthew, W. D. Neurotrophins affect the pattern of DRG neurite growth in a bioassay that presents a choice of CNS and PNS substrates. Development. 121, 1301-1309 (1995).
- Wurster, S., et al. Live monitoring and analysis of fungal growth, viability, and mycelial morphology using the IncuCyte NeuroTrack processing module. mBio. 10 (3), e00673-e00719 (2019).
Reprints and Permissions
