This study presents a standardized framework for optimizing G. mellonella infection models for use in preclinical antimicrobial assessment. The application of a G. mellonella model as part of a preclinical antimicrobial development pipeline could decrease the number of ineffective compounds progressing to clinical trials.
Method Article
Galleria mellonella as an Antimicrobial Screening Model
In This Article
Summary
Abstract
To combat the rising global issue of antibiotic resistance, the accelerated development of novel antibiotics is essential. Current preclinical antimicrobial development yields a significant number of leads that prove unsuitable either prior to or during clinical trials. To increase the efficiency of preclinical development, relevant, standardized, accessible, and cost-effective models must be developed. Galleria mellonella (greater wax moth) larvae are widely used as an infection model to assess microbial virulence, conduct drug toxicity testing, and serve as a preliminary means of evaluating the in vivo efficacy of novel antimicrobial compounds. These infection models have greater biological relevance than many in vitro screens of comparable throughput and decrease reliance on mammalian models when used as a pre-screen for antimicrobial testing. This protocol describes a standardized methodology for the optimization of G. mellonella infection models, which can be applied to bacterial species and antimicrobial therapeutics of choice. Using the WHO priority pathogen Pseudomonas aeruginosa as an exemplar, we outline steps that can be undertaken to develop a reproducible model of infection and therapeutic testing. This includes recommendations on experimental setup, sample preparation, and infection and treatment protocols. Integration of this model within preclinical antimicrobial development pipelines would decrease reliance on mammalian models, reduce the number of ineffective compounds reaching clinical trials, and ultimately increase the efficiency of preclinical antimicrobial development.
Introduction
Galleria mellonella (the greater wax moth) larvae are used extensively across the biological sciences as infection models for microbial species, and for toxicity testing of novel drug compounds1,2. They have the potential for considerable utility in a preclinical antimicrobial testing pipeline, as they are high throughput, replicate integral in vivo characteristics of human infection, and reduce reliance on mammalian models, in line with the principles of reduction, refinement, and replacement that govern ethical use of mammalian species in research.
Developing new antibiotics requires extensive preclinical testing in vitro and in vivo models prior to clinical validation3. Only a few novel agents with promising preclinical data packages ever translate through to the clinic, and one contributor to this high attrition rate is a failure of preclinical screens to capture the complexities of infection environments4. These issues contribute not only to a low translation rate of antimicrobial agents to the clinic, but also to an increased use of experimental vertebrate animals during late-stage preclinical screening. To improve the preclinical assessment of novel antimicrobials and to reduce the usage of expensive, time-consuming, complex, and ethically problematic murine in vivo models, better early-stage drug screening tools are needed that reduce the number of unpromising compounds progressing through to testing in vertebrate systems.
G. mellonella has a short lifecycle of 8 weeks, comprised of four life stages: egg, larvae, pupae, and adults, of which the larval form is utilized in this protocol1. G. mellonella are easy to maintain throughout an experiment without the requirement for specialist equipment or a dedicated animal research facility. There is no requirement to seek ethical approval for their use, and researchers may breed the organism in-house to improve experimental quality2,5,6,7. The G. mellonella immune system closely resembles that of the mammalian innate immune system, with the ability to respond to 'self' and 'non-self' stimuli8. Haemocytes are responsible for pathogen-associated molecular pattern recognition and subsequent phagocytosis, playing a role that is functionally analogous to that of neutrophils in humans9. G. mellonella encodes three types of toll-like receptors that have been identified by sequence homology to humans, and produce complement-like proteins, which recognize non-self material and form localized melanization complexes following the activation and polymerization of phenoloxidase into melanin10. This can serve as a visual read-out of larval health during infection experiments, as the cuticle is darkened by melanization. It should be noted, however, that the melanization axis in insects, which involves phenoloxidase, differs substantially from the tyrosinase-melanin axis in mammals11,12. Additionally, G. mellonella produces 18 inducible antimicrobial peptides, including lysozyme and defensin homologues13. This similarity, as well as the straightforward larval maintenance procedures and high throughput nature of the model, have made G. mellonella a widely utilized organism in the assessment of novel drugs. In preclinical antibiotic development, G. mellonella has increased utility compared to in vitro models, as they can more accurately model host-pathogen-drug interactions in a complex environment with active immunity.
At present, there is no standardized research-grade supplier of G. mellonella in Europe. Researchers must instead purchase G. mellonella larvae from bait shops or maintain their own colony. Whilst methods for maintaining an in-house G. mellonella colony have been described and can increase experimental consistency5,6,7, this option is likely to be attractive only to those who use the larvae frequently. As such, this protocol focuses on the experimental setup following the purchase of larvae from a live bait supplier. While more accessible, this method increases experimental complexity and can introduce additional variability into assays due to inconsistencies in the health of the larvae at the point at which they are received from suppliers. For academics, industry, and regulators to accept and adopt G. mellonella testing as part of a preclinical antimicrobial development pipeline, a standardized system for optimization and assessment of antimicrobial efficacy is necessary.
This study optimizes the experimental design of a G. mellonella infection model for antibiotic development. While G. mellonella infection models have been described14,15, the present methodology documents additional steps to mitigate the additional complexity introduced by the inconsistency of supply and provides a framework for the assessment of novel antimicrobials. As a test case, G. mellonella was infected with the WHO priority one pathogen Pseudomonas aeruginosa, and treatment with an aminoglycoside agent (tobramycin) was optimized. This framework, illustrated in Figure 1, provides a foundation for future preclinical antimicrobial screening studies with novel agents.
Protocol
In this study, Galleria mellonella (greater wax moth) larvae were selected as a model for antibiotic susceptibility testing and acute toxicity trials. No ethical approval is required for the experimental use of Galleria mellonella. The details of the reagents and equipment used are listed in the Table of Materials.
1. Experimental design
- Determine the appropriate Galleria mellonella larvae group sizes based on the proportional change in larval survival that the study aims to capture. Table 1 details the group sizes required to detect specific percentage changes in survival using a Pseudomonas aeruginosa strain PAO1 infection model.
NOTE: When using a novel pathogen, first determine inter-assay variability in the proportional survival of infected but untreated larvae, as this will influence sample size determination.- Include two groups of PBS controls: one injected before the rest of the infections to ensure the syringe is sharp and fit for use, and another injected during or after bacterial infections to ensure proper sterilization between infection groups. If optimizing with a new pathogen, include a heat-treated control to ensure that death is not the result of an immune response to foreign particles.
NOTE: Insulin syringes could be used for injections, reducing the risks of blunting and contamination. However, experiments may routinely use hundreds of G. mellonella, making the use of insulin syringes costly and wasteful. - For studies optimizing antibacterial treatment, include two additional controls: a group infected with bacteria and then injected with a vehicle 'sham' treatment, and a group injected twice with the vehicle, once at the time of infection for the other conditions and once at the time of treatment.
NOTE: The former is an untreated control, while the latter controls for any trauma caused by the injections. Such trauma is more likely when blunt needles are used.
- Include two groups of PBS controls: one injected before the rest of the infections to ensure the syringe is sharp and fit for use, and another injected during or after bacterial infections to ensure proper sterilization between infection groups. If optimizing with a new pathogen, include a heat-treated control to ensure that death is not the result of an immune response to foreign particles.
- Order G. mellonella from a live bait supplier, or maintain a colony of G. mellonella as previously described5,6,7. For the supplier listed in the Table of Materials, order 1.8 times the planned number of larvae, as approximately 33% will be excluded based on size, and a further 10% may die following cuticle sterilization.
- Determine G. mellonella weight variability prior to experimental use, and ensure that the weight range does not exceed one standard deviation of the mean.
NOTE: For suppliers not listed in the Table of Materials, arrange for the supplier to provide new stock.
- Determine G. mellonella weight variability prior to experimental use, and ensure that the weight range does not exceed one standard deviation of the mean.
- Upon receipt, store G. mellonella at room temperature to limit the chance of cocooning, which occurs following incubation at 37 °C.
NOTE: Not all larvae from commercial suppliers form cocoons, which have previously been used as an indicator of larval health16. - Use larvae within 1 week of receipt, in which case they do not require feeding.
NOTE: Although the larval life stage will vary between batches, most larvae are delivered during the last instar before pupating. In this stage, feeding naturally decreases compared to earlier stages17.
2. Sterilization and selection of G. mellonella larvae
- Weigh Galleria mellonella larvae and discard any that fall outside the range of 224 mg ± 49.2 mg, which is the average weight of the larvae plus or minus one standard deviation. This will result in the exclusion of approximately 33% of the larvae.
NOTE: Weight variation may differ between suppliers. For suppliers not listed in this protocol, calculate an appropriate weight range. - Perform the following steps under aseptic conditions.
- Spray 70% ethanol into a Petri dish, ensuring enough to cover the bottom of the dish.
- Sterilize the surface of G. mellonella in batches of 10-20 larvae.
- Place each batch individually in the dish and spray the larvae twice with 70% ethanol.
- Use tweezers to roll the larvae, ensuring full coverage.
- Remove the larvae from the ethanol and place them in a sterile Petri dish. Leave the dish uncovered to allow the larvae to dry.
CAUTION: Leaving G. mellonella in ethanol for longer than 15 s will result in high mortality.
- Once approximately 90% of the larvae have regained activity after 2 h, separate the recovered larvae into groups of a size that will allow sufficient detection of survival changes according to the power calculations detailed in Table 1.
- Use G. mellonella within 6 h of sterilization.
3. Optimizing bacterial inoculum density
- Prepare a bacterial infection stock of a known CFU/mL prior to infection. Methods for generating stocks will vary by organism. Here, Pseudomonas aeruginosa was grown to mid-log phase in nutrient broth, aliquoted, and frozen at a density of 6 x 10⁷ CFU/mL.
- Pellet the infection stock by centrifuging at 10,000 x g at room temperature for 5 min, and resuspend in PBS. Serially dilute the bacterial stock tenfold to generate a range of inoculum doses of 101-107 CFU per larva, considering that each larva is injected with 10 µL of inoculum.
NOTE: The specific inoculum dose range will differ depending on bacterial virulence, but the proposed range here should be suitable for most pathogenic species. In vitro growth rate determination can help inform the selection of an appropriate dose range, as strain-specific growth rate in liquid culture is correlated with larval mortality. - Before beginning infections, enumerate the inoculum with a Miles and Misra serial dilution to accurately determine inoculum density18.
- Prepare three 1 mL microfuge tubes containing either sterile dH2O, 70% ethanol, or sterile PBS. These will be used continually to sterilize the syringe used to inject the larvae.
- Inspect a sterile 100 µL Hamilton syringe, ensuring the needle tip is sharp and has not developed a hook, which will cause significant trauma to the infection site.
CAUTION: A Hamilton syringe needle tip will begin to warp after approximately 300 infections. If the needle tip is warped, it must be replaced. - Wash the syringe sequentially with dH2O, ethanol, and PBS prior to infections, drawing up and discarding the maximum capacity of the syringe.
- Vortex the resuspended infection inoculum and draw up a maximum of 100 µL into the Hamilton syringe, sufficient to inject 10 µL per larva.
- Inject each larva with 10 µL of inoculum in the rear right proleg. Ensure that the needle penetrates approximately 2 mm into the body.
NOTE: Various methods of infection can be used. These include holding the larva over a pipette tip to expose the prolegs, securing the syringe statically and positioning the G. mellonella by hand, or injecting freehand. - Between each set of infections, sterilize the syringe as detailed in step 2.5 to prevent contamination from residual skin commensals.
- Incubate the infected larvae at a temperature sufficient for microbial growth, between 20 °C and 42 °C, which is an appropriate range for G. mellonella survival5.
- Monitor G. mellonella survival at regular intervals from the time at which mortality is usually first observed to accurately measure the time of death. This must be assessed in an initial screen. Remove any dead larvae and record their time of death.
- Select the optimum infection dose for a therapeutic testing study based on the dose that yields 50% mortality by 18 h and over 80% by 72 h. This allows for the development of a rapid single-day screen while ensuring sufficient virulence and an appropriate therapeutic window.
4. Toxicity testing of novel antimicrobial agents in uninfected larvae
- Assess the toxicity of novel antimicrobials and chosen vehicles in Galleria mellonella prior to their use with experimentally infected larvae. Prepare a broad range of doses exceeding the expected therapeutic range of the antimicrobial, guided by in vitro (e.g., cell line) toxicity data, if available.
- Consider that the larvae will be injected with 10 µL of the therapeutic. Prepare vehicle-only controls at concentrations matching those in which the therapeutic is delivered.
- Inject healthy, sterile G. mellonella in appropriate group sizes with the different antimicrobial and PBS vehicle concentrations, as detailed in steps 3.2-3.10. In the present study, the antimicrobial used was tobramycin.
NOTE: For agent requiring DMSO as a solvent, inject with a 26s gauge needle, rather than the standard 22 gauge needle, as trauma from larger needles increases mortality when using DMSO. - Define a safe dose as one that yields no significant difference in mortality compared to larvae injected with PBS only.
5. Optimizing treatment of G. mellonella bacterial infection with an antimicrobial agent
- Prepare a range of doses of the antimicrobial agent, considering that infected larvae are treated with a 10 µL dose. Use a range of doses with minimal toxicity, as assessed in step 4.
- Follow steps 1 and 2 of this protocol to prepare and infect Galleria mellonella in appropriate groups at the previously optimized infection dose.
- At 2 h post-infection, treat the larvae with the prepared antimicrobial agent or vehicle control solution. Follow steps 3.2-3.8, injecting into the opposite proleg from the one injected during infection. Sterilize the needle between groups.
NOTE: Treatment at 2 h was selected for this optimization to acquire strong dose-response data, from which subsequent optimization of treatment timing was determined19. - Monitor G. mellonella survival at 30 min intervals or more frequently from the time at which mortality is usually first observed. Remove any dead larvae and record their time of death.
- Calculate the change in survival proportions between the treatment groups. Use Kaplan-Meier survival analysis to determine whether treatment leads to significantly altered larval mortality. Include appropriate post-hoc correction for pairwise multiplicity in multi-group analyses.
6. Optimizing treatment timing of infected G. mellonella
- Follow steps 1 and 2 to prepare Galleria mellonella in appropriate groups at the previously optimized infection dose.
- Prepare the antimicrobial agent at the dose previously optimized in step 4.
- At either 2 h, 4 h, 6 h, 9 h, or 12 h post-infection, treat the infected larvae following steps 3.2-3.8 to compare how the timing of treatment impacts mortality.
- Monitor G. mellonella survival at 30 min intervals or more frequently from the time at which mortality is usually first observed. Remove any dead larvae and record their time of death. The optimum timing is the one that maintains the survival observed following the initial optimization of the treatment dose.
NOTE: When testing antimicrobial efficacy in G. mellonella, optimize both treatment dose and timing separately, using the former to inform the treatment dose in the latter.
Results
Assessing batch variation in G. mellonella weight
A potential source of unwanted variation in infection experiments comes from size differences between individual experimental units (i.e., larvae) and across batches. The effects of this variation can be mitigated either by adjusting treatment or infection doses based on weight, or by selecting only those larvae within a defined weight range for use in experiments. The latter adjustment is more pragmatic and is not subject to human error that might arise during dose preparation. An additional advantage of weighing the larvae is that it enables the conversion of treatment doses from those administered to larvae to their mg/kg human equivalents. To quantify variation within and across batches, three batches of 50 larvae, ordered at different times, were weighed. The mean weight in each group was 225.5 mg, 230.54 mg, and 215.86 mg, with standard deviations of 49.1 mg, 53.7 mg, and 44.3 mg, respectively (Figure 2A). Between batches, there was no significant difference in weight. Across batches, weight ranged from 107.5 mg to 341.0 mg, with a mean of 224.0 mg ± 49.2 mg.
To obtain reproducible results, larvae were weighed prior to experimentation and selected if their weight was 224 mg ± 49.2 mg, reducing the range of weight from 233.5 mg to 98.4 mg, and removing 33% of larvae. This is in line with previous work that identified significant variation in survival of larvae infected with MRSA with weight bands greater than 100 mg14,20. We also compared G. mellonella weight at the point of delivery to that at one week post-delivery, as any significant weight change could influence experimental outcomes when larvae are not used immediately upon arrival. The mean G. mellonella weight was 230.54 mg ± 53.7 mg. One week post-delivery, the mean weight was 221.8 mg ± 45.7 mg standard deviation (Figure 2B). There was no significant difference between weight on arrival and weight after one week, from which we conclude that larvae can be used for experimental purposes at any point within the first week from delivery. It is important to note that these results are representative only of G. mellonella purchased from one supplier, and weight may differ significantly between suppliers or when larvae are ordered at different times.
Optimizing inoculum density of P. aeruginosa PAO1
The virulence of five P. aeruginosa isolates at four inoculum densities was assessed, including three commonly used laboratory strains, PAO1, PA14, and PAK, and two clinical isolates from chronic respiratory infection, LESB58, and IST27-M. These were used as part of a CF-relevant strain panel developed by Mahenthiralingam et al.21 and are representative of the global phylogeny of the species. Preliminary growth data in nutrient broth showed a lower growth rate for the isolates from chronic infection (Figure 3). Considering this, G. mellonella were infected in groups of 10 larvae with doses of 101, 102, 103, or 104 CFU/larva in 10μl of PBS for PAO1, PA14, and PAK, and doses of 102, 103, 104, or 105 CFU/larva for LESB58 and IST27-M. Two groups of 10 larvae were also injected with PBS only, one group before and one group after the infections. PBS injections before infections control for contaminated PBS or contamination of needles with microbial species from the Galleria cuticle, while PBS injections after infection control for any contamination of needles with bacteria used in the infection process. Optimal doses for PAO1, PA14, and PAK were 10 CFU/larva, as greater densities resulted in > 50% death by 18 h (Figure 4). 10 CFU was the lowest dose that could be reliably and reproducibly prepared for infection. Higher doses of LESB58 and IST27-M were required to achieve the desired survival kinetics, reflecting the slower growth and lower carrying capacity of these isolates under in vitro conditions (Figure 4). The optimum dose for both was 104 CFU/larvae. LESB58 and IST27-M are clinical isolates from individuals with chronic infections, and LESB58 has previously demonstrated lower virulence in rodent models than PAO122.
Toxicity testing of tobramycin and colistin in Galleria mellonella
Before assessing the efficacy of novel antimicrobial compounds, their toxicity must be assessed by injecting a broad range of clinically relevant doses. This allows compounds with high toxicity to be removed from testing early in the preclinical pipeline. Tobramycin and colistin were assessed against uninfected G. mellonella larvae, as they are commonly administered for the treatment of P. aeruginosa infection in people with cystic fibrosis (pwCF)23. Clinical use of tobramycin ranges from 3 mg/kg daily for severely ill individuals without cystic fibrosis to 11 mg/kg every 24 h for those with cystic fibrosis24,25. These values were used as a guide for dosing in Galleria mellonella, with 1 mg/kg, 2.5 mg/kg, 5 mg/kg, 10 mg/kg, 25 mg/kg, 50 mg/kg, 100 mg/kg, 250 mg/kg tobramycin selected for toxicity testing. No death was observed at any concentration. Considering the lack of toxicity of tobramycin at high concentrations, colistin toxicity was assessed as it has previously been associated with nephro- or neuro-toxicity in 29.8% of pwCF, with a loading dose of 2.9 (±1.5) mg/kg and the overall daily dose of 4.1 (±1.1) mg/kg26. This made it a valuable candidate for toxicity testing, although the organ-specific effects in humans suggested the toxicity may not translate to G. mellonella. Indeed, when doses of 1 mg/kg, 2.5 mg/kg, 5 mg/kg, 10 mg/kg, 25 mg/kg, 50 mg/kg, 100 mg/kg, and 250 mg/kg of colistin were administered, no death of larvae was observed over 72 h. As such, colistin was finally administered at its highest solubility in H2O, at 2000 mg/kg. Death of all larvae was observed within 12 h, confirming that drug toxicity can be assessed in G. mellonella but that caution should be applied when trying to predict forward to human toxicity.
Optimizing treatment dosage of tobramycin against P. aeruginosa PAO1 infection
A range of clinically relevant tobramycin doses were administered to P. aeruginosa-infected larvae to optimize treatment dosage. For novel antimicrobials, the dosage can be initially selected based on the clinical use of similar existing antibiotics or on preclinical data for the novel agent, such as broth minimum inhibitory concentrations. To assess tobramycin efficacy against P. aeruginosa PAO1, G. mellonella larvae were infected with 10 CFU of P. aeruginosa PAO1, as previously optimized, and injected with 1 mg/kg, 2.5 mg/kg, or 5 mg/kg tobramycin at 2 h post-infection. These doses were chosen based on previous G. mellonella work with tobramycin and are in line with current clinical doses of tobramycin in individuals without cystic fibrosis24,27,28.
The threshold for initial success was a 50% increase in G. mellonella survival compared to the untreated controls. PAO1 treatment with 1 mg/kg of tobramycin had little impact on G. mellonella mortality, with 90% death at 28 h post-infection (Figure 5). Treatment with 2.5 mg/kg of tobramycin delayed mortality but yielded 80% mortality overall with 5 mg/kg of tobramycin, resulting in an optimal 90% survival. The effective dose for PA14 was 5 mg/kg, but for PAK was 2.5 mg/kg. The effective dose for IST27-M was higher at 10 mg/kg, while no tested tobramycin concentration was sufficient to rescue the larvae from LESB58 infection. This trend correlated with minimum inhibitory concentration (MIC) values for tobramycin in cation-adjusted Mueller Hinton broth, in which 1 µg/mL was sufficient to inhibit 90% of growth in all strains except LESB58, which had an MIC of 8 µg/mL. As such, initial MIC testing can be used to indicate relative resistance between strains, though it should not be used to determine dose ranges in G. mellonella, which should be optimized separately.
Optimization of tobramycin treatment timing against P. aeruginosa PAO1 infection
Clinical application of antibiotics does not typically occur within hours of infection but days or weeks after. Testing novel antimicrobials in this manner is unachievable in G. mellonella, as high mortality is observed within 24 h of infection with P. aeruginosa PAO1. To increase the relevance of the infection model, novel antimicrobials should be administered as late as possible during the infection. To optimize treatment timings, 5 mg/kg of tobramycin was administered to PAO1-infected G. mellonella larvae at 2 h, 4 h, 6 h, 9 h, and 12 h post-infection. Experimental success was defined as the antibiotic treatment yielding >50% increase in survival compared to infection with PAO1. Treatment at 9 h and 12 h delayed mortality, though it was unable to resolve infection (Figure 6). Treatment at 2 h, 4 h and 6 h yielded survival of over 50%.
Optimisation of G. mellonella group size
Experimental group size was calculated based on variation observed in G. mellonella survival following infection with 10 CFU / larvae of P. aeruginosa PAO1. Group size can differ based on the expected percentage change between the untreated control and treatment group in any study (Table 1). Calculations followed that which is described by Charan et al.29. The equation used is described below.

Where:
 = 1.96 at type 1 error of 5%.
Zβ = 0.842 is the value that provides 80% statistical power.
p1 = The proportion of events in the test group, calculated as p2 + the expected percentage change
p2 = The proportion of events in the control (untreated infection) group, calculated based on P. aeruginosa PAO1 survival variability at  .
.
P = Pooled prevalence, defined as (p1 + p2)/2.

Figure 1: Schematic of a G. mellonella infection study. The general protocol involves preparation of G. mellonella larvae prior to infection, infection with 10 µL inoculum, the optional treatment at a number of hours post-infection, and continuous monitoring. Please click here to view a larger version of this figure.
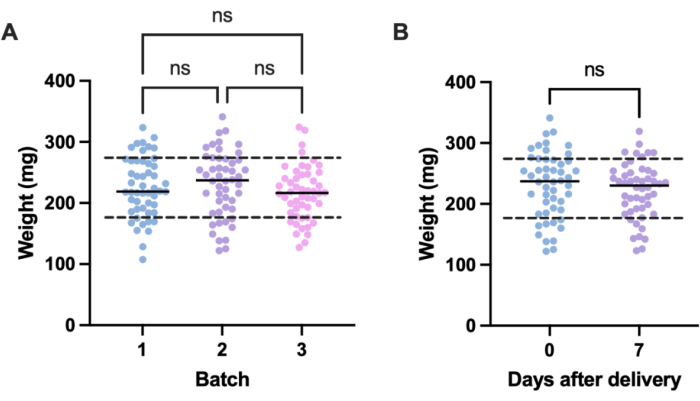
Figure 2: Batch- and time-dependent variation in Galleria mellonella larvae weight. (A) Weight of three batches of 50 Galleria mellonella larvae weighed immediately upon delivery. Each batch was ordered at different times. There was no significant difference in weight across batches as calculated by a one-way ANOVA (P > 0.05). (B) Weight of 50 larvae weighed upon receipt compared to the same batch weighed one week later. There was no significant difference in weight as calculated by a Student's t-test (P > 0.05). ns: Not significant. Please click here to view a larger version of this figure.
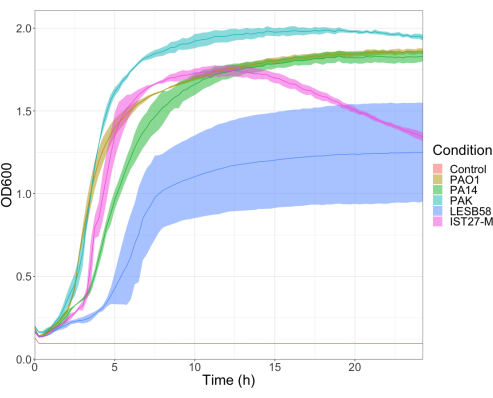
Figure 3: Growth curves of P. aeruginosa strains PAO1, PA14, PAK, LESB58, and IST27-M. Each strain was grown in LB from an initial OD600 of 0.08-0.13, and OD600 was subsequently measured every 15 min during 24 h static growth at 37 °C. Please click here to view a larger version of this figure.
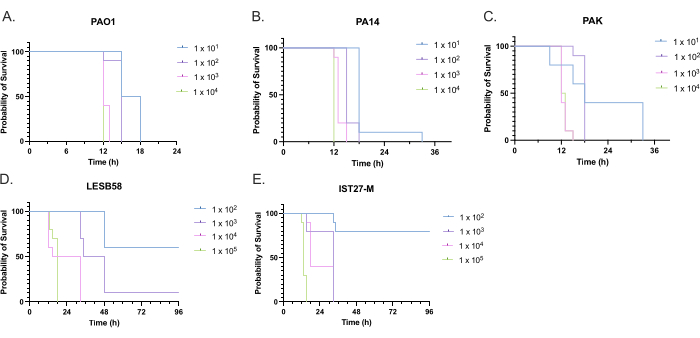
Figure 4: Optimization of inoculum density of Pseudomonas aeruginosa strains for infection of Galleria mellonella larvae. Survival of Galleria mellonella larvae following injection with different densities of colony-forming units (CFU) per larva. The inoculum densities tested were 10, 10², 10³, or 104 CFU per larva for (A) PAO1, (B) PA14, or (C) PAK, and 10², 10³, 104, or 105 CFU per larva for (D) LESB58 and (E) IST27-M. Ten larvae were used per group, each injected with 10 µL of inoculum in the right rear proleg. Survival was monitored every 30 min starting 16 h post-infection, and the time of death was recorded. All strains showed dose-dependent virulence as determined by the Log-rank (Mantel-Cox) test for significance. P < 0.05 for all within-strain dose comparisons except for PAK 101 vs. PAK 102, PAK 103 vs. PAK 104, LESB58 104 vs. LESB58 105, and IST27-M 103 vs. IST27-M 104, which were not significant. This figure is representative of three biological replicates. Please click here to view a larger version of this figure.
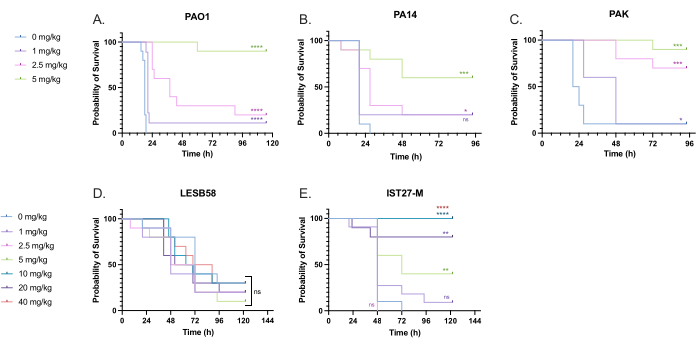
Figure 5: Survival of Galleria mellonella larvae following injection with P. aeruginosa panel strains and treatment with tobramycin sulfate 2 h post-infection. 10 G. mellonella larvae per experimental group were infected with either 10 CFU of (A) PAO1, (B) PA14, or (C) PAK or 103 CFU of (D) LESB58 or (E) IST27-M per larvae in 10 µL of PBS. Infections were administered to the rear left proleg. 2 h post-infection, PAO1, PA14, and PAK were injected with 10 µL of PBS as a no-treatment control, 1 mg/kg, 2.5 mg/kg or 5 mg/kg tobramycin, with LESB58 and IST27-M treated with either 10 µL PBS, 1 mg/kg, 2.5 mg/kg, 5 mg/kg, 10 mg/kg, 20 mg/kg or 40 mg/kg tobramycin, as indicated in the figure. Tobramycin was diluted in distilled water and administered in the rear right proleg. Survival was monitored continuously, and the time of death was recorded. Log-rank (Mantel-Cox) test for significance vs. the PBS control for each strain. ns: Not significant, *P < 0.05, **P < 0.005, ***P < 0.0005 ****P < 0.0001. This figure is representative of three biological replicates. Please click here to view a larger version of this figure.
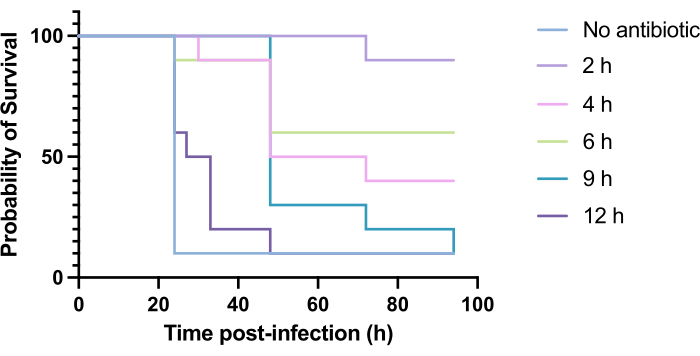
Figure 6: Survival of Galleria mellonella larvae following infection with Pseudomonas aeruginosa PAO1 and subsequent treatment with tobramycin at various time points post-infection. 10 G. mellonella larvae per experimental group were infected with 10 CFU of PAO1 in 10 µL of PBS, injected into the rear right proleg. Larvae were subsequently injected at 2 h, 4 h, 6 h, 9 h, or 12 h post-infection with 5 mg/kg tobramycin sulfate in 10 µL of distilled water in the rear left proleg. Survival was monitored continuously, and the time of death was recorded. Log-rank (Mantel-Cox) test for significance vs. untreated control. ***P < 0.0005, ****P < 0.0001. This figure is representative of three biological replicates. Please click here to view a larger version of this figure.
| Expected change in survival (%) | Group size |
| 30 | 26 |
| 40 | 18 |
| 50 | 13 |
| 60 | 10 |
| 70 | 8 |
| 80 | 6 |
| 90 | 5 |
| 100 | 4 |
Table 1: Group size for G. mellonella survival experiments in which G. mellonella larvae are infected with 10 CFU/larvae with P. aeruginosa PAO1 and subsequently administered an agent.
Discussion
The burden of antimicrobial resistance (AMR) is continually increasing. In 2019, an estimated 4.95 million deaths were associated with AMR worldwide30. By 2050, the mortality caused by AMR is estimated to reach 10 million31. To address this risk, novel antimicrobials must be developed and tested efficiently and cost-effectively, necessitating the use of preclinical models that accurately predict antimicrobial efficacy. The high attrition rate observed during translation to clinical trials is a major limiting factor. One study described 13 antibiotic candidates that failed in clinical trials, with 11 failing to progress to phase II32.
The present study provides a framework for the optimization of G. mellonella preclinical antimicrobial screening studies and a method for assessment of antimicrobial efficacy. G. mellonella larvae have considerable utility in evaluating drug toxicity, MIC determination, and virulence testing, while contributing to the reduction of mammals used in preclinical development. Galleria mellonella larvae have relatively high throughput, are biologically relevant, and translate well into more complex mammalian models. Meanwhile, while wild-type laboratory mice cost between £8 and £30 each with ~£7 weekly maintenance per mouse, G. mellonella cost ~£2 for 50 larvae. To test 10 compounds in a G. mellonella model would, therefore, cost ~£60, compared to upwards of £4000 for the same study in mice. Moreover, previous studies have compared the toxicity and efficacy of novel compounds and identified a correlation between acute toxicity in G. mellonella and mice8,19,33. Therefore, implementing a G. mellonella screen to prioritize compounds to be further tested in mouse models is recommended.
Despite the clear utility of the model, there are several considerations to ensure successful application. The lack of research-grade, sterile larvae complicates their preparation for experimental use, as ethanol sterilization is required, or researchers are required to maintain their own G. mellonella colony, which would mitigate the risk of contamination and improve overall experimental quality5,6. Improper sterilization can yield considerable mortality, and it is challenging to entirely sterilize the organism, as longer ethanol exposure time leads to death. Alternative methods of sterilization include swabbing the proleg of each larva with 70% ethanol prior to infection, which would decrease mortality during sterilization, but is a more labor-intensive method. Other antiseptics could also be used, though no alternatives were assessed in this study, as ethanol sterilization yielded <10% death, once optimized. Moreover, it is often unclear whether suppliers treat their G. mellonella with antibiotics, as suppliers may source their larvae from other suppliers rather than maintaining colonies themselves.
G. mellonella biology differs considerably from mammals, which imposes limitations on their utility. Their immune system lacks any adaptive immunity, although key soluble and cellular aspects of innate immunity are present. Hemocytes are a principal innate immune defense of G. mellonella and display phagocyte-like properties. Various subsets of these cells have been described, including granulocytes and plasmatocytes, amongst others34. G. mellonella also cannot recapitulate relevant infection sites, such as those of respiratory or bladder infections. However, in a preclinical pipeline, G. mellonella would serve as a pre-screen to murine models, ensuring that only the most promising compounds would progress through to the complex mammalian system that more closely resembles human infection environments. Finally, the model would benefit from further genomic characterization of G. mellonella to determine its suitability for assessing changes in clinically relevant biomarkers. In particular, this necessitates improving our understanding of G. mellonella immunity.
Overall, the Galleria mellonella infection model is a valuable tool for the preclinical assessment of novel antimicrobial compounds prior to their evaluation in mammalian models. While their usage is complicated by a lack of supply standardization, their application is high throughput, simple, and can be applied broadly across the antimicrobial development landscape. In the future, integration of this model within a standardized preclinical pipeline could accelerate the development of new antimicrobial compounds to increase the proportion of candidates progressing from preclinical evaluation to clinical trials.
Disclosures
The authors have nothing to disclose.
Acknowledgements
TB, AK, JF, and DN received grant support for the Strategic Research Centre (SRC) "An evidence-based preclinical framework for the development of antimicrobial therapeutics in cystic fibrosis" (PIPE-CF; Project No. SRC 022) from the UK Cystic Fibrosis Trust and US Cystic Fibrosis Foundation. LD and JF acknowledge funding from Kidney Research North West (Project No. 49/19).
Materials
| Name | Company | Catalog Number | Comments |
|---|---|---|---|
| 22s gauge, Small Hub RN Needle, 2 in, point style 2 | Hamilton | 7758-03 | Replacement for the Hamilton syringe. |
| Bacterial infection stocks | Bacterial stocks of a known density (CFU/mL) frozen during mid-exponential phase of growth. | ||
| Ethanol | Fisher Scientific | 10610813 | Other manufacturers may be used. |
| G. mellonella larvae | Livefoods | 5.06045E+12 | For this supplier, orders are marked as “New stock for lab use”. As of April 2024, new stock is delivered to the supplier on Mondays. Orders should be placed then, for delivery on Wednesdays. |
| Microliter syringe | Hamilton | 80630 | The 80630 syringe has a 100 µL capacity. Other volumes exist, such as the 80430, 80530 or 80730. |
| Petri dish | Fisher Scientific | 12674785 | Other manufacturers may be used. |
References
- Menard, G., Rouillon, A., Cattoir, V., Donnio, P. Y. Galleria mellonella as a suitable model of bacterial infection: Past, present and future. Front Cell Infect Microbiol. 11, 782733(2021).
- Piatek, M., Sheehan, G., Kavanagh, K. Galleria mellonella: The versatile host for drug discovery, in vivo toxicity testing and characterizing host-pathogen interactions. Antibiotics. 10 (12), 1545(2021).
- Miethke, M., et al. Towards the sustainable discovery and development of new antibiotics. Nat Rev Chem. 5 (10), 726-749 (2021).
- Seyhan, A. A. Lost in translation: The valley of death across preclinical and clinical divide - identification of problems and overcoming obstacles. Transl Med Commun. 4 (1), (2019).
- Firacative, C., et al. Rearing and maintenance of Galleria mellonella and its application to study fungal virulence. J Fungus. 6 (3), 130(2020).
- Pereira, M. F., Rossi, C. C. Overview of rearing and testing conditions and a guide for optimizing Galleria mellonella breeding and use in the laboratory for scientific purposes. APMIS. 128 (12), 607-620 (2020).
- Jorjão, A. L., et al. From moths to caterpillars: Ideal conditions for Galleria mellonella rearing for in vivo microbiological studies. Virulence. 9 (1), 383-389 (2018).
- Tsai, C. J. -Y., Loh, J. M. S., Proft, T. Galleria mellonella infection models for the study of bacterial diseases and for antimicrobial drug testing. Virulence. 7 (3), 214-229 (2016).
- Gallorini, M., et al. Immunophenotyping of hemocytes from infected Galleria mellonella larvae as an innovative tool for immune profiling, infection studies and drug screening. Sci Rep. 14, 759(2024).
- Smith, F. Q., Casadevall, A. Fungal immunity and pathogenesis in mammals versus the invertebrate model organism Galleria mellonella. Pathog Dis. 79 (3), ftab013(2021).
- Sugumaran, M. Comparative biochemistry of eumelanogenesis and the protective roles of phenoloxidase and melanin in insects. Pigment Cell Res. 15 (1), 2-9 (2002).
- Sheehan, G., Garvey, A., Croke, M., Kavanagh, K. Innate humoral immune defences in mammals and insects: The same, with differences. Virulence. 9, 1625-1639 (2018).
- Wright, C. L., Kavanagh, O. Galleria mellonella as a novel in vivo model to screen natural product-derived modulators of innate immunity. Appl Sci. 12 (13), 6587(2022).
- Newton, S. M., et al. Use of the invertebrate Galleria mellonella as an infection model to study the Mycobacterium tuberculosis complex. J Vis Exp. (148), e59703(2019).
- Frankel, G., Collins, J. W., Schroeder, G. N., Harding, C. R. Use of Galleria mellonella as a model organism to study Legionella pneumophila infection. J Vis Exp. (81), e50964(2013).
- Romera, D., et al. The Galleria mellonella infection model as a system to investigate the virulence of Candida auris strains. Pathog Dis. 78 (9), ftaa067(2020).
- Kwadha, C. A., Ong'amo, G. O., Ndegwa, P. N., Raina, S. K., Fombong, A. T. The biology and control of the greater wax moth, Galleria mellonella. Insects. 8 (2), 61(2017).
- Miles, A. A., Misra, S. S., Irwin, J. O. The estimation of the bactericidal power of the blood. J Hyg. 38, 732-749 (1938).
- Ignasiak, K., Maxwell, A. Galleria mellonella (greater wax moth) larvae as a model for antibiotic susceptibility testing and acute toxicity trials. BMC Res Notes. 10 (1), 428(2017).
- Hesketh-Best, P. J., Mouritzen, M. V., Shandley-Edwards, K., Billington, R. A., Upton, M. Galleria mellonella larvae exhibit a weight-dependent lethal median dose when infected with methicillin-resistant Staphylococcus aureus. Pathog Dis. 79 (2), ftab003(2021).
- Mahenthiralingam, E., Weiser, R., Floto, R. A., Davies, J. C., Fothergill, J. L. Selection of relevant bacterial strains for novel therapeutic testing: a Guidance document for priority cystic fibrosis lung pathogens. Curr Clin MicrobiolRep. 9 (4), 33-45 (2022).
- Carter, M. E. K., et al. A subtype of a Pseudomonas aeruginosa cystic fibrosis epidemic strain exhibits enhanced virulence in a murine model of acute respiratory infection. J Infect Dis. 202 (6), 935-942 (2010).
- Herrmann, G., et al. Colistin-tobramycin combinations are superior to monotherapy concerning the killing of biofilm Pseudomonas aeruginosa. J Infect Dis. 202 (10), 1585-1592 (2010).
- Hennig, S., Standing, J. F., Staatz, C. E., Thomson, A. H. Population pharmacokinetics of tobramycin in patients with and without cystic fibrosis. Clin Pharmacokinet. 52 (4), 289-301 (2013).
- Reyhanoglu, G., Reddivari, A. K. R. Tobramycin. , StatPearls Publishing. https://www.ncbi.nlm.nih.gov/books/NBK551695/ (2023).
- Crass, R. L., Rutter, W. C., Burgess, D. R., Martin, C. A., Burgess, D. S. Nephrotoxicity in patients with or without cystic fibrosis treated with polymyxin b compared to colistin. Antimicrob Agents Chemother. 61 (4), e02329-e02416 (2017).
- Deacon, J., et al. Antimicrobial efficacy of tobramycin polymeric nanoparticles for Pseudomonas aeruginosa infections in cystic fibrosis: Formulation, characterization and functionalization with dornase alfa (DNase). J Control Release. 198, 55-61 (2015).
- Tamma, P. D., et al. Infectious Diseases Society of America 2022 guidance on the treatment of extended-spectrum β-lactamase producing enterobacterales (ESBL-E), carbapenem-resistant enterobacterales (CRE), and Pseudomonas aeruginosa with difficult-to-treat resistance (DTR-P. aeruginosa). Clin Infect Dis. 75 (2), 187-212 (2022).
- Charan, J., Kantharia, N. D. How to calculate sample size in animal studies. J PharmacolPharmacother. 4 (4), 303-306 (2022).
- Murray, C. J. L., et al. Global burden of bacterial antimicrobial resistance in 2019: A systematic analysis. Lancet. 399 (10325), 629-655 (2022).
- de Kraker, M. E. A., Stewardson, A. J., Harbarth, S. Will 10 million people die a year due to antimicrobial resistance by 2050. PLoS Med. 13 (11), e1002184(2016).
- Prasad, N. K., Seiple, I. B., Cirz, R. T., Rosenberg, O. S. Leaks in the pipeline: A failure analysis of gram-negative antibiotic development from 2010 to 2020. Antimicrob Agents Chemother. 66 (5), e0005422(2022).
- Wang, S., et al. A novel Galleria mellonella experimental model for zoonotic pathogen Brucella. Virulence. 14 (1), 2268496(2023).
- Senior, N. J., Titball, R. W. Isolation and primary culture of Galleria mellonella hemocytes for infection studies. F1000Res. 9, 1932(2021).
Reprints and Permissions
