This article outlines the protocol for quantifying the percentage of Tissue Factor (TF)-positive platelets using whole blood flow cytometry, assessing the protein: (1) intracellularly in resting conditions, and (2) on the cell surface, in both resting and activated conditions. Guidance is also provided for evaluating TF-positive platelets in platelet-rich plasma.
Method Article
Flow Cytometry Analysis of Tissue Factor Expression in Human Platelets
In This Article
Erratum Notice
Important: There has been an erratum issued for this article. View Erratum Notice
Summary
Abstract
A subset of circulating human platelets stores Tissue Factor (TF) intracellularly, the key activator of the blood coagulation cascade and thrombus formation. Upon platelet activation, TF is exposed on the cell membrane, where it binds to FVII, ultimately leading to thrombin generation. Considering that (1) levels of TF-positive platelets increase in various clinical settings, contributing to the patient's prothrombotic phenotype, and (2) different drugs can modulate platelet-associated TF expression, a standardized method for assessing TF-positive platelets is valuable, as its evaluation has been controversial in the past. Here, we outline a protocol for measuring the percentage of TF-positive platelets using flow cytometry in whole blood and platelet-rich plasma (PRP)/washed platelets. This protocol aims to provide detailed instructions for quantifying the percentage of TF-positive platelets by assessing the protein (1) intracellularly in resting conditions, and (2) on the cell surface, in both resting and activated conditions. The first section provides essential information for correctly performing blood withdrawal to ensure that pre-analytical procedures do not affect the results. Next, the protocol focuses on sample preparation and labeling procedures for flow cytometry analysis. Detailed steps for cell stimulation, labeling, fixation, and permeabilization -- where necessary -- are outlined. Finally, instructions for flow cytometry settings to correctly identify the platelet population and analyze TF-positive events are described. Lastly, the method includes the procedure for preparing PRP if TF-positive platelets are to be measured in isolated platelets. Since only a subset of platelets contains TF, it is important to ensure that these platelets are not lost during the centrifugation steps required to obtain PRP.
Introduction
Tissue Factor (TF), a transmembrane glycoprotein and key activator of the blood coagulation cascade, is expressed by a subset, ~20%-30%, of circulating human platelets1, particularly those with larger size2. Upon activation by classical platelet agonists such as adenosine diphosphate (ADP) and thrombin, platelets expose functionally active TF on their surface in a concentration-dependent manner, allowing it to bind factor VII/VIIa, ultimately leading to thrombin generation1,3,4,5,6. Notably, in pathological conditions such as coronary artery disease (CAD)7, severe acute respiratory syndrome-coronavirus-2 (SARS-CoV-2) infection8, migraine with aura associated with patent foramen ovale (MHA-PFO)9, cancer10, and sepsis11, the number of TF-positive platelets significantly increases, contributing to the greater thrombotic risk observed in these clinical settings.
Despite this compelling evidence, the detection of TF-positive platelets remains a topic of debate within the scientific community6,12,13. Methodological challenges, including pre-analytical variables, sample preparation, and antibody specificity, have been suggested as possible reasons for the contradictory results reported in the literature2,4,12,14. Therefore, it is crucial to establish a standardized assay based on a well-defined protocol for measuring TF in human platelets.
In this context, whole blood flow cytometry is the only technology that allows for the analysis of TF-positive platelets with minimal sample handling, which is crucial to avoid the loss of this platelet subset.
In this article, we propose a protocol for measuring platelet-associated TF using whole blood flow cytometry, assessing the protein (1) intracellularly in resting conditions and (2) on the cell surface in both resting and activated conditions. Instructions are also provided if the evaluation of TF-positive platelets in platelet-rich plasma (PRP) is required.
Protocol
The protocol was approved by the Ethical Committee of the Institution (no.70/24, CE 18.06.24), and written informed consent was obtained from all blood donors. The protocol will guide the user through seven main steps (Figure 1). The first step addresses the procedure for performing blood sampling. Steps 2 and 3 outline the antibody titration protocol and sample preparation for the analysis of intracellular TF expression using a phycoerythrin (PE)-labeled αCD142/HTF1 monoclonal antibody (mAb). Step 4 describes the protocol for evaluating the protein exposed on the platelet surface using an indirect staining method with αCD142/HTF1 mAb. Due to the steric hindrance of the fluorochrome, the PE-labeled mAb used for intracellular staining does not bind to the catalytic domain of the surface-exposed protein. Therefore, a protocol for indirect staining with an Alexa Fluor 633-labeled secondary mAb is proposed. Steps 5 and 6 detail the phases of flow cytometry analysis. The final step outlines the procedure for preparing platelet-rich plasma (PRP) to avoid the loss of the large size platelet subpopulation. Details of the reagents and equipment used are listed in the Table of Materials.
1. Blood withdrawal
NOTE: Human blood collection should be performed only after obtaining Ethical Committee approval.
- Collect blood samples by peripheral venous or needle-cannula sampling from an arm not affected by peripheral venous infusions, preferably from the antecubital vein.
- For peripheral venous sampling, apply the tourniquet and, after inserting a G19 butterfly needle into the vein, remove it to prevent platelet activation (Figure 2).
NOTE: Do not use a butterfly needle smaller than G21 to avoid platelet activation. - For venous sampling with a needle-cannula, do not apply the tourniquet at any time during sampling. If necessary, wash the sample with 0.9% saline solution before taking it. Always discard the first 5 mL of blood before starting to fill tubes.
- For peripheral venous sampling, apply the tourniquet and, after inserting a G19 butterfly needle into the vein, remove it to prevent platelet activation (Figure 2).
- Draw 2 mL of blood into an EDTA vacutainer (to be used for blood cell count). Gently mix the tube three times to ensure complete mixing of blood and anticoagulant.
- Draw blood into a 0.129 M sodium citrate vacutainer for the analysis of platelet-associated TF expression. Carefully fill the vacutainer to the indicated level to maintain the correct blood/anticoagulant ratio. Gently invert the tubes five times to ensure thorough mixing of the blood with the anticoagulant, preventing clot formation and hemolysis of the samples.
NOTE: The use of 0.129 M citrate anticoagulant is recommended to optimize the detection of platelet-associated TF with the HTF1 clone of the αCD142 mAb. If it is necessary to isolate platelets from whole blood, draw a second 0.129 M sodium citrate vacutainer for platelet-rich plasma (PRP) preparation. - Keep vacutainers upright in a tube holder. Do not shake them on rotating or tilting plates, and avoid pneumatic conveying systems. Do not refrigerate the blood samples to prevent platelet activation.
NOTE: Blood samples should preferably be processed within 15 min after withdrawal if another granule-associated platelet-activation marker is to be measured along with TF. Otherwise, samples should be processed no later than 3 h from collection (Figure 3).
2. Titration of the anti-TF antibody (for intracellular TF evaluation)
NOTE: Determination of intracellularly stored TF is performed using the PE-αCD142/HTF1 mAb.
- Antibody titration using beads
NOTE: The use of beads allows for defining the correct amount of antibody to be used (i.e., the antibody concentration producing the greatest separation of fluorescence peaks between positive and negative samples). This analysis is performed using two samples, one truly positive and one truly negative. The antibody concentration is not reported by the manufacturer (see Table of Materials), so antibody titration is performed using five dilution points.- Centrifuge the antibody at 17,000 x g for 5 min at 4 °C. To prepare the five antibody dilution points, pipette 40 µL of antibody into tube 1 and 20 µL of PBS into tubes 2 through 5. Make four consecutive serial 1:2 dilutions by transferring 20 µL from tube 1 to tube 2 and then onwards.
- Prepare one test tube for each antibody volume to test. Add one drop of negative beads and one drop of positive beads to each test tube. Add 20 µL of each antibody dilution to the test tube and vortex immediately. Incubate in the dark at room temperature for 20 min.
- Add 1 mL of 1x PBS without Ca++ and Mg++, pH 7.4, to each tube and vortex.
- Acquire the samples on the flow cytometer according to the manufacturer's instructions and record a data file of 10,000 events in the "beads" gate. The optimal antibody concentration is the one that provides the greatest separation between positive and negative peaks.
- Antibody titration on platelets
NOTE: As a rule, the optimal antibody concentration identified using the beads should be verified on the cells to be stained-in this case, platelets in whole blood.- Fixation
- Gently invert the sodium citrate vacutainer five times to mix the blood and anticoagulant thoroughly. Transfer 50 µL of blood into a 1.5 mL tube, add 950 µL of 1% paraformaldehyde (PFA), gently mix, and incubate the sample for 90 min at room temperature.
- Centrifuge the sample at 1,500 x g for 5 min, with brake, at room temperature.
- Remove the supernatant and resuspend the pellet by gently pipetting in 1 mL of 1x PBS without Ca++ and Mg++, pH 7.4.
- Permeabilization
- Prepare one tube for each antibody volume to be tested (test the volume identified with the beads titration along with a higher and a lower dilution, e.g., 10 µL, 5 µL, 2.5 µL if the identified volume is 5 µL) and one tube for the Fluorescence Minus One (FMO) control.
- Dispense 100 µL of fixed blood into each tube and centrifuge them at 1,500 x g for 5 min, with brake, at room temperature.
- Remove the supernatant, resuspend the pellet in 100 µL of 0.1% Triton-PBS to permeabilize the samples, and incubate for 10 min at room temperature.
- Staining
- Centrifuge the antibody at 17,000 x g for 5 min at 4 °C. Add the required antibody volumes to each test tube as determined in 2.2.2.1 and mix.
- Incubate the samples for 15 min in the dark at room temperature.
- Add 300 µL of 1x PBS without Ca++ and Mg++, pH 7.4, to each tube and mix. Acquire the samples on the flow cytometer (see step 5).
- Calculate the stain index according to the following formula15:
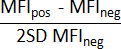
where, MFIpos is the Mean Fluorescence Intensity of the positive events, MFIneg is that of the negative events, and SD is the Standard Deviation of the negative population. - Choose the lowest antibody concentration that provides the highest stain index.
NOTE: In the current experimental conditions, the highest stain index for the PE-αCD142/HTF1 mAb is achieved using 5 µL of antibody.
- Fixation
3. Sample preparation for flow cytometry analysis of intracellular TF expression
- Whole blood fixation and permeabilization
- For intracellular TF analysis, fix and permeabilize whole blood according to the procedure outlined in step 2.
- Staining procedure
NOTE: In the following protocol, the platelet population is identified using αCD61-PerCP staining. Other population markers may be used at the operator's discretion.- Prepare one tube for the Fluorescence Minus One (FMO) control and one tube for TF staining. Add 100 µL of fixed and permeabilized whole blood to each tube along with the antibodies listed in Table 1.
- Incubate the samples for 15 min in the dark at room temperature.
- Add 300 µL of 1x PBS without Ca++ and Mg++, pH 7.4, to each tube and mix. Store the stained samples in the dark until flow cytometry analysis (see step 5).
NOTE: To calculate the compensation matrix, prepare the samples as described in Table 2.
4. Sample preparation for flow cytometry analysis of cell surface-associated TF expression in resting and activated platelets
NOTE: For the detection of cell surface-associated TF, use unlabelled αCD142/HTF1 mAb (1 mg/mL) and Alexa Fluor 633 goat anti-mouse IgG (2 mg/ml) as the secondary antibody for signal detection. Adenosine 5'-diphosphate (ADP) is used as a platelet agonist to induce the exposure of TF on the cell surface. A PE-labelled antibody is used as a platelet population marker to minimize spillover, which will be checked by signal compensation.
- TF staining
- Dilute αCD142/HTF1 mAb 1:100 in 1x PBS without Ca++ and Mg++, pH 7.4, to obtain a working concentration of 10 µg/mL. Dilute Alexa Fluor 633 goat anti-mouse IgG 1:10 in 1x PBS without Ca++ and Mg++, pH 7.4, to obtain a working concentration of 200 μg/mL.
- Prepare the three sample tubes and dispense 1x PBS without Ca++ and Mg++, pH 7.4, as indicated in Table 3.
- Dispense 7.5 µL of diluted αCD142/HTF1 mAb and add 5 µL of ADP (200 μM) to obtain a final concentration of 10 μM ADP. Gently invert the citrate vacutainer 5 times to mix the blood and anticoagulant thoroughly, then dispense 5 µL of whole blood into each tube. Gently mix the samples.
- Incubate the samples for 20 min at room temperature.
- Sample fixation
- Fix each sample by adding 300 µL of 1% paraformaldehyde (PFA) and incubate the samples for 1 h at room temperature.
NOTE: Labelled samples fixed with 1% PFA and stored at 4 °C remain stable for up to 4 days. - Add 300 µL of 1x PBS without Ca++ and Mg++, pH 7.4, to each tube and centrifuge at 1500 x g for 5 min with brake at room temperature.
- Remove the supernatant and resuspend the pellet in 95 µL of 1x PBS without Ca++ and Mg++, pH 7.4, by gently pipetting.
- Fix each sample by adding 300 µL of 1% paraformaldehyde (PFA) and incubate the samples for 1 h at room temperature.
- Staining with the secondary antibody
- Dispense 5 µL of diluted Alexa Fluor 633 IgG and incubate the samples for 15 min in the dark at room temperature.
- Add 300 μL of 1x PBS without Ca++ and Mg++, pH 7.4, to each tube and centrifuge at 1500 x g for 5 min with brake at room temperature. Remove the supernatant and resuspend the pellet in 95 μL of 1x PBS without Ca++ and Mg++, pH 7.4.
- Dispense 5 µL of αCD41-PE into each tube (see Table 4). Incubate the samples for 15 min in the dark at room temperature.
- Add 300 µL of 1x PBS without Ca++ and Mg++, pH 7.4, to each tube and mix.
- Store the stained samples in the dark until flow cytometry analysis (see step 6).
NOTE: To calculate the compensation matrix, prepare the samples according to Steps 4.1-4.3 and as outlined in Table 5 and Table 6.
5. Flow cytometry analysis of intracellular TF expression
NOTE: The following procedure refers to acquisitions on a reference flow cytometer; thus, the reported settings and plots should be considered representative. The protocol can be applied to any high-sensitivity, new-generation flow cytometer. Switch on the flow cytometer well before sample acquisition to ensure laser stability. Thoroughly wash the fluidics and flow cell, as platelets are small, and any cell debris may interfere with the visualization of the platelet population in the forward scatter area/side scatter area (FSC-A/SSC-A) dot plot. Perform quality control with QC beads according to the manufacturer's instructions and wash the fluidics again to remove any residual beads.
- Acquisition setup
- Create an FSC-A/SSC-A dot plot on a log scale displaying All Events (Figure 4A). Create a CD61-A/SSC-A dot plot on a log scale displaying All Events (Figure 4B).
- Adjust the PE (Y-585) and PerCP (B690) gain according to daily quality control. Set the threshold approximately to 2000 on SSC-H and to 1000 on PerCP (B690-H) to visualize the platelet population. Set the flow rate to LOW.
- Draw a region between 103 and 105 called "CD61+" to identify the platelet population.
- Acquire single-stain controls to calculate the compensation matrix and then acquire the samples. Record a data file of 10,000 events within the "CD61+" gate (Figure 4D,E). Start recording 5-10 s after the beginning of the sample acquisition.
6. Flow cytometry analysis of surface TF expression
- Make a FSC-A/SSC-A dot plot on a log scale displaying All Events (Figure 5A), and a CD41-A/SSC-A dot plot on a log scale displaying All Events (Figure 5B).
- Adjust the Alexa Fluor 633 gain and the PE (Y-585) gain according to daily quality control, set the threshold approximately to 1000 on SSC-H and to 2500 on PE (Y585-H) to visualize the platelet population as shown in Figure 5B. Set the flow rate to LOW.
- Draw a region between 104 and 105 called "CD41+" to identify the platelet population.
- Acquire single-stain controls to calculate the compensation matrix and then acquire the samples. Record a data file of 10,000 events within the "CD41+" gate (Figure 5D,E). Start recording 5-10 s after the beginning of the sample acquisition.
7. Analysis of TF-positive platelets in platelet-rich plasma
- Platelet-rich plasma (PRP) preparation
NOTE: Platelet isolation must be carried out at room temperature to prevent cell activation. Ensure that the temperature of the reagents and instruments is between 18 °C and 22 °C. Avoid fast pipetting and vigorous shaking throughout the procedure.- Gently mix the 0.129 M sodium citrate vacutainer 5 times and measure the platelet count twice on a blood cell counter to calculate the percentage of recovered platelets.
NOTE: Use the mean value of the two determinations as the platelet concentration. - Centrifuge the 0.129 M sodium citrate vacutainer at 100 x g for 10 min, without brake, at room temperature (Figure 6). Collect the obtained PRP, transfer it to a 10 mL polypropylene tube, and record the volume collected.
NOTE: Do not use polystyrene tubes to avoid platelet activation. - Count platelets twice in PRP using a blood cell counter and calculate the percentage of platelet recovery as follows:

NOTE: If the recovery is lower than 65%, the platelet population is not fully representative of that in whole blood. Consider discarding the preparation.
- Gently mix the 0.129 M sodium citrate vacutainer 5 times and measure the platelet count twice on a blood cell counter to calculate the percentage of recovered platelets.
- Sample preparation for flow cytometry analysis of intracellular and surface-associated TF expression in PRP
- To analyze intracellular and surface-associated TF expression in PRP, use the same protocol described for whole blood analysis (see steps 3-6).
Results
A summary of platelet-associated TF expression analysis is described in the flow diagram shown in Figure 1. The steps include: (1) Blood Collection: Collect blood from the human peripheral vein, preferably from the antecubital vein, using a G19 butterfly needle or a needle-cannula without a tourniquet and with anticoagulant-containing vacutainers. (2) Sample Processing: Process the samples according to the type of TF evaluation to be performed. (3) Sample Labeling: Label the samples with specific antibodies. (4) Flow Cytometry Analysis: Analyze the samples to detect surface and intracellular TF.
During blood withdrawal, particular attention must be paid to avoid platelet activation. To this end, two precautions are observed: removing the tourniquet shortly after inserting the needle into the vein, and discarding the blood in the first vacutainer drawn. Without the use of the tourniquet, the platelet population, displayed in an FSC-A/SSC-A dot plot, has a typical shape, as shown in Figure 2A. Conversely, with the use of the tourniquet, the physical properties of the platelet population result in an elongated shape resembling the morphology observed following stimulation with a classical platelet agonist, such as ADP (Figure 2B,C).
Experiments performed to assess the stability of platelet-associated TF expression over time showed that it was stable for 3 h from blood collection (Figure 3). When combining the measurement of TF expression with that of a marker of platelet activation, such as P-selectin, it is advised to process the blood sample as soon as possible to avoid platelet degranulation.
For the analysis of intracellularly stored TF, whole blood is fixed in 1% PFA, permeabilized with PBS-Triton, and then stained with a PE-labeled antibody. The platelet population is identified on a logarithmic FSC-A/SSC-A plot (Figure 4 A,D) and by αCD61 mAb staining (Figure 4 B,E). Results from the analysis of intracellular TF in healthy subjects (n = 377) indicated that TF is present within 26.8% ± 4.8% of circulating platelets (Figure 4F).
Flow cytometry analysis of surface-associated TF expression has been performed in resting conditions and after cell stimulation with ADP 10 µM. The whole blood platelet population, labeled with αCD41 mAb, has been identified on a logarithmic FSC-A/SSC-A plot (Figure 5A,B). Results showed that in healthy subjects (n = 377), TF is expressed by 2.8% ± 1.4% of resting platelets (Figure 5D-F) and increases up to 24.5% ± 5.8% upon activation (Figure 5G-I). TF is expressed by the platelet subset with the largest size (Figure 5D,G, green dots). Furthermore, analysis by imaging flow cytometry highlights that TF signal is associated only with αCD61 positive and not with αCD45 positive events (Figure 7).
As previously mentioned, TF is stored in a subset of platelets characterized by the largest size within the whole population. Therefore, it is important not to lose this platelet fraction during PRP preparation. Following the indications provided in the method section (step 7), it is possible to isolate a platelet population within PRP that is representative of that present in whole blood. As shown in Figure 6, the flow cytometry dot plot of the platelet population obtained by 100 x g whole blood centrifugation is very similar to that of whole blood in terms of FSC distribution (Figure 6 A,B). In contrast, using a higher force and longer centrifugation time, as often reported in the literature12,14,16, the recovered platelet population has a lower FSC compared to that of whole blood (Figure 6C), suggesting the loss of the larger size platelets, which are those highly TF-positive.
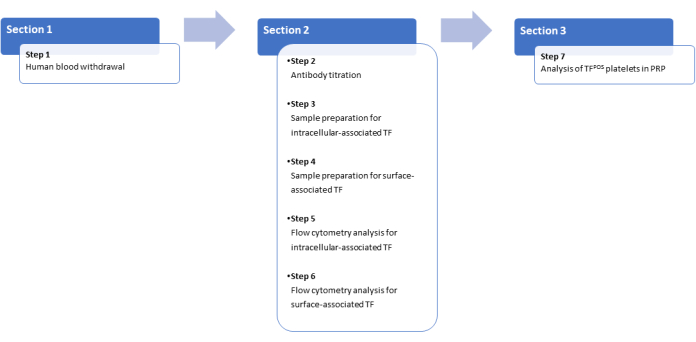
Figure 1: Schematic diagram for platelet-associated TF expression analysis and platelet isolation. Please click here to view a larger version of this figure.

Figure 2: Representative density plots of the platelet population analyzed by whole blood flow cytometry. (A) Platelet population analyzed in a blood sample drawn without a tourniquet or (B) with the tourniquet. (C) Platelet population stimulated with ADP is reported for comparison. WBC: White Blood Cells; RBC: Red Blood Cells. Please click here to view a larger version of this figure.
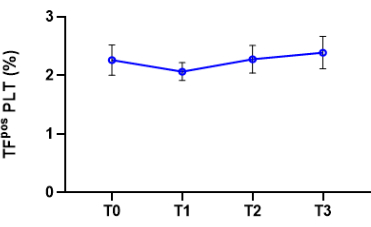
Figure 3: Stability of cell surface-associated TF expression over time. Platelet-associated TF expression of resting platelets was analyzed at 4 different time points after blood withdrawal reported in the x-axis as follows: T0 = immediately after blood collection; T1 = 1 h after blood collection; T2 = 2 h after blood collection; T3 = 3 h after blood collection. Data are reported as mean ± SD, n = 3. Please click here to view a larger version of this figure.

Figure 4: Representative flow cytometry analysis of intracellularly stored TF. Platelet population (red) in whole blood is identified in the FSC/SSC-A dot plot (A,D) and by αCD61 mAb staining (B,E). TF expression is analyzed using a PE- αCD142/HTF1 mAb (green dots). Histogram plots are used to identify negative (C) and positive (F) events. Please click here to view a larger version of this figure.

Figure 5: Representative flow cytometry analysis of surface-associated TF-positive platelets. Fresh whole blood is labeled with αCD142/HTF1 mAb, then fixed with 1% PFA and labeled with the secondary mAb and the αCD41 mAb. Platelet population (red) in whole blood is identified in the FSC/SSC-A dot plot (A,D,G) and by αCD41 mAb staining (B,E,H). TF expression in resting condition (D-F) and after ADP stimulation (G-I) is quantified by labeling with αCD142/HTF1 mAb (green dots). Representative histogram plots of negative (C) and positive (F,I) samples are reported. Please click here to view a larger version of this figure.

Figure 6: Effect of different centrifugation forces on PRP preparation. (A-C) Flow cytometry analysis of the platelet population in whole blood, PRP prepared at 100 x g and at 350 x g. The reference range of platelet population on FSC-H/SSC-H is indicated by dotted lines. Please click here to view a larger version of this figure.
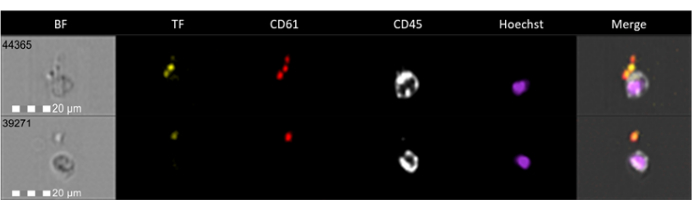
Figure 7: Evaluation of TF expression in platelets and leukocytes by imaging flow cytometry. Representative channel images of brightfield (BF, grey), Tissue Factor (TF, green), αCD61 (red), αCD45 (grey), nuclei staining with Hoechst (magenta), and the composite image (merge), acquired at 60x magnification, are shown. Please click here to view a larger version of this figure.
| Sample tube ID | Fix/perm whole blood (µL) | αCD142-PE (µL) | αCD61-PerCP (µL) |
| FMO | 100 | - | 15 |
| TF | 100 | 5 | 15 |
Table 1: Staining protocol for flow cytometry analysis of intracellular TF expression.
| Sample tube ID | Fix/perm whole blood (µL) | αCD142-PE (µL) | αCD61-PerCP (µL) |
| Unstained | 100 | - | - |
| αCD142-PE | 95 | 5 | - |
| αCD61-PerCP | 85 | - | 15 |
Table 2: Single stain control for compensation matrix of intracellular TF expression.
| Sample tube ID | PBS 1x (µL) | αCD142 (µL) | ADP (µL) | Fresh whole blood (µL) | PFA 1% (µL) |
| FMO | 95 | - | - | 5 | 300 |
| Resting | 87.5 | 7.5 | - | 5 | 300 |
| ADP Activated | 82.5 | 7.5 | 5 | 5 | 300 |
Table 3: Staining protocol for flow cytometry analysis of surface TF expression.
| Sample tube ID | PBS 1x (µL) | Alexa Fluor 633 IgG (µL) | αCD41-PE (µL) |
| FMO | 90 | 5 | 5 |
| Resting | 90 | 5 | 5 |
| ADP Activated | 90 | 5 | 5 |
Table 4: Secondary antibody staining protocol for surface-associated TF analysis.
| Sample tube ID | PBS 1x (µL) | αCD142 (µL) | ADP (µL) | Fresh whole blood (µL) | PFA 1% (µL) |
| Unstained | 90 | - | 5 | 5 | 300 |
| TF + Alexa Fluor 633 IgG | 82.5 | 7.5 | 5 | 5 | 300 |
| αCD41-PE | 90 | - | 5 | 5 | 300 |
Table 5: Compensation matrix preparation for intracellular TF analysis.
| Sample tube ID | PBS 1x (µL) | Alexa Fluor 633 IgG (µL) | αCD41-PE (µL) |
| Unstained | 100 | - | - |
| TF + Alexa Fluor 633 IgG | 95 | 5 | - |
| αCD41-PE | 95 | - | 5 |
Table 6: Compensation matrix preparation for surface-associated TF analysis.
Discussion
This manuscript reports detailed protocols for the evaluation of TF-positive platelets by whole blood flow cytometry, taking into account the analysis of the protein expressed both within and on the platelet surface.
During the past 20 years, the presence of TF in human platelets has been well established1,2,3,4,5,17,18. A subset of platelets, accounting for 20%-30% of the total circulating platelet population2, expresses the protein, reinforcing the concept of the platelet heterogeneity that is becoming increasingly relevant in the field19,20. It is worth mentioning that the TF-positive platelets have a high mean platelet volume, as previously shown by highly sensitive imaging flow cytometry2. It is of crucial importance to consider this feature, especially when TF expression has to be analyzed in platelets isolated from the other blood cell components. It is possible, indeed, that the centrifugation step used for platelet isolation may result in the loss of large-size platelets2. This pre-analytical issue is probably one of the main drivers of the controversy - which lasted until a few years ago - on the presence of TF in platelets7,12,13. Whole blood flow cytometry is an extremely useful approach in this regard, allowing the analysis of all platelet subsets without the need to isolate them.
A second reason that fostered the discussion on the presence of TF in platelets was the choice of the anti-human TF antibody used for the analysis. There are many commercially available antibodies that have been used for platelet-associated TF evaluation and that recognize different epitopes of the protein. Some antibodies, such as the TF9-10H10 3,21,22 and the VIC71,3 clones, bind to a non-functional region of TF without affecting FVII/FVIIa binding. Other antibodies, including the VD81,2,3 and the HTF118 clones -the latter used in the present protocols- recognize the catalytic site of the protein, competing with FVII/FVIIa for binding to TF, thus blocking its procoagulant function. It is important to note that, depending on the glycosylation state of the extracellular domain and on the conformation of the catalytic site of TF23, which could be modified in particular conditions (such as cell activation or disease), some of these antibodies could be differentially able to recognize, by flow cytometry, the surface expression of platelet-associated TF. Moreover, also the staining conditions, i.e., whether the sample to be analyzed is fresh, fixed and/or permeabilized, could affect the epitope conformation and, thus, the antigen-antibody binding14.
A further consideration that deserves attention is the choice of fluorochrome bound to the antibody. Since TF is expressed by only 20%-30% of the platelet population, low-emission fluorochromes, together with the use of low-sensitivity flow cytometers, may not be suitable to discriminate low positive signals. For this reason, antibodies labeled with bright fluorochromes, such as PE or APC, are to be preferred. It is important to note, however, that the large size of a fluorochrome such as PE can hinder the binding of the labeled antibody to the protein24. In order to overcome this issue, in the present protocol, the surface TF staining was performed as an indirect labeling with an unconjugated αCD142/HTF1 mAb, then revealed through the use of a secondary antibody. The PE-steric hindrance does not affect αCD142/HTF1 mAb binding to TF stored intracellularly where the catalytic site is more accessible to antibody binding. It is clear that assessment of the surface expression of platelet-associated TF by direct labeling, compared to the indirect one, would be preferable -if possible- to shorten the sample processing time. This approach, however, must take into account the critical issues mentioned above and related to the binding capacity of the several commercially available antibodies to platelet TF, due to the conformation of the protein itself, or to the staining conditions, as well as the steric hindrance of the different fluorochromes used. Therefore, in order to avoid false negative results, direct labeling of surface-expressed platelet-associated TF requires a mandatory careful optimization process. These aspects are the subject of an ongoing study aimed at evaluating the efficiency of direct staining with the different commercially available antibody clones labeled with all-in-use fluorochromes.
Several studies showed that the expression of TF is elevated in various pathological conditions characterized by a high thrombotic risk8,9,10,11,17. Recently, evidence has been provided that levels of TF-positive platelets, accurately quantified by flow cytometry analysis, can identify cardiovascular patients who, despite an optimal response to drug treatment with aspirin and P2Y12 antagonists, maintain a high thrombotic risk25. Indeed, platelet-associated TF is functionally active and thus potentially able to support thrombin generation1,3,4. In this context, the ability to perform flow cytometry analysis on a few microliters of blood is a significant advantage that allows platelet-associated TF analysis to be extended to the clinical setting. To this end, it is worth mentioning that the validation of platelet-associated TF measurement by flow cytometry has been the aim of an international project we recently coordinated, with the support of the International Society of Haemostasis and Thrombosis, to provide methodological guidance for its assessment.
Unlike other classical markers of platelet activation, such as P-selectin and platelet-leukocyte aggregates, which need to be analyzed immediately after blood sampling to avoid artifacts, TF expression is much more stable. In fact, the blood sample can be processed within a few hours after blood withdrawal without any significant change in platelet-TF expression; furthermore, the possibility of fixing the sample and labeling/processing it afterward makes this analysis suitable for many hospitals/laboratories. It is noteworthy that, although the protocol described in this manuscript is relatively simple to perform, the flow cytometry technique still requires specialized technical training. For this reason, technology is moving towards the development of increasingly simple cytometers intended for point-of-care assays.
In conclusion, the proposed protocol provides methods for the correct analysis of platelet-associated TF, emphasizing the advantages of a flow cytometry analysis-based technique for its determination. In addition, it highlights the pre-analytical variables that can influence the analysis of this protein, emphasizing the measures to be taken to avoid them.
Disclosures
The authors declare no conflict of interest.
Acknowledgements
This work was supported by a grant from the Italian Ministry of Health (Ricerca Corrente 2023 to M.C.).
Materials
| Name | Company | Catalog Number | Comments |
|---|---|---|---|
| Adenosine 5’-diphosphate (ADP) | Sigma-Aldrich | A-2754 | Platelets agonist |
| Alexa Fluor 633 goat α-mouse IgG | Invitrogen | A21052 | Secondary antibody |
| Biotube 10 mL | Biosigma | BSP048 | For PRP collection |
| Butterfly Needle G19 | PIC solution | 02044019030010 | For blood withdrawal |
| CytExpert Software | Beckman Coulter | Flow cytometry data analysis | |
| Cytoflex S | Beckman Coulter | Flow cytometer | |
| Eppendorf tubes 1.5 mL | Eppendorf | 1,20,086 | Blood fixation |
| ImageStreamX Mk II | Cytek Biosciences | Imaging flow cytometer | |
| Kaluza Software | Beckman Coulter | Flow cytometry data analysis | |
| Paraformaldehyde | Antibioticos – Divisione Carlo Erba Reagenti | 387507 | To fix blood and platelets |
| PerCP-αCD45 | BD | 345809 | Leukocyte population marker |
| PerCP-αCD61 | BD | 347408 | Platelet poulation marker |
| PE-αCD142 | BD | 550312 | Anti-human Tissue Factor antibody |
| PE-αCD41 | Beckman Coulter | A07781 | Platelet poulation marker |
| Phosphate Buffer Saline (PBS) 1x w/o Calcium and Magnesium | Gibco | 10010-015 | For antibodies and sample dilution |
| Pipet tips 10 µL | Gilson | F161630 | To prepare samples |
| Pipet tips 1000 µL | Gilson | F161670 | To prepare samples |
| Pipet tips 200 µL | Gilson | F161930 | To prepare samples |
| Round-Bottom Tube 5 mL | Corning | 352052 | For flow cytometer acquisition |
| Sodium Chloride 0.9 % | BD | 306575 | To wash the needle-cannula after blood withdrawal |
| Sysmex XN-450 | Dasit | Blood cell analyser | |
| Triton X-100 | Carlo Erba Reagenti | 9002-93-1 | To permeabilise blood cells membrane |
| Vacutainer citrate 0.129M tubes | BD | 363079 | For blood collection |
| Vacutainer K2 EDTA tubes | BD | 368857 | For blood collection |
| Vacutainer multiple sample luer adapter | BD | 367300 | For blood withdrawal |
| Vacutainer one use holder | BD | 364815 | For blood withdrawal |
| Versacomp Antibody Capture beads kit | Beckman Coulter | B22804 | Antibody titration |
| αCD142 (clone HTF-1) | Invitrogen | 16-1429-82 | Anti-human Tissue Factor antibody |
References
- Camera, M., et al. Platelet activation induces cell-surface immunoreactive tissue factor expression, which is modulated differently by antiplatelet drugs. Arterioscler Thromb Vasc Biol. 23 (9), 1690-1696 (2003).
- Brambilla, M., et al. Do methodological differences account for the current controversy on tissue factor expression in platelets. Platelets. 29 (4), 406-414 (2018).
- Zillmann, A., et al. Platelet-associated tissue factor contributes to the collagen-triggered activation of blood coagulation. Biochem Biophys Res Commun. 281 (2), 603-609 (2001).
- Camera, M., Brambilla, M., Toschi, V., Tremoli, E. Tissue factor expression on platelets is a dynamic event. Blood. 116 (23), 5076-5077 (2010).
- Panes, O., et al. Human platelets synthesize and express functional tissue factor. Blood. 109 (12), 5242-5250 (2007).
- Camera, M. Response: functionally active platelets do express tissue factor. Blood. 119 (18), 4339-4341 (2012).
- Brambilla, M., et al. Tissue factor in patients with acute coronary syndromes: Expression in platelets, leukocytes, and platelet-leukocyte aggregates. Arterioscler Thromb Vasc Biol. 28 (5), 947-953 (2008).
- Canzano, P., et al. Platelet and endothelial activation as potential mechanisms behind the thrombotic complications of COVID-19 patients. JACC Basic Transl Sci. 6 (3), 202-218 (2021).
- Trabattoni, D., et al. Migraine in patients undergoing PFO closure: Characterization of a platelet-associated pathophysiological mechanism: The LEARNER study. JACC Basic Transl Sci. 7 (6), 525-540 (2022).
- Falanga, A., Schieppati, F., Russo, D. Cancer tissue procoagulant mechanisms and the hypercoagulable state of patients with cancer. Semin Thromb Hemost. 41 (7), 756-764 (2015).
- Tsantes, A. G., et al. Sepsis-induced coagulopathy: An update on pathophysiology, biomarkers, and current guidelines. Life (Basel). 13 (2), 350(2023).
- Osterud, B., Olsen, J. O. Human platelets do not express tissue factor. Thromb Res. 132 (1), 112-115 (2013).
- Bouchard, B. A., Krudysz-Amblo, J., Butenas, S. Platelet tissue factor is not expressed transiently after platelet activation. Blood. 119 (18), 4338-4339 (2012).
- Basavaraj, M. G., Olsen, J. O., Osterud, B., Hansen, J. B. Differential ability of tissue factor antibody clones on detection of tissue factor in blood cells and microparticles. Thromb Res. 130 (3), 538-546 (2012).
- Maecker, H. T., Frey, T., Nomura, L. E., Trotter, J. Selecting fluorochrome conjugates for maximum sensitivity. Cytometry A. 62 (2), 169-173 (2004).
- Butenas, S., Bouchard, B. A., Brummel-Ziedins, K. E., Parhami-Seren, B., Mann, K. G. Tissue factor activity in whole blood. Blood. 105 (7), 2764-2770 (2005).
- Camera, M., et al. Tissue factor and atherosclerosis: Not only vessel wall-derived TF, but also platelet-associated TF. Thromb Res. 129 (3), 279-284 (2012).
- Siddiqui, F. A., Desai, H., Amirkhosravi, A., Amaya, M., Francis, J. L. The presence and release of tissue factor from human platelets. Platelets. 13 (4), 247-253 (2002).
- Munnix, I. C., Cosemans, J. M., Auger, J. M., Heemskerk, J. W. Platelet response heterogeneity in thrombus formation. Thromb Haemost. 102 (6), 1149-1156 (2009).
- Heemskerk, J. W., Mattheij, N. J., Cosemans, J. M. Platelet-based coagulation: Different populations, different functions. J Thromb Haemost. 11 (1), 2-16 (2013).
- Brambilla, M., et al. Human megakaryocytes confer tissue factor to a subset of shed platelets to stimulate thrombin generation. Thromb Haemost. 114 (3), 579-592 (2015).
- Vignoli, A., et al. Tissue factor expression on platelet surface during preparation and storage of platelet concentrates. Transfus Med Hemother. 40 (2), 126-132 (2013).
- Rao, L. V., Kothari, H., Pendurthi, U. R. Tissue factor encryption and decryption: facts and controversies. Thromb Res. 129 (Suppl 2), S13-S17 (2012).
- Vira, S., Mekhedov, E., Humphrey, G., Blank, P. S. Fluorescent-labeled antibodies: Balancing functionality and degree of labeling. Anal Biochem. 402 (2), 146-150 (2010).
- Brambilla, M., et al. Cell surface platelet tissue factor expression: Regulation by P2Y(12) and Link to residual platelet reactivity. Arterioscler Thromb Vasc Biol. 43 (10), 2042-2057 (2023).
Reprints and Permissions
Erratum
Formal Correction: Erratum: Flow Cytometry Analysis of Tissue Factor Expression in Human Platelets
Posted by JoVE Editors on 4/09/2026. Citeable Link.
This corrects the article 10.3791/67356-v
