A method to quantify micro- and nano-plastics originating from polybutylene adipate terephthalate in soil using nuclear magnetic resonance spectroscopy is described here. This technique improves on existing methodology because it extends to quantification of nanoplastics and it can easily be adapted for processing environmental samples in bulk.
A subscription to JoVE is required to view this content. Sign in or start your free trial.
Method Article
Quantification of Polybutylene Adipate Terephthalate-based Micro- and Nano-plastics from Soil Using Proton Nuclear Magnetic Resonance Spectroscopy
In This Article
Summary
Abstract
A method to recover and quantify micro- and nano-plastics (MPs and NPs) formed in the soil during biodegradation is needed to accurately assess the degradation and environmental impact of biodegradable plastic products. The presence of MPs and NPs in soil may alter soil properties like aggregation behavior or have toxic effects on soil biota. Existing MP recovery methods are not always suitable for measuring biodegradable polymers like polybutylene adipate terephthalate (PBAT); some common digestion procedures with acids or oxidizers can destroy PBAT-based biodegradable MPs. Identification methods like micro-FTIR and micro-Raman spectroscopy are also limited by the minimum size of particles that can be recovered and analyzed. Therefore, this method was developed to extract and quantify PBAT from soil to assess the mass fraction of MPs and NPs in the soil without chemically transforming PBAT. In the protocol, a chloroform-methanol solution is used to selectively extract PBAT from the soil. The solvent is evaporated from the extract, and then the extract is redissolved in deuterated chloroform. The extract is analyzed by proton nuclear magnetic resonance spectroscopy (1H-QNMR) under quantitative parameters to quantify the amount of PBAT in each sample. Solvent extraction efficiencies for PBAT range from 76% in a shady loam soil to 45% in an Elkhorn sandy loam soil. PBAT recovery may be reduced for photo-oxidized materials compared to pristine ones and may be reduced in soils with high clay content. Extraction efficiencies do not depend on PBAT concentration within the test range, but lower extraction efficiencies were observed for NPs than for MPs. PBAT quantification results were comparable to the quantification of plastic degradation by measuring cumulative soil respiration in a laboratory incubation study.
Introduction
Methods to measure MP contamination in soil are necessary to understand the scope of plastic contamination in global soils1, sources of plastic contamination2, and potential solutions3. Agricultural soils are uniquely exposed to plastic contamination: more than 15 million metric tons of plastic are used in agriculture each year as of 20214, including 2.5 million tons of plastic mulch5. Plastic mulch is used in close contact with soil, reapplied one or more times per year6, and can be difficult to fully remove from soil after their useful life7. One key area where MP measurement methods are needed is in the assessment of biodegradable plastic products like biodegradable plastic mulches for use in vegetable systems8.
Biodegradable-in-soil plastic products are promising alternatives to conventional agricultural plastics because they could eliminate plastic contamination of soil by plastic mulching if they work as intended. In 2022, less than 1 million metric tons of biodegradable plastic were produced globally, with rapid growth expected for the industry9. The four most common biodegradable polymers, polylactic acid (PLA), polymerized starch, polyhydroxyalkanoates (PHA), and polybutylene adipate terephthalate (PBAT), are all used commercially or experimentally in agricultural biodegradable plastic mulches10. Despite their promise, the degradation of these biodegradable plastic products in field conditions is variable11. While some studies of biodegradable plastic mulch degradation in the field have focused on macroplastic fragments11, assessing the complete degradation of plastic materials requires the ability to recover MPs and NPs from soil. Microplastic quantification from soil is also important to assess the potential for negative impacts on soil ecosystems from MP pollution12.
Some commonly used techniques for MP identification and quantification include visual analysis, micro-Fourier-transformed infrared spectroscopy (µFTIR), micro-Raman spectroscopy (µRaman), gas chromatography-mass spectroscopy (GCMS including pyrolysis GCMS and thermal extraction desorption GCMS), and thermogravimetric analysis13. Other developing techniques include near-infrared spectroscopy for in situ MP measurement in soils14, fatty acid methyl esterification extraction for GCMS analysis15, and nuclear magnetic resonance spectroscopy16. As many as 90% of studies quantifying MPs in soil used visual analysis (alone or paired with other techniques) to identify plastic particles, while 77% used FTIR, Raman, or GCMS spectroscopy techniques17. Developing and harmonizing a diverse variety of MP quantification techniques can help expand the scientific community's ability to answer diverse microplastic research questions18. Three generic approaches exist to prepare soil samples to quantify microplastics: 1) separating unchanged individual microplastic particles from the soil (ex. by density separation), 2) extracting transformed plastic or polymer material (ex. by dissolution), or 3) analyzing bulk soil. Both µFTIR and µRaman spectroscopy require individual MPs to be separated from the soil before they can be chemically identified19 while pyro-GCMS may be performed on isolated plastic particles separated from soil or bulk soil20. Separating biodegradable MPs from soil can be difficult because some digestions used to remove soil organic matter can degrade or otherwise chemically alter biodegradable polymers, including PBAT21. Micro-Raman and µFTIR spectroscopy both also have a spatial resolution limit: particles must be larger than 10-20 µm for µFTIR and 1 µm for µRaman (if individual particles this small can be prepared for analysis)19,22. These techniques can provide chemical identification of MP polymers, and spectroscopic imaging can be employed to measure MP size22. All types of pyro-GCMS are limited in that samples are destroyed during analysis.
NMR has been used successfully to characterize soil constituents and contaminants23, to quantify MPs16,24,25,26, and to assess the degradation of PBAT and another polymer, polystyrene27,28. When run under quantitative parameters, 1H-NMR spectroscopy produces spectra where the area of each spectral peak is directly proportional to the number of contributing hydrogens in the sample; this allows for quantification of the constituent components in a sample29. NMR is a valuable analytical technique for quantifying some MPs, including PBAT, within soil because it allows for simultaneous quantification and identification, it is suitable for complex and impure mixtures, and it does not require chemically identical reference standards30,31. NMR spectroscopy of a solvent extract could quantify MPs or NPs smaller than those that can be processed for µFTIR, µRaman, or GCMS quantification. Despite these advantages, quantitative NMR approaches still provide lower sensitivities than destructive mass spectroscopy-based approaches32.
The proposed method, diagramed in Figure 1, describes a workflow to process and analyze soil samples containing PBAT - including nano-sized PBAT plastics. In the method, PBAT polymer is extracted from soil samples by shaking the soil with a mixture of chloroform and methanol. The solvent extracts containing PBAT are dried and then redissolved in deuterated chloroform with an added internal calibrant. NMR spectroscopy is conducted on the extracts using quantitative parameters. The resulting spectra are analyzed to quantify PBAT by comparing the area of fitted peaks corresponding to hydrogen atoms of the PBAT and calibrant molecules. This method applies the solvent extraction and proton nuclear magnetic resonance spectroscopy (1H-NMR) approach demonstrated by Nelson et al.33. The goal was to employ a method suitable to process environmental scale samples (~100 g of soil) and to process a number of samples in parallel without specialized extraction equipment.
Access restricted. Please log in or start a trial to view this content.
Protocol
1. Collection and preparation of soil
NOTE: Sampling and processing equipment should not contain the polymer PBAT or its constituents to avoid sample contamination. Other polymer materials do not necessarily interfere with the quantification of PBAT from the soil. For example, polyethylene and polypropylene do not produce spectral peaks in chloroform 1H-NMR which interfere with the quantification of PBAT34, but polyethylene terephthalate, with its terephthalate group, most likely would interfere35, as could other polyesters. Reference texts like Brandolini and Hills34 can be used to determine the 1H-NMR spectra of various polymers and screen for overlapping peaks with the PBAT peaks used for quantification (described below).
- Collect at least 100 g equivalent dry weight of soil for each sample. Determine soil sample size based on the expected concentration of plastics in order to collect a representative sample and homogenize the soil to collect a subsample if needed36.
NOTE: Soil systems are inherently heterogeneous37, as are contaminant distributions (e.g., MPs) within them38. There is also variability associated with methods used to measure contaminant concentrations39. Therefore, it is recommended to create a sampling design or experimental design that includes replicate samples as a tool to estimate uncertainty and to collect representative sample volumes based on the plastic concentration40. MP concentrations in soil have been documented to range from near zero to 1 x 10⁷ items per kg of soil, with most sites containing less than 10,000 items per kg of soil41. A theoretical representative elementary volume could range from 23 m2 at an MP concentration of 10 items per square meter to 0.02 m2 when MP concentrations are 10,000 items per square meter36.- To increase the effective sampling area from a field site while minimizing the amount of soil that must be processed, collect soil from a large area (e.g., 1 m2), then use the quartering method to homogenize and consolidate the sample (e.g., to 500 g of soil)36.
- In the quartering method, pile soil from a large area onto a tarp or other surface, mix thoroughly using a shovel, then divide into quarters. Retain one-quarter of the sample and discard the other three-quarters. Repeat this process until the sample is of the desired size.
- Sieve the soil through a 2 mm mesh sieve. Completely clean the sieve and catch pan between soil samples.
- Air dry soil, then store in sealed sample bags. Dry soil may be stored in this state before PBAT extraction.
2. Extraction of PBAT from soils
CAUTION: Chloroform is volatile and toxic. Store it in the dark in amber glass, away from oxidizers. While working with it, wear appropriate gloves, eye protection, and protective clothing. Handle it only in a fume hood. Methanol is flammable, volatile, and toxic. Store methanol in a fire-proof cabinet. While working with methanol, wear appropriate gloves, eye protection, and protective clothing. Handle methanol only in a fume hood. Glassware may break and cause injury. Wear eye protection when handling glassware. Avoid touching broken glass with bare hands. Instead, clean up broken glass with cut-resistant gloves, tongs, broom, or another tool.
NOTE: Chloroform is not compatible with most plastics or metals. Ensure that all materials are compatible (e.g., glass or polytetrafluoroethylene, PTFE plastic).
- In a fume hood, prepare 100 mL of 90:10 v/v mixture of chloroform (trichloromethane; CHCl3) and methanol (CH3OH) per sample to be extracted. For example, to extract from 5 samples, mix 450 mL of chloroform with 50 mL of methanol.
- Add 100 g of dry soil, 100 mL of chloroform-methanol solution, and 20 glass beads into a glass extraction jar. Seal extraction jars tightly with PTFE-lined lids so that no solvent vapor can exit the jars.
NOTE: PBAT is highly soluble in chloroform; a chloroform-methanol mixture was used because methanol can form hydrogen bonds with solutes, competing with soil mineral and organic constituents and increasing the recovery of PBAT from the soil33. - Use a shaker table to shake the extraction jars for 8 h at 200 rpm. After shaking, allow the soil in the extraction jars to settle for at least 4 h.
- Separate extract from soil. In the fume hood, uncap an extraction jar and transfer the liquid by pipet through a qualitative paper filter with a pore size of 11 µm into a labeled clean glass jar. Record the volume of solvent recovered from the extraction jar. Avoid transferring soil solids with the extract; leave a few mL of solvent behind if needed.
NOTE: The filter paper is intended to remove large pieces of organic matter from the solvent solution. - Dry the extracts by leaving them in the fume hood until the solvent is completely evaporated. This may take up to 24 h. Dry the soil in the fume hood as well. Once the soil is completely dry, discard it.
- Once extracts are dry, cap each sample jar and store them in a cool, dark, dry area until needed.
3. Collection of NMR spectra
CAUTION: Deuterated chloroform poses the same risks and requires the same precautions as protonated chloroform described above.
- Add an internal calibrant42 to the sample. Use a balance to weigh 1.00 mg of 1,4-dimethoxybenzene (DMB; C6H14O) into each sample jar containing a dried extract.
- Resuspend the sample in deuterated chloroform (CDCl3; trichloro(deutero)methane). In the fume hood, use a micropipette to add 500 µL of deuterated chloroform to the jar with dried sample extract.
- Cap the jar and shake to dissolve the dried extract by tapping the jar gently against a hand or benchtop, approximately 10x on each side. Then use a clean pipet tip to transfer the liquid into an NMR tube.
- Repeat steps 3.2 and 3.3 with an additional 500 µL of deuterated chloroform, adding the second portion of the sample to the same NMR tube as the first. The second rinse is intended to ensure full dissolution and recovery of the dried extract from the container.
- Cap the NMR tube and store it for 3 days before collecting the NMR spectra. Appropriate storage time will depend on the evaporation rate of solvent from the NMR tube. Analyze samples shortly after preparing them with deuterated chloroform.
- To transport NMR tubes to the spectrometer, use a holder designed to support the long, delicate tubes. These typically have support near the base and the top of the tube. Keep the tubes in an upright position during transport.
- Using a 500 MHz NMR spectrometer, collect a 1H proton spectrum with a 90° pulse angle29, a pulse width of 8 µs33, a 25 s delay time (determined by the inversion recovery experiment29,43), 262K points per scan, and 32 composite scans29,44 from 12 to -2 ppm for a 25 min total runtime.
NOTE: We used a Bruker Neo 500 MHz spectrometer with a broadband-optimized probe and autosampler at a controlled temperature of 300 K. Other similar spectrometers can be used. If using an instrument with a different magnetic field strength, the appropriate delay time can be calculated based on the T1 relaxation time for PBAT and 1,4-dimethoxybenzene using an inversion recovery experiment29,43. - After the sample has been run, save, transfer, or access the spectral data as necessary.
Inspect spectral data. Check that all PBAT peaks used in quantification are clearly resolved if present. Use PBAT peaks 5 (8.10 ppm), 6 (4.44 ppm), 6' (4.38 ppm), 3' (4.15 ppm), and 3 (4.09 ppm) for quantification (details in Table 1). Use DMB peaks A (6.84 ppm) and B (3.77 ppm) also for quantification (details in Table 2). Take particular note of the 6, 6', 3', and 3 peaks of PBAT, which appear very close to each other and may overlap. - If some peaks are not clearly resolved, dilute the sample. Combine 100 µL of sample and 500 µL of deuterated chloroform in a clean NMR tube and rerun the sample under the same parameters defined in step 3.7.
4. Analysis of NMR spectra to quantify PBAT
NOTE: Spectral analysis may be conducted at any time after collection. Analyzing data the same day as spectra are produced is preferred to ensure samples are still available to rerun in case of any issues.
- Open the FID file created by the spectrometer in the NMR FID processing software (we used MestreNova from MestreLab, other options but other options are available).
- Apply line broadening to the spectra: In the FID processing software, select Processing Template in the Processing menu, then navigate to the Apodization section. Select an exponential model with a magnitude of 0.5 Hz and a first point of 0.5 Hz.
- Apply auto phase correction by clicking the Auto Phase Correction button in the Processing menu. Apply auto baseline correction by clicking the Auto Baseline Correction button in the Processing menu.
- Use peak deconvolution to fit the measured spectral peaks: in the Analysis tab of the spectra processing software, in the Fitting section, click the New Fit button. Use the cursor to click on the spectra at a shift of 8.5 ppm, then drag the cursor to a shift of 3.0 and release.
- Click Line Fitting Table under the Fitting section to view all fitted peaks.
- Retain the peaks used for quantification as described in Table 1 and Table 2 and labeled in Figure 2. Use PBAT Peaks 5 (8.10 ppm), 6 (4.44 ppm), 6' (4.38 ppm), 3' (4.15 ppm), and 3 (4.09 ppm) in quantification (details in Table 1), as well as DMB peaks A (6.84 ppm) and B (3.77 ppm). The hydrogen atoms that correspond to each peak listed in Table 1 and Table 2 are labeled in the structural diagrams in Figure 3, with Figure 3A showing the structure of the two PBAT dimers, Figure 3B showing how the dimers' position in the polymer interacts to alter peak shift in hydrogens from the 1,4-butanediol monomer, and Figure 3C showing the structure of DMB.
- Delete all other peaks from the fit by selecting the unwanted peaks and clicking Delete Peak.
- Use the Fitting Table to copy the area of each peak into a spreadsheet application for calculations (we chose to use spreadsheet).
- To copy peak areas to a spreadsheet, first select all the peak information in the Line Fitting Table. Then right-click and choose Copy from the pop-up menu. Paste the data into the spreadsheet.
- Calculate the number of moles of DMB added to the sample, nDMB, using the equation
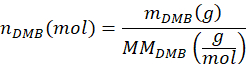
where mDMB is the mass of DMB added to the sample in grams (suggested 1.00 mg) and MMDMB is the molar mass of DMB (138.17 g/mol). - Calculate the number of moles of the butylene terephthalate dimer of PBAT in the sample, nBT, using the equation

where A5 is the measured area of PBAT peak 5, AA is the measured area of DMB peak A, and AB is the measured area of DMB peak B. The area units produced by the spectral analysis software are arbitrary. - Calculate the number of moles of the butylene adipate dimer of PBAT in the sample, nBA, using the equation

where A3 is the measured area of PBAT peak 3, A3' is the measured area of PBAT peak 3', A6 is the measured area of PBAT peak 6, and A6' is the measured area of PBAT peak 6'. The area units produced by the spectral analysis software are arbitrary. - Calculate the mass of PBAT in the sample, mPBAT,recovered, using the equation

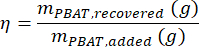
where MMBA is the molar mass of a BA dimer from PBAT (200 g/mol), and MMBT is the molar mass of a BT dimer from PBAT (220 g/mol). - If a known amount of PBAT was present in the sample, then the percent recovery, η, can be calculated for the sample as a measure of extraction efficiency according to the equation
- Calculate the concentration of PBAT in a sample, CPBAT, using the equation

where mdry soil is the mass of dry soil used to produce the extract (0.1 kg), Vsolvent recovered is the volume of solvent recovered from the soil in step 2.4, and Vsovlent added is the initial amount of solvent added to the soil sample (100 mL).
5. Preparation of calibration curve for quantification of PBAT from a particular soil
NOTE: A calibration curve created based on soil samples with known amounts of PBAT added will provide useful information about how PBAT is extracted and recovered from a particular soil. Extraction is not the same for all soils or all forms of PBAT. We suspect extraction efficiency is dependent on soil clay and organic matter content33, and recommend creating a calibration curve for each soil series and horizon of interest. The calibration curve can be created before or after unknown samples are processed with this method.
- Collect and prepare the equivalent of 2.5 kg of dry soil as described in steps 1.1-1.3.
- Determine the range to be covered by the calibration curve; the maximum concentration of PBAT used in the calibration curve should be higher than the highest PBAT concentration among unknown samples.
- Prepare or obtain sufficient PBAT plastic to create 5 spiked samples of 100 g of soil with 0%, 25%, 50%, 75%, and 100% of the maximum concentration (25 samples total). For example, if 40 mg/kg is the desired maximum concentration, a total of 50 mg of PBAT will be needed to create the spiked samples.
- Prepare 25 samples of 100 g of soil each. Spike the samples by weighing PBAT-based plastic and adding it to soil samples at the prescribed rates. For example, if 40 mg/kg of PBAT is the desired maximum concentration, create 5 samples with no PBAT, 5 samples with 1 mg of PBAT, 5 samples with 2 mg of PBAT, 5 samples with 3 mg of PBAT, and 5 samples with 4 mg of PBAT. After adding PBAT to the soil, mix well.
- Extract PBAT from the 25 spiked samples, then collect NMR spectra from the extracts and analyze the resulting spectra as described in steps 2.1 through 4.16.
- Identify the equation of a calibration curve for PBAT in this soil by performing a linear regression between the measured amount of PBAT in each spiked sample and the actual amount of PBAT added in a statistical analysis tool. We used a spreadsheet. If no PBAT is detected in the spiked samples with no PBAT added, then force b = 0 in the regression.
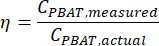
NOTE: A linear regression test assesses the strength of the linear relationship between two continuous numerical variables x and y, according to the relationship y = mx + b. The values of m and b that best fit the data are computed by the test. The r2 coefficient of the regression test describes how closely correlated the two variables are to each other. - Test for a significant relationship between extraction efficiency and PBAT concentration using the statistical analysis tool. Calculate the extraction efficiency of PBAT from the spiked samples as
- Use the statistical analysis tool to calculate the probability that the observed data could occur randomly without a correlation between extraction efficiency and PBAT concentration. If this p-value is greater than the predetermined significance threshold, α, then it fails to reject the null hypothesis that there is no relationship between the two variables. If this is the case, the extraction efficiency can be assumed to be constant for all concentrations of PBAT within the tested range. If the null hypothesis is rejected, the linear model described here may not be the best way to model the data.
- Use the calibration curve linear regression equation to estimate the amount of PBAT in unknown samples processed using this method. If the regression x variable was the actual amount of PBAT in calibration curve spiked samples, the y variable was the measured amount of PBAT, and b was set to 0, then

NOTE: The PBAT content of replicate samples estimated using a calibration curve equation can be used to generate a confidence interval for the amount of PBAT in a particular soil, or if a mean and confidence interval could be calculated for the PBAT concentrations in replicate extracts, then the calibration curve could be applied to estimate the PBAT concentration in soil. Either order of operations produces the same confidence interval for PBAT content in soil. For example, consider extracts from 10 replicate samples that have PBAT concentrations of 10, 5, 2, 4, 10, 11, 2, 6, 8, and 5 mg/kg and the calibration curve equation y(measured PBAT in extract) =0.75 x (true PBAT in soil). Soil PBAT concentrations in each replicate could be estimated as 13, 7, 3, 5, 13, 15, 3, 8, 11, and 7 mg/kg. Then mean PBAT concentration in soil would be estimated as 8.4 mg/kg with a standard deviation of 4.4 mg/kg. If a mean and standard deviation are first calculated for extract PBAT concentrations (10, 5, 2, 4, 10, 11, 2, 6, 8, and 5), a mean of 6.3 mg/kg and a standard deviation of 3.3 mg/kg would be calculated. Then, the calibration curve could be applied to both mean and standard deviation to estimate the PBAT concentration in soil: mean of 8.4 mg/kg, standard deviation of 4.4 mg/kg.
Access restricted. Please log in or start a trial to view this content.
Results
To assess the efficacy of this method in quantifying PBAT polymer from the soil, calibration curves were constructed by extracting PBAT from spiked samples created from three different soils. For each of the three soils (details in Table 3), the soil was passed through a 2 mm sieve and then air dried. Spiked samples were created by adding 0, 9, 18, 27, or 36 mg of PBAT-based MP to 100 g of dry soil (5 replicates of each). This is equivalent to 0, 63, 126, 189, or 252 mg/kg of PBAT polymer. MPs were made ...
Access restricted. Please log in or start a trial to view this content.
Discussion
We propose a method for solvent extraction of PBAT from soil coupled with 1H-NMR to quantify PBAT in the extract. Key elements of the extraction process include the extraction technique and equipment, the solvent used to extract, and the time requirements. We chose to use an extraction technique that requires relatively simple and inexpensive equipment (glass jars, glass beads, and a shaker table) compared to the Soxhlet extraction and accelerated solvent extraction (ASE) demonstrated by Nelson et al.
Access restricted. Please log in or start a trial to view this content.
Disclosures
The authors declare that they have no known competing financial interests or personal relationships that could have appeared to influence the work reported in this paper.
Acknowledgements
Thank you to the USDA-NIFA for funding this project through award number 2020-67019-31167 to SMS and to the University of Tennessee Strategic Planning Research Initiatives (SPRINT) program for an internal grant DGH and SMS. The funders had no role in study design, data collection, analysis, interpretation, report writing, or the decision to submit the article for publication.
Access restricted. Please log in or start a trial to view this content.
Materials
| Name | Company | Catalog Number | Comments |
|---|---|---|---|
| 1,4-dimethoxybenzene | Arcos Organics 99%+ | AC115411000 | 1 mg per sample |
| Amber glass bottle with PTFE lined lid (1 L) | Kimble | 5223253C-26 | reusable |
| Chloroform; trichloromethane | Fisher Chemical | AA43685M6 | 90 mL per sample; Fisher Optima |
| Deuterated chlorform; trichloro(deuterio)methane | Sigma Aldrich | 1034200025 | 1 mL per sample; minimum 99.8% deuterated; stabilized with silver |
| Glass beads (3 mm diameter) | Propper Manufacturing | 3000600 | 20 per sample |
| Glass extraction jars with PTFE lined lid (~250 mL volume) | Kimble | 5510858B | 2 per sample, reusable |
| Graduated cylinder, 1 L, polypropylene | Nalgene | 3662-1000 | reusable |
| Graduated cylinder, 500 mL, polypropylene | Nalgene | 3662-0500 | reusable |
| Methanol | Fisher Chemical | A412-4 | 20 mL per sample; certified ACS |
| Micropipette wth range of 0.5 - 1 mL | Fisher Scientific | 3123000063 | reusable |
| NMR spectrometer | Bruker | n/a | 500 MHz instrument |
| NMR tube (7 inch height, high-throughput) | Wilmad | WG-1000-7 | 1 per sample |
| Platform shaker | Eppendorf, Excella E5 | M1355-0000 | reusable |
| Polyethylene pipette tip (10 mL volume) | Eppendorf | 22492098 | 1 per sample, single use |
| Polypropylene micropipette tips (1 mL volume) | Fisher Scientific | 02-707-510 | 3 per sample, single use |
| Semi-microbalance | Mettler Toledo | 30532226 | reusable |
References
- Andrady, A. L. The plastic in microplastics: A review. Mar Pollut Bull. 119 (1), 12-22 (2017).
- Fakour, H., et al. Quantification and analysis of microplastics in farmland soils: Characterization, sources, and pathways. Agriculture. 11 (4), 330(2021).
- Wang, K., et al. Impact of long-term conventional and biodegradable film mulching on microplastic abundance, soil structure and organic carbon in a cotton field. Environ Pollut. 356, 124367(2024).
- Plastics Europe Plastics - the Facts. , Plastics Europe. Available from: https://plasticseurope.org/knowledge-hub/plastics-the-facts-2022/ (2022).
- Assessment of agricultural plastics and their sustainability: A call for action. , Food Agriculture Organization. Rome. (2021).
- Beriot, N., et al. Intensive vegetable production under plastic mulch: A field study on soil plastic and pesticide residues and their effects on the soil microbiome. Sci Total Environ. 900, 165179(2023).
- Liu, E. K., He, W. Q., Yan, C. R. White revolution to white pollution - Agricultural plastic film mulch in China. Environ Res Lett. 9 (9), 091001(2014).
- Sintim, H. Y., et al. Release of micro- and nanoparticles from biodegradable plastic during in situ composting. Sci Total Environ. 675, 686-693 (2019).
- Skoczinski, P., et al. Bio-based building blocks and polymers - Global capacities, production and trends 2023-2028. Indust Biotech. 20 (2), 52-59 (2024).
- Hayes, D. G., et al. Effect of diverse weathering conditions on the physicochemical properties of biodegradable plastic mulches. Polymer Testing. 62, 454-467 (2017).
- Li, C., et al. Effects of biodegradable mulch on soil quality. Appl Soil Ecol. 79, 59-69 (2014).
- Wang, F., Wang, Q., Adams, C. A., Sun, Y., Zhang, S. Effects of microplastics on soil properties: Current knowledge and future perspectives. J Hazardous Mater. 424, 127531(2021).
- Möller, J. N., Löder, M. G. J., Laforsch, C. Finding microplastics in soils: A review of analytical methods. Environ Sci Technol. 54 (4), 2078-2090 (2020).
- Paul, A., Wander, L., Becker, R., Goedecke, C., Braun, U. High-throughput NIR spectroscopic (NIRS) detection of microplastics in soil. Environ Sci Pollut Res. 26 (8), 7364-7374 (2019).
- Wortman, S. E., Jeske, E., Samuelson, M. B., Drijber, R. A new method for detecting micro-fragments of biodegradable mulch films containing poly(butylene adipate-co-terephthalate) (PBAT) in soil. J Environ Quality. 51 (1), 123-128 (2021).
- Peez, N., et al. Quantitative analysis of PET microplastics in environmental model samples using quantitative 1H-NMR spectroscopy: Validation of an optimized and consistent sample clean-up method. Anal Bioanal Chem. 411 (28), 7409-7418 (2019).
- Praveena, S. M., Aris, A. Z., Singh, V. Quality assessment for methodological aspects of microplastics analysis in soil. Trend Environ Anal Chem. 34, e00159(2022).
- Primpke, S., et al. Critical assessment of analytical methods for the harmonized and cost-efficient analysis of microplastics. Appl Spectro. 74 (9), 1012-1047 (2020).
- Käppler, A., et al. Analysis of environmental microplastics by vibrational microspectroscopy: FTIR, Raman or both. Anal Bioanal Chem. 408 (29), 8377-8391 (2016).
- Watteau, F., Dignac, M. F., Bouchard, A., Revallier, A., Houot, S. Microplastic detection in soil amended with municipal solid waste composts as revealed by transmission electronic microscopy and pyrolysis/GC/MS. Front Sustainable Food Syst. 2, 407866(2018).
- Pfohl, P., et al. Microplastic extraction protocols can impact the polymer structure. Microplastics Nanoplastics. 1 (1), 1-13 (2021).
- Xu, J. L., Thomas, K. V., Luo, Z., Gowen, A. A. FTIR and Raman imaging for microplastics analysis: State of the art, challenges and prospects. Trend Anal Chem. 119, 115629(2019).
- Cardoza, L. A., Korir, A. K., Otto, W. H., Wurrey, C. J., Larive, C. K. Applications of NMR spectroscopy in environmental science. Prog Nucl Magnetic Resonance Spectr. 45 (3-4), 209-238 (2004).
- Peez, N., Rinesch, T., Kolz, J., Imhof, W. Applicable and cost-efficient microplastic analysis by quantitative 1H-NMR spectroscopy using benchtop NMR and NoD methods. Magnetic Resonance Chem. 60 (1), 172-183 (2022).
- Günther, M., Imhof, W. Simultaneous quantification of microplastic particles by non-deuterated (NoD) 1 H-qNMR from samples comprising different polymer types. Analyst. 148 (5), 1151-1161 (2023).
- Papini, G., Petrella, G., Cicero, D. O., Boglione, C., Rakaj, A. Identification and quantification of polystyrene microplastics in marine sediments facing a river mouth through NMR spectroscopy. Marine Pollut Bull. 198, 115784(2024).
- Herrera, R., Franco, L., Rodríguez-Galán, A., Puiggalí, J. Characterization and degradation behavior of poly(butylene adipate-co-terephthalate)s. J Polymer Sci Part A. 40 (23), 4141-4157 (2002).
- Mauel, A., Pötzschner, B., Meides, N., Siegel, R., Strohriegl, P., Senker, J. Quantification of photooxidative defects in weathered microplastics using 13 C multiCP NMR spectroscopy. RSC Adv. 12 (18), 10875-10885 (2022).
- Bharti, S. K., Roy, R. Quantitative 1H NMR spectroscopy. Trend Anal Chem. 35, 5-26 (2012).
- Li, X., Hu, K. Quantitative NMR Studies of Multiple Compound Mixtures. Ann Rep NMR Spectro. 90, 85-143 (2017).
- Simmler, C., Napolitano, J. G., McAlpine, J. B., Chen, S. N., Pauli, G. F. Universal quantitative NMR analysis of complex natural samples. Curr Opinion Biotechnol. 25, 51-59 (2014).
- Giraudeau, P. Challenges and perspectives in quantitative NMR. Magnetic Reason Chem. 55 (1), 61-69 (2017).
- Nelson, T. F., Remke, S. C., Kohler, H. P. E., McNeill, K., Sander, M. Quantification of Synthetic Polyesters from Biodegradable Mulch Films in Soils. Environ Sci Technol. 54, 266-275 (2020).
- Brandolini, A. J., Hills, D. D. NMR spectra of polymers and polymer additives. , CRC Press. Boca Raton. (2000).
- Matsuda, H., Asakura, T., Miki, T. Triad sequence analysis of poly(ethylene/butylene terephthalate) copolymer using 1H NMR. Macromolecules. 35 (12), 4664-4668 (2002).
- Yu, Y., Flury, M. How to take representative samples to quantify microplastic particles in soil. Sci Total Environ. 784, 147166(2021).
- Cambardella, C. A., et al. Field-scale variability of soil properties in central Iowa soils. Soil Sci Soc Am J. 58, 1501-1511 (1994).
- Ramsey, M. H., Argyraki, A. Estimation of measurement uncertainty from field sampling: Implications for the classification of contaminated land. Sci Total Environ. 198 (3), 243-257 (1997).
- Desaules, A. Critical evaluation of soil contamination assessment methods for trace metals. Sci Total Environ. 426, 120-131 (2012).
- Pennock, D., Yates, T., Braidek, J. Soil Sampling Designs. Soil Sampl Meth Anal. , 25-38 (2006).
- Büks, F., Kaupenjohann, M. Global concentrations of microplastics in soils - A review. SOIL. 6 (2), 649-662 (2020).
- Bowen, M., O'Neill, I., Pringuer, M. Quantitiative Applications of Nuclear Magnetic Resonance in Pharmaceutical Analysis. Proc Soc Anal Chem. , 294-297 (1974).
- Frank, O., Kreissl, J. K., Daschner, A., Hofmann, T. Accurate determination of reference materials and natural isolates by means of quantitative 1H NMR spectroscopy. J Agri Food Chem. 62 (12), 2506-2515 (2014).
- Malz, F., Jancke, H. Validation of quantitative NMR. J Pharma Biomed Anal. 38 (5), 813-823 (2005).
- Astner, A. F., et al. Forming micro-and nano-plastics from agricultural plastic films for employment in fundamental research studies. J Vis Exp. (185), e641112(2022).
- Anunciado, M. B., et al. Effect of environmental weathering on biodegradation of biodegradable plastic mulch films under ambient soil and composting conditions. J Polymer Environ. 29 (9), 2916-2931 (2021).
- Deshoulles, Q., et al. Hydrolytic degradation of biodegradable poly(butylene adipate-co-terephthalate) (PBAT) - Towards an understanding of microplastics fragmentation. Polymer Degrad Stability. 205, 110122(2022).
- Zhang, Y., et al. Aging significantly increases the interaction between polystyrene nanoplastic and minerals. Water Res. 219, 118544(2022).
- Peez, N., Janiska, M. C., Imhof, W. The first application of quantitative 1H NMR spectroscopy as a simple and fast method of identification and quantification of microplastic particles (PE, PET, and PS). Anal Bioanal Chem. 411 (4), 823-833 (2019).
Access restricted. Please log in or start a trial to view this content.
Reprints and Permissions
