In this manuscript, we provide a comprehensive protocol for assessing antibiotic survival for Pseudomonas aeruginosa and Staphylococcus aureus, transforming plasmids into P. aeruginosa and S. aureus to create reporter strains and visualize phenotypic variants, such as persisters, by time-lapse epifluorescence microscopy.
Method Article
Time-Lapse Epifluorescence Microscopy Imaging of Pseudomonas aeruginosa and Staphylococcus aureus Heterogeneous Phenotypes
* These authors contributed equally
In This Article
Summary
Abstract
Antibiotic persistence is a phenomenon in which a small number of bacterial cells in a genetically susceptible population survive antibiotic treatment that kills the other genetically identical cells. Bacterial persisters can resume replication once antibiotic treatment ends and are commonly thought to underlie clinical treatment failure. Recent work harnessing the power of time-lapse fluorescence microscopy, in which bacteria are labeled with fluorescent transcriptional reporters, translational reporters, and/or dyes for a variety of cellular features, has advanced our understanding of Escherichia coli persisters beyond what could be learned from population-level antibiotic survival assays. Such single-cell approaches, rather than bulk population assays, are essential for delineating the mechanisms of persister formation, damage response, and survival. However, methods for studying persisters in other important pathogenic species at this level of detail remain limited.
This study provides an adaptable approach for time-lapse imaging of Pseudomonas aeruginosa (a gram-negative rod) and Staphylococcus aureus (a gram-positive coccus) during antibiotic treatment and recovery. We discuss molecular genetic approaches to introduce fluorescent reporters into these bacteria. Using these reporters, as well as dyes, we can track the phenotypic changes, morphological features, and fates of individual cells in response to antibiotic treatment. Additionally, we are able to observe the phenotypes of individual persisters as they resuscitate following treatment. In all, this work serves as a resource for those interested in tracking the survival and gene expression of individual antibiotic-treated cells, including persisters, both during and after treatment, in clinically important pathogens.
Introduction
Bacterial pathogens can evade the effects of antibiotics through two primary mechanisms: antibiotic resistance, which involves genetic changes, and phenotypic tolerance, which involves non-genetic changes. Antibiotic resistance is a genetically encoded phenomenon that confers the ability of a given bacterial cell to not only survive but also replicate in the presence of an antibiotic1. Phenotypic tolerance, which can encompass antibiotic-tolerant or antibiotic-persistent bacteria, occurs when cells withstand bactericidal antibiotic treatment without gaining the ability to replicate in the presence of an inhibitory concentration of the antibiotic1,2. What differentiates tolerance from persistence is that tolerance refers to the ability of the whole population to survive treatment, whereas persistence refers to a subset of an isogenic but phenotypically heterogeneous population that survives antibiotic treatment. When a clonal culture is treated with bactericidal antibiotics and survivors that remain in the culture are plotted against time on a log-linear scale, a biphasic curve is usually detected when persisters are present. On these curves, the first phase shows that the majority of the population is killed relatively quickly, and the second phase indicates that an antibiotic persistent fraction is killed at a slower rate or not at all1,2.
Antibiotic persistence presents a major burden on global healthcare systems. For instance, Staphylococcus aureus and Pseudomonas aeruginosa persisters, which are the focus of this article, are thought to cause antibiotic-recalcitrant infections, including recurrent airway infections in patients with cystic fibrosis and chronic wound infections3,4. Therefore, further elucidating persister cell biology and phenotypic programs is critical. While progress has been made in understanding how persisters form and resuscitate, critical knowledge gaps pertaining to the coordination of metabolic reprogramming and molecular events in individual cells that underlie persistence remain5,6,7,8.
Effectively studying persistence has proven to be a technical challenge. Since persistence is only observable in a small subset of a bacterial population, techniques that sample bulk bacterial populations often fail to capture relevant biological information1,2,8,9,10. Furthermore, since phenotypic changes that underlie persistence are transient and not heritable, tracking the fate of persister cells can be complex1,8,9,10,11. Once bacterial persisters resume growth, they can divide and give rise to both persisters and non-persisters, which makes it impossible to enrich for pure persister populations by culturing. These challenges highlight the need for techniques that can fulfill the following criteria: 1) the ability to capture biological information of live, single cells and 2) the ability to be used in tandem with fluorescent dyes, probes, sensors, and reporters that allow phenotypes of individual cells in heterogeneous populations to be interrogated over time.
Recent advancements in single-cell technologies have provided an avenue to effectively investigate bacterial heterogeneity and overcome these hurdles in studying persistence12,13. Some of these techniques include fluorescence microscopy, flow cytometry/fluorescence-activated cell sorting, microfluidics, and single-cell RNA sequencing12,13. Here, we describe protocols for elucidating single-cell persister physiology using epifluorescence time-lapse microscopy of transcriptional or translational reporter strains. Fluorescence microscopy is a powerful technique that fulfills the criteria for studying persister phenotypes, namely, the ability to identify which individual cells in a large population propagate after antibiotic removal and can thus be defined as persisters. With the introduction of automated camera technologies and incubated chambers, capturing live bacterial cells is widely accessible across the field of microbiology. Crucially, time-lapse microscopy offers the ability to visualize single cells in real-time, over the course of hours and even days, which makes it possible to track bacteria before, during, and after antibiotic treatment14,15,16. Insights from these investigations harnessing time-lapse microscopy have immense potential to generate insight into the complex mechanisms of persister biology.
Protocol
1. Generating fluorescent reporter strains of S. aureus by transformation and transduction
NOTE: Reporter strains harbor a fluorescent protein to indicate the expression of a gene or protein of interest. Transcriptional reporters feature a duplicate copy of the native promoter sequence for a gene of interest upstream of a fluorescent protein so that fluorescence increases as expression of a gene of interest increases. Translational reporters link the open reading frames of a fluorescent protein and a protein of interest with a flexible peptide connector. Visualizing reporter strains with live-cell microscopy can reveal whether a given gene/protein of interest is associated with specific cell morphologies or cell fates (Figure 1, Supplementary Video 1, and Supplementary Video 2). Choose a fluorescent protein that is codon-optimized for S. aureus. While this study uses sGFP from pCM29 gifted by Dr. Alexander Horswill, the Nebraska Transposon Mutant Library Genetic Toolkit contains plasmids bearing codon-optimized sGFP, eYFP, eCFP, DsRed.T3, and eqFP65017,18.
- Transform reporter plasmids into S. aureus RN4220.
NOTE: The following protocol section was adapted from the Essentials of Staphylococcal Genetics and Metabolism Workshop at the University of Nebraska Medical Center19,20.- First, prepare electrocompetent S. aureus RN4220. Prepare 200 mL of B2 broth by combining 2 g of casamino acids, 5 g of yeast extract, 2 mL of 10% K2HPO4, pH 7.5, 2 mL of 50% glucose solution, and 5 g of NaCl. Bring the volume to 100 mL with sterile ultrapure water. Mix briefly at 37 °C to dissolve components and sterilize using a bottle-top filter (0.22 µm pore size).
- Inoculate S. aureus RN4220 from a frozen stock stored at -80 °C in 25% glycerol into 30 mL of B2 broth in a 250-mL baffled flask and incubate for 18 h at 30 °C, shaking at 125 rpm.
- Incubate two 250-mL baffled flasks with 50 mL of B2 broth each at 37 °C overnight to pre-warm the media for the next day.
- The next day, measure the OD600 of the overnight culture. Add enough overnight culture to each flask containing 50 mL of B2 broth to get a final OD600 of 0.25.
- Incubate at 37 °C, shaking at 250 rpm, until the OD600 reaches 0.35-0.4.
NOTE: Check the OD600 about 30 min after subculturing to ensure that the culture does not grow beyond 0.35-0.4. If the OD600 does not reach 0.35-0.4 within 1 h of subculturing, abandon the procedure and try again the following day. The bacteria most likely grew too much overnight and were too deep into the stationary phase. - Once the culture reaches the mid-log phase, pour the culture from each flask into a sterile 50-mL conical tube and pellet cells by centrifugation at 4,000 x g for 10 min.
- Decant the supernatant and resuspend the pellet in 1 mL of sterile, room temperature (RT) water. Transfer the cells to a microcentrifuge tube.
- Centrifuge the cells again at 21,000 x g for 30 s, remove the supernatant, and resuspend in 1 mL of sterile RT water. Repeat the centrifugation, removal of supernatant, and resuspension in 1 mL of water steps two more times for a total of three washes.
- Centrifuge the cells, remove the water, then resuspend the cells in 1 mL of sterile RT 10% glycerol (in water, sterile-filtered) and leave at RT for 15 min.
- Pellet the cells by centrifugation at 21,000 x g for 30 s, remove the supernatant, and resuspend the cells in another 1 mL of sterile, RT 10% glycerol. These cells are now electrocompetent.
- Aliquot 70 µL of electrocompetent cells into snap-cap microcentrifuge tubes and store at -80 °C for future use.
- To transform the electrocompetent S. aureus RN4220, thaw an aliquot of cells on ice. Add 1 µg of plasmid DNA to the cells, flick the sample to mix, and incubate on ice for 5 min. Then, electroporate the cells and allow them to recover in 390 μL of B2 media for 1-2 h at 37 °C, shaking at 225 rpm, and plate transformants on selective tryptic soy agar.
NOTE: Most of the shuttle vectors used in this study feature an ampicillin-resistance cassette for selection in E. coli (100 µg/mL) and a chloramphenicol- (10 µg/mL) or erythromycin- (Erm, 10 µg/mL) resistance cassette for selection in S. aureus. Many S. aureus strains that are routinely used in the lab are Erm-resistant. Ensure that a strain of interest is compatible with the selective antibiotic before using a given shuttle vector. It is important that the volume of DNA added to the cells be minimized (i.e., <5 µL) to prevent arcing, which occurs when the sample is too conductive during electroporation. Purifying high concentrations (≥300 ng/µL) of the plasmid DNA from E. coli will help keep volumes low.
- Propagate bacteriophage on transformed S. aureus RN4220.
NOTE: The following protocol section was adapted from methods by Krausz and Bose21 and Olson22. Two of the most commonly used bacteriophages for S. aureus transduction are φ11 and 80α. The procedure for harvesting both of these is the same, except that we obtain φ11 from S. aureus RN451 and 80α from S. aureus RN10359. φ11 has been used successfully with common strains JE2 and HG003, among others, and is used in this protocol23,24. However, these phages may not efficiently transduce clinical isolates that have varying phage resistances. Refer to the publications by Krausz and Bose21 and Olson22 for a method for preparing φ11 and determining phage titer.- To transduce the reporter plasmid, prepare six tryptic soy agar (TSA) plates with 5 mM CaCl2 and the proper concentration of the selective antibiotic. Streak S. aureus RN4220 transformed with the reporter plasmid onto a TSA plate containing the selective antibiotic and no CaCl2 and incubate overnight.
- The next day, turn on an incubator or water bath to 56 °C. Label six 5 mL snap-cap tubes 1 x 10⁴ through 1 x 10⁹, and aliquot 40 µL of 500 mM CaCl2 into each snap-cap tube.
- Melt soft TSA (0.5% agar) in a microwave with the cap loosened to prevent pressure buildup while maintaining sterility. Then, aliquot 4 mL into each of the snap-cap tubes. Invert the tubes to mix, then place them into the 56 °C incubator to prevent the soft agar from solidifying.
- Dilute phage stock to 1 x 10¹⁰ PFU/mL in tryptic soy broth (TSB) + 5 mM CaCl2. Add 100 µL of 1 x 10¹⁰ PFU/mL phage to a microcentrifuge tube containing 900 µL of TSB + 5 mM CaCl2 for a final concentration of 1 x10⁹ PFU/mL. Then, serially dilute into additional microcentrifuge tubes containing 900 µL of TSB + 5 mM CaCl2 until a concentration of 1 x 10⁴ PFU/mL. Label each of the six TSA + 5 mM CaCl2 + selective antibiotic agar plates with a serial dilution: 1 x10⁴ through 1 x 10⁹ PFU/mL.
- Resuspend the overnight S. aureus RN4220 containing the plasmid in 1 mL of TSB + 5 mM CaCl2. Remove the 109 snap-cap tube from the incubator and quickly add 10 µL of resuspended RN4220 containing the plasmid and 100 µL of 1 x 10⁹ PFU/mL phage dilution, invert to mix, and pour the contents onto the corresponding TSA + 5 mM CaCl2 + selective antibiotic agar plate.
- Perform this procedure for the remaining phage dilutions and their respective plates. Allow the soft agar to solidify on the plates, then incubate with the soft agar facing up overnight at 37 °C.
- The next day, ensure that plaques (areas of clearance on the bacterial lawn) are visible on the plates (Figure 2A). Plaques represent areas of lysis where phage have successfully infected RN4220, and some phage will have taken up the plasmid of interest. Select the plate with the least-diluted phage stock that has near-confluent lysis (example: 1 x 10⁹ PFU/mL phage) as well as the plates that received the two dilutions below this (in this case, 1 x 10⁸ PFU/mL and 1 x 10⁷ PFU/mL, which should both have near-confluent lysis).
- Add 3 mL of TSB + 5 mM CaCl2 to the least dilute of these plates (1 x 10⁹ PFU/mL, for this example). Use a sterile L-shaped cell spreader to gently scrape the layer of soft agar off the regular agar (Figure 2B). Use the cell spreader to disrupt the agar as much as possible to facilitate the release of phage from the soft agar.
- Once the soft agar on the first plate has been thoroughly disrupted, gently pour the soft agar and broth slurry onto the next plate (in this case, 1 x 10⁸ PFU/mL). Scrape and disrupt the soft agar on this plate, then pour the resulting slurry onto the final plate and repeat.
- After preparing the soft agar slurry from all three plates, gently pour the slurry into a 50-mL conical tube. Pipette gently to further disrupt the soft agar, but avoid forming bubbles. Do not vortex, as it could damage the phage and decrease titer.
- Centrifuge the soft agar slurry at 4,000 x g for 10 min at RT. Gently pour the supernatant into a syringe connected to a 0.45 µm filter.
NOTE: It is essential to pour gently and avoid getting pieces of agar into the filter. These pieces will clog the filter and prevent filtering the remaining supernatant, decreasing titer. - Determine the titer of the resulting phage lysate using wild-type RN422021.
- Introduce reporter plasmids into S. aureus strains of interest by transduction.
- Prepare eight TSA plates containing 500 µg/mL sodium citrate and the appropriate concentration of selective antibiotic. Densely streak the desired recipient S. aureus strain onto plain TSA and incubate overnight at 37 °C.
- The next day, swab the plate and resuspend the recipient strain in 1 mL of TSB + 5 mM CaCl2.
- Dilute the phage stock carrying the desired reporter plasmid to 1 x10¹⁰ PFU/mL.
- Mix 1.5 mL of TSB + 5 mM CaCl2, 0.5 mL of resuspended recipient strain, and 0.5 mL of diluted phage stock in a 50-mL conical tube. Incubate at 37 °C, shaking at 225 rpm, for 20 min.
NOTE: Longer incubation times are not recommended because they will probably decrease transduction efficiency as the phage begins to lyse recipient cells. - Immediately afterwards, add 1 mL of sterile-filtered ice-cold 0.02 M sodium citrate (in water) to the conical tube and centrifuge at 4,000 x g for 10 min at 4 °C. Then, resuspend the pellet in 1 mL of ice-cold 0.02 M sodium citrate.
- Spread 100 µL aliquots onto each of six TSA plates containing 500 µg/mL sodium citrate and the appropriate concentration of selective antibiotic to select for transductants. Incubate overnight at 37 °C.
- The next day, streak individual colonies from the transduction plates onto the remaining two TSA plates containing 500 µg/mL sodium citrate and the appropriate concentration of selective antibiotic. Incubate overnight at 37 °C.
NOTE: This passaging step on additional sodium citrate plates helps to reduce the titer of phage around the transduced cells, preventing lysis22. - Pick individual colonies from the streak plate, grow the cells to exponential phase in TSB containing the selective antibiotic, and store in 25% glycerol at -80 °C for future use.
2. Generating fluorescent reporter strains of P. aeruginosa by conjugation
NOTE: Moving a reporter plasmid into P. aeruginosa from an E. coli cloning strain can be done by triparental mating25. A donor strain of E. coli that carries the plasmid of interest (which should contain an oriT for conjugal transfer), E. coli HB101 + pRK2013 - a helper strain to facilitate the conjugation (use 50 µg/mL kanamycin for pRK2013 plasmid maintenance), and the P. aeruginosa recipient strain that will receive the plasmid are required. For this example, the plasmid of interest has a tetracycline (Tet) resistance marker, so any E. coli culture with the plasmid will need 10 µg/mL Tet, and P. aeruginosa with the plasmid will need 75 µg/mL Tet for selection26.
- Inoculate bacteria from frozen stocks stored at -80 °C in 25% glycerol into lysogeny broth (LB) with the appropriate antibiotic for overnight growth, shaking at 225 rpm at 37 °C.
- The next day, spread 200 µL of each liquid overnight culture onto the LB agar plate with the appropriate selective antibiotic. Depending on how many transformation matings are to be done, spread more plates for the helper and donor strains. One plate of helper/donor per transformation is recommended. Incubate the plates overnight at 37 °C to get dense lawns of each strain.
- The next day, collect the lawns of growth by swabbing each plate surface with a sterile cotton swab and wiping it along the inside of a microcentrifuge tube. Centrifuge each tube briefly (pulse for 5 s) to collect the cells to the bottom of the tube. Resuspend each cell pellet in 200 µL of LB.
NOTE: The resuspensions should look very thick, opaque, and rid of clumps. - In new microcentrifuge tubes for each mating, combine 5 µL of recipient P. aeruginosa strain, 160 µL of donor E. coli strain bearing the plasmid of interest, and 160 µL of helper E. coli HB101 + pRK2013. Mix gently, pipetting up and down, then spot 50 µL of the mix onto a pre-dried LB agar plate. Also, spot 20 µL of each individual strain to the LB agar for controls. Let the spots dry into the plate completely, then incubate at 37 °C for 3-6 h.
NOTE: Pre-drying the LB agar prevents the 50 µL spot from spreading out across the surface and thus forces the cells to interact within a smaller area. - After incubation, gently swipe a pipette tip across the mating spot to transfer some cells to a new microcentrifuge tube. Centrifuge briefly to collect the cells at the bottom of the tube. Resuspend in 200 µL of LB and plate the entire resuspension to an LB + Irgasan (Igr; 25 µg/mL) + Tet (75 µg/mL) agar plate.
NOTE: P. aeruginosa is intrinsically resistant to Igrasan, and the plasmid of interest contains the Tet resistance marker, so only successfully transformed P. aeruginosa should be able to grow on the LB + Irgasan + Tet plates. Depending on the transformation efficiency, resuspending and plating the entire mating spot may result in a lawn of transformants the next day. To achieve individual colonies, either (i) resuspend the entire mating spot in a larger volume of LB and then plate 200 µL of it or (ii) transfer a small portion of the mating spot to a microcentrifuge tube and then resuspend in 200 µL and plate. - With the control spots of each individual strain, gently swipe some of the dense cell spot onto a pipette tip, transfer to a new microcentrifuge tube, resuspend in 200 µL of LB, then spot 50 µL onto an LB + Irgasan + Tet agar plate (multiple control spots can be placed onto the same agar plate). Allow the spots to dry in completely. Incubate all plates for 16-20 h overnight at 37 °C.
NOTE: For the control spots, the goal is to verify that the antibiotic plate is selective for P. aeruginosa transformants. If the control spots are too concentrated when spotted on the LB + Irgasan + Tet agar plates, then it will be difficult to determine whether the selection worked the next day because there will be a halo of dead cells that may be mistaken for growth. - The next day, confirm the antibiotic selectivity of the LB + Irgasan + Tet plates by noting the lack of cell growth for the individual strain control spots.
NOTE: Colonies that appear on the triparental mating LB + Igrasan + Tet plate are P. aeruginosa transformants carrying the plasmid of interest. - Optional to pick and streak colonies onto LB + Irgasan + Tet agar and grow overnight to get rid of excess dead E. coli from the mating mixture.
- Pick individual colonies, grow for 3-6 h in liquid LB + Tet (75 µg/mL) until visibly turbid, then bank frozen stocks in 25% glycerol (500 µL cell culture + 500 µL 50% glycerol in water). Verify that the clones are transformed successfully by colony PCR followed by Sanger or whole-plasmid sequencing.
3. Determining antibiotic doses for persister assays
NOTE: To select a dose of a given antibiotic with which to treat the bacterial population for persister experiments, first measure the minimum inhibitory concentration (MIC) of the antibiotic against the bacterial strain of interest. This can be achieved using either the broth microdilution method—an approach that the Clinical and Laboratory Standards Institute (CLSI) endorses-or the Epsilometer test (E-test), which is done using test strips with a range of antibiotic doses27. Once the MIC is determined, choose at least five concentrations of the antibiotic that range from 1- to 100-fold MIC for cell treatment.
- Inoculate bacteria from frozen stocks stored at -80 °C in 25% glycerol into 2 mL of cation-adjusted MHB (CA-MHB) or another nutrient-rich media. Grow the cells for approximately 4 h at 37 °C with shaking at 250 rpm before transferring 125 µL of the culture to 25 mL of fresh, chemically defined media in a 250 mL baffled Erlenmeyer flask. Grow the bacteria for 16 h (to stationary phase) at 37 °C, shaking at 250 rpm.
NOTE: Basal Salt Media (BSM) with succinate as the sole carbon source is typically used for P. aeruginosa experiments and rich chemically defined media is typically used for S. aureus experiments28,29,30,31. - The next morning, prepare 100x antibiotic stocks (in respective solvents) for the desired range of supra-MIC concentrations. Add 10 µL of each dilution to individual test tubes.
- Measure the OD600 of the overnight culture to confirm stationary-phase turbidity. Serially dilute 10 µL of culture and plate the dilutions onto nutritive agar plates—such as LB agar, CA-MHB agar, or TSA—to determine the colony forming units (CFUs) prior to antibiotic treatment.
- For antibiotic treatment, dispense 1 mL aliquots of the culture into the test tubes containing 10 µL of 100x antibiotic concentrations. Incubate the samples at 37 °C, shaking at 250 rpm, for a duration that is sufficient to kill non-persisters in the population, leaving persisters as the only colony-forming cells.
NOTE: The duration of treatment can vary depending on the experiment and the bacterial strain being tested. Typically S. aureus is treated for 5 h or 7 h and P. aeruginosa for 7 h or 24 h. In general, any timepoint in the second phase of the time-dependent survival assay can be used because the cells remaining in the second phase are expected to be persisters. - After antibiotic treatment, transfer 100 µL of cells from the test tubes to microcentrifuge tubes containing 900 µL of sterile phosphate buffered saline (PBS). Pellet the cells by centrifugation at RT at 21,000 x g for 3 min. Remove 900 µL of supernatant and resuspend the pellet in 900 µL of sterile PBS. Repeat the wash step at least once more to reduce residual antibiotics to sub-MIC levels.
- Serially dilute the culture 10-fold (six times) and plate 10 µL of each dilution onto nutritive agar plates. Incubate the plates at 37 °C overnight.
NOTE: Use untreated, round-bottom 96-well plates for serial dilution and plate cells on square agar plates using a multi-channel pipette. - The next day, count the colonies at each antibiotic concentration. Plot survival fraction (CFU at the end of treatment/CFU prior to treatment) against concentration on a log-linear scale. To choose a drug concentration for future persister assays, select a concentration in the second phase of the biphasic curve (Figure 3).
4. Imaging cells during antibiotic treatment or recovery
- Prepare agarose pads and cell samples for time-lapse imaging
NOTE: The following sample preparation protocol was developed as a user-friendly, cost-effective alternative to traditional agarose "sandwich" methods14,16. The use of an interchangeable coverslip dish avoids the need for messy grease or nail polish to seal the sample, which could further limit sample aeration. The agarose is set into the interchangeable coverslip dish with the coverslip already in place, creating reliably planar agarose surfaces compared to free-hand agarose pad preparations. Overall, this method has allowed for imaging samples with improved focus across the field of view and for longer durations due to stable humidification. The method described here is used to visualize bacteria during antibiotic treatment (Figure 4, Supplementary Video 3, and Supplementary Video 4). To visualize persisters as they resuscitate and reawaken after antibiotic treatment (Figure 5, Supplementary Video 5, and Supplementary Video 6), prepare the agarose pads with fresh culture media instead of spent media and do not add antibiotics to the pads (except for those added for plasmid maintenance/antibiotic selection).- Place a sterile 30 mm coverslip (#1.5 thickness) into the bottom of the stainless-steel base of an interchangeable coverslip dish ("chamber"). Gently thread the polycarbonate insert into the base so that the 30 mm coverslip forms the base of the chamber, and seal it in place by compressing the attached silicone O-ring. Repeat this step to prepare a duplicate chamber.
NOTE: It is recommended that duplicates be prepared for each experiment in case the preparation of one of the chambers is suboptimal. A custom 3D-printed divider is placed against the 30 mm coverslip to prevent motile cells like P. aeruginosa from cross-contaminating and to provide landmarks for sample locations. The STL file for 3D printing is available in Supplementary File 1. - Prepare 1.5% agarose in a 50 mL conical tube using the media of choice. Swirl gently to mix.
NOTE: For imaging stationary-phase cells during treatment, cell-free spent media from a stationary-phase overnight culture is used as the base media. Typically, agarose media is prepared as 0.105 g of agarose in 7 mL of media for preparing two chambers; each chamber requires 2 mL of agarose media, and the excess is helpful for avoiding air bubbles when pipetting. - Place the 50 mL conical into a glass beaker or microwave-safe holder (ensure that the cap is loose). Microwave on high, stopping every 3-4 s to swirl and mix. Pause and mix often to prevent the agarose mixture from bubbling over.
- After ~1 min total heating time, check to see if there is any visible agarose that has not melted left in the mixture. If the mixture is uniformly clear, then allow the agarose media to cool to ~60 °C briefly before adding any additional drugs or dyes. Swirl gently to mix and avoid the formation of air bubbles.
NOTE: Propidium iodide (16 µM for P. aeruginosa or 1.6 µM for S. aureus) can be added to visualize when cells lose viability.
- After ~1 min total heating time, check to see if there is any visible agarose that has not melted left in the mixture. If the mixture is uniformly clear, then allow the agarose media to cool to ~60 °C briefly before adding any additional drugs or dyes. Swirl gently to mix and avoid the formation of air bubbles.
- Moving quickly to prevent the agarose media from solidifying, pipette 2 mL of the agarose media into the chamber with the 30 mm coverslip. Gently lay a sterile 25 mm coverslip (#1.5 thickness) over the agarose media in the top chamber opening; this helps to prevent dehydration of the agarose pad and ensures a flat top surface of the agarose for optimal phase-contrast imaging. Allow the pad to solidify for 1-2 h.
- After the pad has solidified, prepare the cells to be imaged by diluting them to an appropriately sparse density in PBS for visualizing single cells. Here, the cells are diluted to OD600 0.01-0.05.
- On the 25 mm coverslip, use a fine-tip permanent marker to mark the locations/identities of each sample seeded on the pad. Invert the chamber so the stainless-steel base ring is facing upwards and carefully hold the polycarbonate insert underneath while unthreading the base. Place the stainless-steel base to the side. Carefully slide the 30 mm coverslip off of the pad and discard it.
NOTE: Remove the 30 mm coverslip by sliding horizontally, and be careful not to indent the agarose surface. Also, avoid working over the exposed agarose surface: any dust that falls onto it will affect image quality and can potentially contaminate the pad. - Using the marks on the 25 mm coverslip for guidance, spot 5 µL of the diluted cells to the respective locations on the agarose pad. Add three 5 µL spots (adjust this as needed, e.g., 4 x 4 µL spots, etc.). Once the spots have dried in completely, lightly place a new, sterile 30 mm coverslip centered over the pad.
- Hold the polycarbonate insert with one hand, and with the other, slowly re-thread the stainless-steel base back on over the new coverslip. Threading until just finger-tight is sufficient to compress the silicone O-ring and seal the chamber.
NOTE: Be careful not to over-tighten - if the 30 mm coverslip against the sample surface is compressed by the stainless-steel base and repeatedly twisted, the cells can spread out in a radial pattern, potentially causing sample cross-contamination. - Once the chamber is sealed, observe whether the agarose is contacting the surface of the 30 mm coverslip; at this point, there is usually some, but not complete, surface contact. Use the blunt end of a pair of tweezers or a similar instrument to gently press against the 25 mm coverslip until the agarose is touching the 30 mm coverslip evenly across the entire surface.
CAUTION: This step could result in the 25 mm coverslip breaking if excess force is used. - Once the agarose is well-pressed against the 30 mm coverslip so that no large air bubbles remain, the pad is ready to be imaged.
- Place a sterile 30 mm coverslip (#1.5 thickness) into the bottom of the stainless-steel base of an interchangeable coverslip dish ("chamber"). Gently thread the polycarbonate insert into the base so that the 30 mm coverslip forms the base of the chamber, and seal it in place by compressing the attached silicone O-ring. Repeat this step to prepare a duplicate chamber.
- Set up the microscope and image.
- Prepare the microscope and imaging chamber environmental controls. Set the stage-top incubator and the large chamber incubator temperatures to 37 °C and turn on the chamber humidifier. Place one of the agarose pad preparations into the stage-top incubator and close the incubation chamber to allow the sample to equilibrate. The stage-top incubator humidifying lid is left open at this point to avoid condensation on the 25 mm coverslip of the chamber.
NOTE: Pad shrinkage/expansion due to temperature changes can cause a drift between time points that go beyond the autofocus algorithm's scanning range. It is crucial to equilibrate the agarose pad to a stable temperature before imaging, which typically takes at least 15 min. Sufficient warming also prevents condensation onto the top coverslip when the humidifying lid is put in place. The hardware components of the imaging system were (Table of Materials): live cell incubation chamber, inverted microscope with a Plan-Apochromat 63x/1.40 Oil Ph3 M27 objective, Spectra 7 LED light engine, and sCMOS camera (6.5 μm pixel size). Control of the motorized components of the microscope and image acquisition is done using a microscopy analysis software application. - Prepare the software for image acquisition. Set MetaMorph's (microscopy analysis software) built-in autofocus algorithm to use the phase channel during multidimensional acquisition.
- In the Stage tab, set multiple stage positions for each sample, aiming for fields of view where cell density is uniformly distributed. In the Timelapse tab, set the desired duration and frequency (time interval) of images to be taken. In the Wavelengths tabs, set the desired channels for acquisition and adjust the exposure times for the samples' signal intensities.
NOTE: Images of each position are taken every 10 min for up to 24 h. For fluorescence imaging of the dyes/fluorophores mentioned in this article, the following light engine excitation settings were used: propidium iodide (Cy3; 555/15 nm) and GFP (GFP/FITC; 470/24 nm). The typical fluorescence excitation exposure time that is used is 100 ms. Filter set 15 (Beamsplitter FT580, Emission LP590) for propidium iodide and filter set 44 (Beamsplitter FT500, Emission BP 530/50) for GFP are used.
- In the Stage tab, set multiple stage positions for each sample, aiming for fields of view where cell density is uniformly distributed. In the Timelapse tab, set the desired duration and frequency (time interval) of images to be taken. In the Wavelengths tabs, set the desired channels for acquisition and adjust the exposure times for the samples' signal intensities.
- After the agarose pad has warmed up in the chamber, add the humidifying lid to the stage-top incubator. This will help prevent the pad from dehydrating and shifting during imaging.
- With the humidifying lid on, change from phase to differential interference contrast (DIC) and adjust the microscope's condenser and aperture diaphragm for proper Köhler illumination.
- After adjusting, switch back to phase. Navigate to each stage position, adjust the focus, and reset the stage position to the new focal plane. The settings are now in place to begin imaging.
NOTE: It is important to revisit each stage position before beginning acquisition to ensure that the pad has not shifted. If the cells are out of focus when revisited at a given stage position, re-focus on them and override the previous stage position. The auto-focus algorithm setting uses the focal z-position from the last timepoint ± 3 µm as a search range, so if the pad shifts more than 3 µm away, then the algorithm will fail to focus properly. - Start the multidimensional acquisition by clicking the Acquire button.
- After the experiment is complete, compile the individual images from each channel into a stack for viewing as a video or for other analysis. Do this using either MetaMorph or ImageJ.
- To compile images in MetaMorph (preferred), in the Review Multi Dimensional Data app, select the channels/wavelengths of interest and select all time points for a given stage position. Click Load Images. Windows will appear for each channel/wavelength. Save each compilation with its respective channel name as a .tiff file.
- To compile in ImageJ, open the files for all time points for one stage position and one channel. Compile using Images to Stack.
- Prepare the microscope and imaging chamber environmental controls. Set the stage-top incubator and the large chamber incubator temperatures to 37 °C and turn on the chamber humidifier. Place one of the agarose pad preparations into the stage-top incubator and close the incubation chamber to allow the sample to equilibrate. The stage-top incubator humidifying lid is left open at this point to avoid condensation on the 25 mm coverslip of the chamber.
5. Creating time-lapse videos using Fiji/ImageJ
NOTE: Fiji (Fiji is just ImageJ) is a freely available software for image processing and analysis that can be downloaded here: "https://imagej.net/software/fiji/downloads32"32. Fiji/ImageJ2 1.54f was used for the image processing methods described below.
- Shade-correct the phase channel image stack using BaSiC33. Open the desired phase image stack in Fiji, and then select BaSiC from the Plugins tab. The shade-corrected stack will appear in a separate window titled Corrected:ImageName.
NOTE: BaSiC.jar can be downloaded here: "https://github.com/marrlab/BaSiC33"33. Follow the developer's instructions for correctly installing BaSiC into Fiji. - Merge the shade-corrected phase channel stack with any other channels/wavelengths using Image > Color > Merge Channels. Adjust the background and signal intensities with Image > Adjust > Brightness/Contrast for each channel. Save the merged file as a .tiff.
- Then, stabilize the images using Correct 3D Drift. With the shade-corrected stack selected, go to Plugins > Registrations > Correct 3D Drift. In the dialog window that opens, set the channel for registration to the channel number corresponding to the phase stack. The resultant stack after correction will be titled registered time points. Crop to the desired field of view, then save the corrected file as a .tiff.
NOTE: If MetaMorph was used to create the compiled image stack, then there is an extra processing step: go to Image > Properties and swap the numbers in the Slices (z) and Frames (t) fields. The drift correction can now properly interpret each frame as a timepoint and not a slice of a z-stack. The shade-corrected and drift-corrected .tiff file can be used in subsequent image analyses. There are many software packages available to measure fluorescent signal intensities, quantify morphological characteristics, track the fates of individual cells, and more. Two commonly used programs are the MicrobeJ plug-in for Fiji and Oufti34,35. - Add time stamps and text labels onto the stack using Image > Stacks > Label.
- To add a scale bar, first, know the camera's pixel size and the microscope objective magnification. Calculate the pixel:micron ratio as pixel size divided by magnification. In the Analyze > Set Scale dialog box, input the pixel:micron ratio in the known distance field. Then, add a scale bar to the stack with Analyze > Tools > Scale Bar.
NOTE: The precise scale of a microscope should be calibrated using a stage micrometer. However, the microscope objective lens and camera used can provide a rough estimate of the scale. For example, the PCO sCMOS camera used here has a pixel size of 6.5 x 6.5 µm2, and the 63x objective was used for imaging, so the pixel size divided by magnification is 6.5/63 = 0.1032 µm per pixel. Input 0.1032 in the known distance field for the Set Scale dialog box. - To export the finished image stack as a video that can be played in QuickTime Player, Microsoft PowerPoint, etc., save as a .avi file.
Results
Successful introduction of reporter plasmids into P. aeruginosa and S. aureus is indicated by growth on the correct selective antibiotics and can be confirmed by colony PCR and/or sequencing. The modified strains should be verified as phenotypic reporters by subjecting them to conditions in which the gene of interest is known to be induced, and the resultant fluorescence can be measured by flow cytometry, spectrophotometry, or epifluorescence microscopy (Figure 1).
To facilitate the selection of an antibiotic dose(s) that will be used for subsequent experiments, perform concentration-dependent antibiotic persister assays for the P. aeruginosa or S. aureus strains of interest. Concentration-dependent assays typically result in a biphasic curve with a steep initial slope at lower antibiotic concentrations and a plateau or less steep slope at higher concentrations. However, for some antibiotic-species pairs, a distinct biphasic curve may not result. For example, the curve for S. aureus delafloxacin curve is clearly biphasic (Figure 3A), but the P. aeruginosa levofloxacin curve is not (Figure 3B)15. In this scenario, we would choose a concentration that is at least 10x the MIC (e.g., 5 µg/mL, which is about 15x the MIC for P. aeruginosa)15. However, because 15x levofloxacin MIC results in only ~0.001% P. aeruginosa survivors, we use 1 µg/mL levofloxacin treatment if we want to see persisters when imaging cells as they recover on antibiotic-free agarose pads (Supplementary Video 6); otherwise, the number of fields of view needed to image multiple persisters becomes prohibitive.
At the start of imaging, the ideal sample and agarose pad preparation should appear planar throughout the field of view, free of large debris, wrinkles, or air bubbles, and with evenly distributed single cells. Obtaining well-distributed single cells may require optimization of the sample dilution or resuspension. For S. aureus, cells tend to form small clusters and need to be vortexed thoroughly before seeding to the agarose pad (Figure 4 and Figure 5). For P. aeruginosa, cells may form aggregates encased in a sticky extracellular matrix in suspension; it is necessary to pipette these samples thoroughly and disrupt the aggregates for imaging single cells.
After an imaging experiment's conclusion, a successful time-lapse of images will appear in focus, stably illuminated, and with minimal drift in the x-y plane throughout the experiment. Supplementary Video 7 represents an optimal image acquisition: t is the phase channel of Supplementary Video 4 before shade or drift correction. Loss of focus can occur if condensation (from over-humidification or insufficient sample warming) causes water droplets to form on the top 25 mm coverslip, distorting the light and pushing the focal plane outside of the autofocus algorithm's maximal search range (Supplementary Video 8). Variation in illumination usually indicates insufficient immersion oil at the time of imaging. If the stage moves too quickly, the oil on the objective may drag behind and still be catching up when the images are acquired. This can be mitigated by adjusting the acquisition controls to slow the speed of movement or adding a pause between the movement to the next position and the image acquisition. Major sample drift will look like many cells streaking across the field of view while some stay in place (Supplementary Video 9). This typically occurs later in experiments because the agarose pad has dehydrated due to insufficient humidity control. The agarose pad preparation presented in this paper was designed to facilitate sample stability, but properly warming/humidifying the sample and its surrounding environment is necessary for optimal image acquisition.

Figure 1: Fluorescent reporter strains illuminate the expression of a gene of interest. (A) S. aureus was transduced with a GFP transcriptional reporter for a gene of interest per Protocol 1. The reporter strain was treated for 24 h with antibiotic, washed with PBS, and then seeded onto an agarose pad made from CA-MHB plus propidium iodide (1.6 µM) and chloramphenicol (10 µg/mL for reporter plasmid maintenance) for imaging during recovery (Supplementary Video 1). (B) P. aeruginosa was transformed with a plasmid bearing a mScarlet-linked translational reporter for a protein of interest26. The reporter strain was treated for 5 h with antibiotic, washed with PBS, and then seeded onto an agarose pad made from BSM plus Tet (75 µg/mL; for reporter plasmid maintenance) for imaging during recovery (Supplementary Video 2). Please click here to view a larger version of this figure.
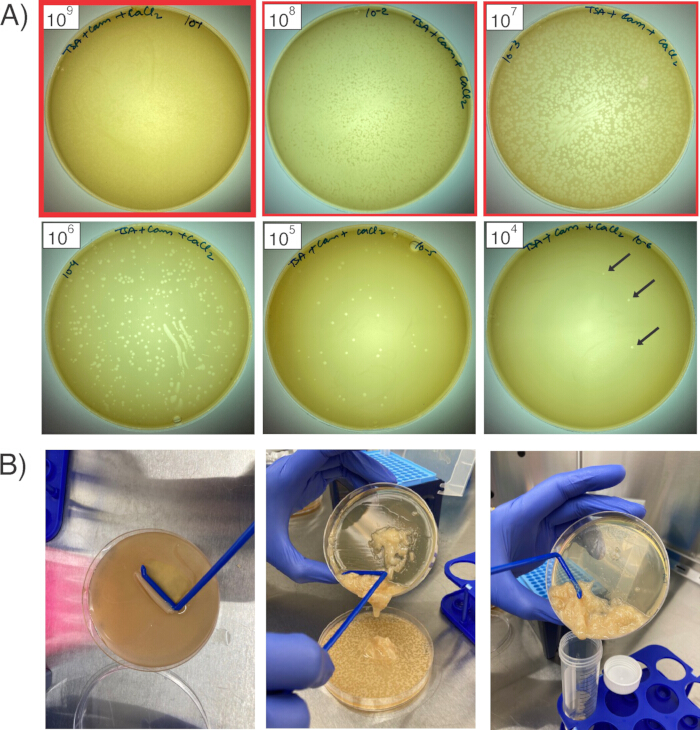
Figure 2: Propagating and harvesting bacteriophage. (A) The six plates show six different amounts of diluted phage stock on the lawns of S. aureus RN4220. The red outlines indicate the three plates that would be harvested, from the plate with the most clearing (bold red outline; 1 x10⁹ PFU/mL) to the next two dilutions (1 x10⁸ and 1 x 10⁷ PFU/mL). The black arrows point to individual plaques. (B) To harvest phage from the plates, scrape the soft agar layer (left), transfer the slurry to the next dilution plate (center), and, after pooling the soft agar from all three plates together, combine into a conical tube for centrifugation (right). Please click here to view a larger version of this figure.
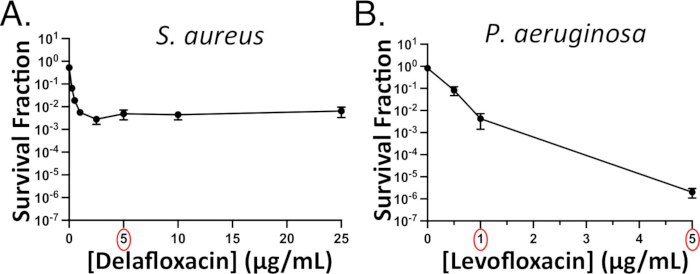
Figure 3: Representative concentration-dependent persister assays. Concentration-dependent fluoroquinolone persistence was assessed in stationary-phase (A) S. aureus (against delafloxacin) and (B) P. aeruginosa (against levofloxacin). Subsequent experiments utilize 5 µg/mL delafloxacin (red circle) because S. aureus killing had plateaued at this concentration. A dosage of at least 1 µg/mL levofloxacin (red circle) would be utilized for subsequent experiments with P. aeruginosa. Note that the bacterial killing does not plateau for P. aeruginosa, but there is still a less steep "second phase" of the biphasic curve that indicates a persistent subpopulation. Panel 3B has been adapted with permission from Hare et al.15. Please click here to view a larger version of this figure.

Figure 4: Imaging bacterial phenotypes during antibiotic treatment. Stationary-phase (A) S. aureus and (B) P. aeruginosa cells were seeded onto agarose pads containing fluoroquinolone antibiotics and monitored during treatment: 5 µg/mL delafloxacin for S. aureus (Supplementary Video 3) and 5 µg/mL levofloxacin for P. aeruginosa (Supplementary Video 4)15. Propidium iodide (PI; 16 µM for P. aeruginosa, 1.6 µM for S. aureus) was added to the pads to mark dead or dying cells. S. aureus cells remain largely intact and alive in the presence of the FQ, whereas most P. aeruginosa cells undergo drastic morphological changes, including forming round spheroplasts, before they lyse and die. Please click here to view a larger version of this figure.

Figure 5: Tracking persisters during recovery. (A) S. aureus and (B) P. aeruginosa populations were seeded onto agarose pads containing fresh media after they had been treated with fluoroquinolones (5 µg/mL delafloxacin for S. aureus and 1 µg/mL levofloxacin for P. aeruginosa) and monitored during their post-treatment recovery (Supplementary Video 5 and Supplementary Video 6). The perisisters seen are indicated with green arrows in the first two frames in each panel, and they remained intact and viable during antibiotic treatment. After an initial lag period, the persisters started to divide and gave rise to new progeny (indicated with green circles). Please click here to view a larger version of this figure.
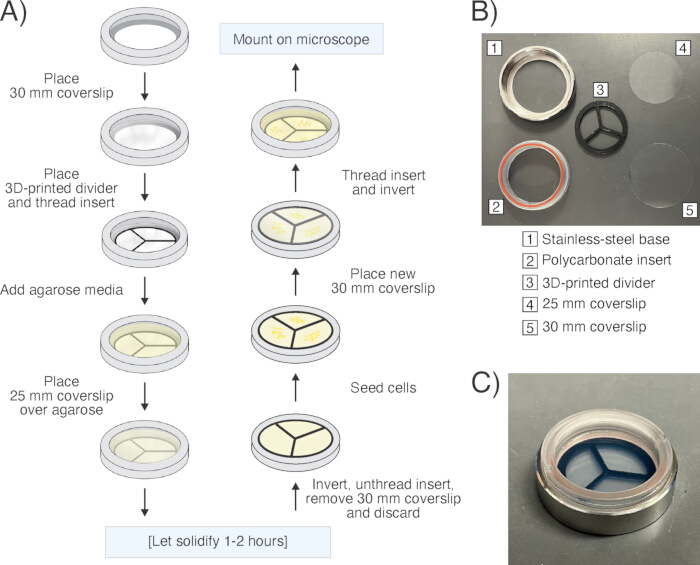
Figure 6: Microscope sample preparation. (A) Schematic of the sample preparation workflow using an interchangeable coverslip dish ("chamber"). (B) Picture of the disassembled chamber and its individual components. (C) Picture of the fully assembled chamber. Please click here to view a larger version of this figure.
Supplementary Video 1: S. aureus persister. Video file containing the images in Figure 1A. In brief, S. aureus bearing a GFP transcriptional reporter for a gene of interest was treated for 24 h with antibiotic, washed with PBS, then seeded onto an agarose pad made with CA-MHB plus propidium iodide (1.6 µM) and chloramphenicol (10 µg/mL) for imaging during recovery. Please click here to download this video.
Supplementary Video 2: P. aeruginosa persister. Video file containing images in Figure 1B. In brief, P. aeruginosa bearing an mScarlet-linked translational reporter for a protein of interest was treated for 5 h with antibiotic, washed with PBS, then seeded onto an agarose pad made with BSM plus Tet (75 µg/mL) for imaging during recovery26. Please click here to download this video.
Supplementary Video 3: S. aureus during antibiotic treatment. A stationary-phase culture of S. aureus grown in rich chemically defined media was seeded to agarose pads made from the culture's cell-free conditioned media with propidium iodide (1.6 μM) and delafloxacin (5 μg/mL). Please click here to download this video.
Supplementary Video 4: P. aeruginosa during antibiotic treatment. A stationary-phase culture of P. aeruginosa grown in BSM was seeded to agarose pads made from cell-free conditioned media from a culture of P. aeruginosa grown in BSM in parallel; the agarose pad also contained propidium iodide (16 µM) and levofloxacin (5 µg/mL). This video has been adapted with permission from Hare et al.15. Please click here to download this video.
Supplementary Video 5: S. aureus during post-antibiotic recovery. S. aureus was grown to stationary phase in rich chemically defined media. The stationary-phase cultures were treated with 5 µg/mL delafloxacin in test tubes for 24 h, washed with PBS, and then seeded to antibiotic-free CA-MHB agarose pads containing propidium iodide (1.6 µM) for imaging. Please click here to download this video.
Supplementary Video 6: P. aeruginosa during post-antibiotic recovery. A stationary-phase culture of P. aeruginosa grown in BSM was treated with 1 µg/mL levofloxacin in test tubes for 7 h, washed with PBS, then seeded to antibiotic-free BSM agarose pads containing propidium iodide (16 µM) for imaging. Please click here to download this video.
Supplementary Video 7: Example of optimal image acquisition. This video is the phase channel of Supplementary Video 4 before image processing as an example of an optimal time-lapse acquisition. Note the minimal drift, stable illumination, and maintenance of focus throughout the experiment. Please click here to download this video.
Supplementary Video 8: Example of suboptimal image acquisition due to condensation. This video shows part of an experiment when the image acquisition was affected by poor focus, likely due to condensation on the chamber due to improper heating of the sample and/or over-humidification of the imaging environment. The sample being imaged was levofloxacin-treated P. aeruginosa during post-antibiotic recovery on a BSM agarose pad. Please click here to download this video.
Supplementary Video 9: Example of suboptimal image acquisition due to drift. This video shows part of an experiment when the image acquisition was affected by sample drift, likely due to dehydration and the shrinking/lifting of the agarose pad from the coverslip. The sample being imaged was P. aeruginosa on an agarose pad containing levofloxacin and propidium iodide. Please click here to download this video.
Supplementary File 1: 25mm-3D-divider-for-35mmBioptechs.stl Please click here to download this file.
Discussion
We have found that the success of a time-lapse microscopy experiment hinges on the quality of the agarose pads and their stability throughout the course of imaging. The stainless-steel chamber-enclosed agarose pads are relatively easy to prepare, resulting in consistently planar samples that can be stably imaged over dozens of hours. This enables the imaging of tens of thousands of cells in a single experiment and increases the likelihood of detecting rare phenotypic variants, like persister cells, in a population.
This agarose pad preparation method presents an easily implementable alternative to previously published methods. Our protocol does not require the technical precision of microfluidic device fabrication or the dexterous manipulations of agarose "sandwich" methods, making it easier to achieve consistent preparations from run to run14,16,36. Furthermore, the system is cost-effective. The stainless-steel chamber is sterilizable and reusable (unlike single-use plastic chambers) and the setup does not require specialized equipment16,37. The chamber is easily fit to different microscopy systems using commercially available stage inserts. Additionally, because bacteria are immobilized at the agarose-cover glass interface, we have had success with tracking highly motile bacteria such as P. aeruginosa while still allowing for morphological changes (Figure 4, Supplementary Video 4). Other single-cell imaging techniques, such as the "mother machine", confine cells to channels that preclude observation of morphological changes other than filamentation36.
For success with this protocol, there are some critical steps and parameters to keep in mind. For pad preparation, it is important to thoroughly heat and melt the agarose, as any remaining agarose crystals will cause light diffraction and affect image quality. Similarly, one must take care to pipette the agarose into the chamber without introducing air bubbles. To ensure that the thickness of the agarose pads remains consistent and to limit sample drift, it is important to allow the pad to equilibrate—typically for 15 min—in the humidified, temperature-controlled enclosure before imaging begins. Another factor that can cause poor image quality is humidity control: low humidity will result in the agarose pad dehydrating and shrinking, whereas high humidity (or improper sample warming in the chamber) could cause the warm air to condense on the sample and distort the imaging. An example of suboptimal time-lapse imaging due to condensation can be found Supplementary Video 8.
A limitation of the current set-up is that the culture media cannot be exchanged, which prevents continuous tracking of individual bacteria before, during, and after antibiotic treatment. We anticipate that coupling the agarose pad with flow cells or microfluidic devices that permit culture media exchange could enable populations to be tracked during nutritional or environmental change. Another parameter of the current design that could be improved is sample aeration. The O-ring seal, screw-top design of the interchangeable coverslip dish enables better sample aeration compared with set-ups that require the use of wax or grease-based sealant to seal the pads16. However, aeration in the sealed chamber may still be limited and may not support the growth of obligate aerobes, though this remains to be tested.
The time-lapse imaging sample preparation protocol that we present in this article enables thousands of bacteria to be tracked as they respond to or recover from antibiotic treatment. This method is also highly generalizable and has a variety of potential applications beyond persister biology. For example, the agarose pad and divider set-up allows for the seeding of spatially separated cell samples yet permits cell-cell communication via diffusion through the agarose pad. We are currently exploring this set-up's potential for testing how the exchange of secreted products affects cell growth in multispecies communities. We anticipate that this protocol will provide a low barrier of entry to time-lapse microscopy for the new investigator and limitless variations for the seasoned microbiologist to explore.
Disclosures
The authors have no conflicts of interest to declare.
Acknowledgements
We thank Ms. Susan Staurovsky at the UConn Health Center for Cell Analysis and Modeling Microscopy Facility for her assistance with microscopy experiments. We thank Dr. Mona Wu Orr and the Essentials of Staphylococcal Genetics and Metabolism Workshop for their protocols and advice on cloning in P. aeruginosa and S. aureus, respectively. This work was supported by funding from the National Institutes of Health (NIH; DP2GM146456-01 and 1R01AI167886-01A1 to W.W.K.M., 1F30DE032598-01A1 to P.J.H., and 1F31DK136259-01A1 to T.J.L.). The funders had no role in the design of our experiments or preparation of this manuscript.
Materials
| Name | Company | Catalog Number | Comments |
|---|---|---|---|
| BaSiC | GitHub | https://github.com/marrlab/BaSiC | |
| Certified Molecular Biology Agarose | Biorad | 1613101 | |
| Fiji-ImageJ | NIH | https://imagej.net/software/fiji/downloads | |
| Interchangeable Coverglass Dish | Bioptechs | 190310-35 | 35 mm ICD for preparing agarose pads; comes with 30 mm (#1.5) coverslips |
| Lumencor Spectra 7 LED light engine | Lumencor | https://lumencor.com/products/spectra-light-engine | Spectra 7 LED light engine |
| MetaMorph | Molecular Devices | Premier version 7.10.5 | |
| pco.edge 4.2 bi sCMOS camera | Excelitas | https://www.excelitas.com/product/pcoedge-42-bi-usb-scmos-camera | sCMOS camera |
| PeCon live cell incubation chamber | peCon | https://www.pecon.biz/ | |
| Thomas Scientific Round cover glass, #1.5 thickness, 25 mm, 100 pack | Fisher Scientific | NC1272770 | 25 mm (#1.5) coverslips |
| Zeiss Axiovert 200M microscope | Zeiss | https://www.zeiss.com/microscopy/en/products/light-microscopes/widefield-microscopes/axiovert-for-materials.html | Inverted microscope with Plan-Apochromat 63x/1.40 Oil Ph3 M27 objective, Lumencor Spectra 7 LED light engine, and pco.edge 4.2 bi sCMOS camera (6.5 mm pixel size) |
References
- Brauner, A., Fridman, O., Gefen, O., Balaban, N. Q. Distinguishing between resistance, tolerance and persistence to antibiotic treatment. Nat Rev Microbiol. 14, 320-330 (2016).
- Balaban, N. Q., et al. Definitions and guidelines for research on antibiotic persistence. Nat Rev Microbiol. 17 (7), 441-448 (2019).
- Conlon, B. P. Staphylococcus aureus chronic and relapsing infections: evidence of a role for persister cells. Bioessays. 36 (10), 991-996 (2014).
- Mulcahy, L. R., Burns, J. L., Lory, S., Lewis, K. Emergence of Pseudomonas aeruginosa strains producing high levels of persister cells in patients with cystic fibrosis. J Bacteriol. 192 (23), 6191-6199 (2010).
- Verstraete, L., Van den Bergh, B., Verstraeten, N., Michiels, J. Ecology and evolution of antibiotic persistence. Trends Microbiol. 30 (5), 466-479 (2021).
- Sett, A., Dubey, V., Bhowmik, S., Pathania, R. Decoding bacterial persistence: Mechanisms and strategies for effective eradication. ACS Infect Dis. 10 (8), 2525-2539 (2024).
- Mempin, R., et al. Release of extracellular ATP by bacteria during growth. BMC Microbiol. 13, 301(2013).
- Lewis, K. Persister cells, dormancy and infectious disease. Nat Rev Microbiol. 5 (1), 48-56 (2006).
- Fauvart, M., De Groote, V. N., Michiels, J. Role of persister cells in chronic infections: clinical relevance and perspectives on anti-persister therapies. J Med Microbiol. 60 (pt 6), 699-709 (2011).
- Van den Bergh, B., Fauvart, M., Michiels, J. Formation, physiology, ecology, evolution and clinical importance of bacterial persisters. FEMS Microbiol Rev. 41, 219-251 (2017).
- Levin, B. R., Rozen, D. E. Non-inherited antibiotic resistance. Nat Rev Microbiol. 4 (7), 556-562 (2006).
- Davis, K. M., Isberg, R. R. Defining heterogeneity within bacterial populations via single cell approaches. Bioessays. 38 (8), 782-790 (2016).
- Hare, P. J., LaGree, T. J., Byrd, B. A., DeMarco, A. M., Mok, W. W. K. Single-cell technologies to study phenotypic heterogeneity and bacterial persisters. Microorganisms. 9 (11), 2277(2021).
- de Jong, I. G., Beilharz, K., Kuipers, O. P., Veening, J. W. Live cell imaging of Bacillus subtilis and Streptococcus pneumoniae using automated time-lapse microscopy. J Vis Exp. 53, e3145(2011).
- Hare, P. J., Gonzalez, J. R., Quelle, R. M., Wu, Y. I., Mok, W. W. K. Metabolic and transcriptional activities underlie stationary-phase Pseudomonas aeruginosa sensitivity to levofloxacin. Microbiol Spectr. 12 (1), e0356723(2024).
- Young, J. W., et al. Measuring single-cell gene expression dynamics in bacteria using fluorescence time-lapse microscopy. Nat Protoc. 7 (1), 80-88 (2011).
- Pang, Y. Y., et al. agr-Dependent interactions of Staphylococcus aureus USA300 with human polymorphonuclear neutrophils. J Innate Immun. 2 (6), 546-559 (2010).
- Bose, J. L., Fey, P. D., Bayles, K. W. Genetic tools to enhance the study of gene function and regulation in Staphylococcus aureus. Appl Environ Microbiol. 79 (7), 2218(2013).
- Schenk, S., Laddaga, R. A. Improved method for electroporation of Staphylococcus aureus. FEMS Microbiol Lett. 73, 133-138 (1992).
- Grosser, M. R., Richardson, A. R. Method for Preparation and Electroporation of S. aureus and S. epidermidis. The Genetic Manipulation of Staphylococci. Methods Molecular Biology. , Humana Press. New York, NY. (2016).
- Krausz, K. L., Bose, J. L. Bacteriophage Transduction in Staphylococcus aureus: Broth-Based Method. The Genetic Manipulation of Staphylococci. Methods Molecular Biology. , Humana Press. New York, NY. (2016).
- Olson, M. E. Bacteriophage Transduction in Staphylococcus aureus. The Genetic Manipulation of Staphylococci. Methods Molecular Biology. , Humana Press. New York, NY. (2016).
- Fey, P. D., et al. A genetic resource for rapid and comprehensive phenotype screening of nonessential Staphylococcus aureus genes. mBio. 4 (1), e00537-e00612 (2013).
- Coe, K. A., et al. Multi-strain Tn-Seq reveals common daptomycin resistance determinants in Staphylococcus aureus. PLoS Pathog. 15 (11), e1007862(2019).
- Figurski, D. H., Helinski, D. R. Replication of an origin-containing derivative of plasmid RK2 dependent on a plasmid function provided in trans. Proc Natl Acad Sci U S A. 76 (4), 1648(1979).
- Shee, C., et al. Engineered proteins detect spontaneous DNA breakage in human and bacterial cells. eLife. 2, e01222(2013).
- Kowalska-Krochmal, B., Dudek-Wicher, R. The minimum inhibitory concentration of antibiotics: methods, interpretation, clinical relevance. Pathogens. 10 (2), 165(2021).
- Robinson, J. L., Jaslove, J. M., Murawski, A. M., Fazen, C. H., Brynildsen, M. P. An integrated network analysis reveals that nitric oxide reductase prevents metabolic cycling of nitric oxide by Pseudomonas aeruginosa. Metab Eng. 41, 67-81 (2017).
- Wolff, J. A., MacGregor, C. H., Eisenberg, R. C., Phibbs, P. V. Isolation and characterization of catabolite repression control mutants of Pseudomonas aeruginosa PAO. J Bacteriol. 173 (15), 4700-4706 (1991).
- Batchelder, J. I., Taylor, A. J., Mok, W. W. K. Metabolites augment oxidative stress to sensitize antibiotic-tolerant Staphylococcus aureus to fluoroquinolones. mBio. , e0271424(2024).
- Power, A. D., Mok, W. W. K. Agar and agarose used for Staphylococcus aureus biofilm cultivation impact fluoroquinolone tolerance. J Appl Microbiol. 135 (8), lxae191(2024).
- Schindelin, J., et al. Fiji: an open-source platform for biological-image analysis. Nat Methods. 9 (7), 676-682 (2012).
- Peng, T., et al. A BaSiC tool for background and shading correction of optical microscopy images. Nat Commun. 8, 14836(2017).
- Ducret, A., Quardokus, E., Brun, Y. V. MicrobeJ, a tool for high throughput bacterial cell detection and quantitative analysis. Nat Microbiol. 1 (7), 16077(2016).
- Paintdakhi, A., et al. Oufti: an integrated software package for high-accuracy, high-throughput quantitative microscopy analysis. Mol Microbiol. 99 (4), 767-777 (2016).
- Wang, P., et al. Robust growth of Escherichia coli. Curr Biol. 20 (12), 1099-1103 (2010).
- Moffitt, J. R., Lee, J. B., Cluzel, P. The single-cell chemostat: an agarose-based, microfluidic device for high-throughput, single-cell studies of bacteria and bacterial communities. Lab Chip. 12 (8), 1487-1494 (2012).
Reprints and Permissions
