The zebrafish larval neuromuscular junction is an attractive model for studying synaptic physiology. It is amenable to many experimental techniques, including electrophysiology and optical imaging. Here, we describe a protocol for imaging synaptic transmission using a pHluorin-based probe under an upright epifluorescence microscope.
Method Article
Live Imaging of Synaptic Vesicle Recycling in the Neuromuscular Junction of Dissected Larval Zebrafish
In This Article
Summary
Abstract
Neuronal communication is mediated by synaptic transmission, which depends primarily on the release of neurotransmitters stored in synaptic vesicles (SVs) in response to an action potential (AP). Since SVs are recycled locally at the presynaptic terminal, coordination of SV exocytosis and endocytosis is important for sustained synaptic transmission. A pH-sensitive green fluorescent protein, called pHluorin, provides a powerful tool to monitor SV exo/endocytosis by targeting it to the SV lumen. However, tracking AP-driven SV recycling with the pHluorin-based probes is still largely limited to in vitro culture preparations because the introduction of genetically encoded probes and subsequent optical imaging is technically challenging in general for in vivo animal models or tissue preparations. Zebrafish is a model system offering valuable features, including ease of genetic manipulation, optical clarity, and rapid external development. We recently generated a transgenic zebrafish that highly expresses a pHluorin-labeled probe at motor neuron terminals and developed a protocol to monitor AP-driven SV exo/endocytosis at the neuromuscular junction (NMJ), a well-established synapse model that forms in vivo. In this article, we show how to prepare larval zebrafish NMJ preparation suitable for pHluorin imaging. We also show that the preparation allows time-lapse imaging under conventional upright epifluorescence microscope, providing a cost-effective platform for analyzing NMJ function.
Introduction
Synaptic transmission, mediated by neurotransmitter release from synaptic vesicles (SVs) at the presynaptic terminal, is a fundamental process underlying nerve function1. In early studies, synaptic transmission was measured primarily by electrophysiological techniques that detect the postsynaptic response elicited by neurotransmitters and their receptors. Over the past few decades, however, several types of imaging techniques have been developed that directly visualize presynaptic function2. One of the most widely used probes is a pH-sensitive green fluorescent protein called pHluorin3,4.
Recycling of synaptic vesicles (SVs) at the presynaptic terminal is a crucial process for the sustained transmission of neurotransmitters5. Following the release of neurotransmitters by exocytosis of SVs, whose lumen is generally maintained at acidic pH6,7, the membrane and SV proteins are immediately retrieved from the plasma membrane by endocytosis. Newly formed SVs are then reacidified, and neurotransmitters are reloaded. When pHluorin is targeted into the SV lumen by fusing it to the SV protein, it exhibits minimal fluorescence at the resting state. However, upon SV exocytosis, it is exposed to the neutral pH in the extracellular space, resulting in bright fluorescence. Subsequently, fluorescence gradually decreases following the SV reacidification. Therefore, pHluorin fluorescence enables the monitoring of SV recycling processes.
In pioneering studies, synaptobrevin/VAMP 2, the vesicular SNARE (soluble NSF-attachment protein receptor) protein responsible for synaptic vesicle fusion in forebrain synapses8 and the most abundant among SV proteins9, was selected as a fusion partner for pHluorin, and the resulting fusion protein was designated as synaptopHluorin (SpH)3,4. However, SpH exhibited a low signal-to-noise (S/N) ratio due to the substantial surface expression of the probe. Therefore, other SV proteins have been tested as carrier partners10,11,12. To date, vesicular transporters have been demonstrated to exhibit the lowest surface expression13,14,15. The use of these probes was initially established in cultured mammalian neurons to track AP-driven SV recycling8,9,10,11,12,13 and has been extended to other preparations, including dissected tissues and in vivo animals16,17,18,19,20,21,22.
Larval zebrafish is a model system with valuable characteristics, including ease of genetic manipulation, optical clarity, and rapid external development. Transgenic zebrafish expressing pHluorin fused to synaptophysin, called SypHy, was generated and applied to multiple experimental setups, e.g., monitoring spontaneous SV fusion of spinal neurons in vivo21, AP-independent SV recycling at ribbon-type synapses in vivo20,22 or in isolated cells23,24,25. However, the application of pHluorin imaging of AP-driven SV recycling in the zebrafish model is still limited.
The neuromuscular junction (NMJ) serves as an attractive model to study synaptic physiology26, and several studies successfully performed imaging AP-driven SV recycling with SpH in mouse18,19. The use of NMJs for SV recycling in zebrafish was pioneered by Wen et al.16. Recently, we generated Tg zebrafish that highly express pHluorin tagged with a vesicular GABA transporter (VGAT) specifically in motor neurons27. This probe also contains a HaloTag in tandem with pHluorin at the luminal tail of VGAT and is, therefore, named VpHalo. Although VGAT is not endogenously expressed in cholinergic motor neurons, we confirmed that VpHalo localizes to all of the SV pools and is properly recycled in response to APs by combining electrophysiological recording, activity-dependent SV labeling with HaloTag ligands, and live imaging of pHluorin27. Due to the high level of expression and a minimal surface fraction of VpHalo, NMJ preparation from this Tg fish enabled the monitoring of AP-driven SV recycling with a good S/N ratio. Moreover, the sparse distribution of NMJs in the transparent body renders confocal laser scanning microscopy unnecessary for this purpose. Although monitoring AP-driven SV recycling in intact zebrafish is the desirable future direction, it is of primary importance to establish the NMJ preparation that is suitable to validate the use of the pHluorin-based probe under well-controlled conditions, as was done in cultured preparations3,4,10,11,12,13,14,15. Here, we describe a dissection protocol to prepare a larval zebrafish NMJ sample that can be used for multiple types of experiments, e.g., patch clamp recording of endplate currents, HaloTag labeling of recycled SVs, and pHluorin live imaging, as discussed above. Furthermore, we focused on and provided a detailed protocol for the live imaging of pHluorin using this NMJ preparation under a conventional epifluorescent microscope equipped with an electrical stimulation device and a solution perfusion system.
Protocol
All animal procedures were conducted in accordance with the guidelines for the care and use of animals at Osaka Medical and Pharmaceutical University. Zebrafish were raised and maintained under a 14 h light to 10 h dark cycle. The embryos and larvae were maintained at 28-30 °C in egg water containing 0.006% sea salt and 0.01% methylene blue. The experiments were conducted at 4-7 days post-fertilization (dpf). It is recommended that the fish be fed twice a day from 5 dpf onwards when experiments are performed after 6 dpf. The medium must be changed prior to each feeding.
1. Preparation of solutions
- Prepare 200 mL of extracellular solution (112 mM NaCl, 2 mM KCl, 10 mM HEPES, 10 mM glucose, 2 mM CaCl2, 1 mM MgCl2, pH 7.3-7.4). Mix 6.4 mL of 3.5 M NaCl, 0.4 mL of 1 M KCl, 1 mL of 1 M HEPES (pH 7.5), 0.4 mL of 1 M CaCl2, 0.2 mL of 1 M MgCl2, and 360 mg of glucose, and add ultrapure water to 200 mL. If the pH is outside the 7.3-7.4 range, adjust it with 1 M NaOH. Use the freshly prepared extracellular solution for each experiment.
- Prepare 100 mL of extracellular solution containing 3 µM D-tubocurarine (D-TBC). Add 20 µL of 15 mM D-TBC stock solution to 100 mL of extracellular solution.
NOTE: D-TBC stock solution is prepared in water and stored at -20 °C.
CAUTION: Wear gloves and make preparations in the hood when handling D-TBC powder. Gloves are also recommended when handling the D-TBC solution. - Prepare 25 mL of extracellular solution containing 0.02% tricaine (MS-222). Add 0.5 mL of 1% tricaine stock solution to 25 mL of extracellular solution.
NOTE: Tricaine stock solution is prepared in water and stored at 4 °C. Tricaine is used only for dissection, not during imaging.
2. Preparation of bipolar electrode from theta glass capillary
- Pull theta glass capillaries using the micropipette puller so that the tip diameter is in the range of 3-10 µm (Figure 1A).
NOTE: We recommend a protocol with two or more steps to pull the capillary. - Connect the theta glass pipette (1.17 mm of inner diameter with 0.165 mm of septum thickness) to the Stimulus Isolator. Fill the pipette with the extracellular solution. Insert a thin platinum wire (0.1 mm diameter) into each opening of the theta glass capillary and connect the back end of the wire to the Stimulus Isolator (Figure 1B). Be careful not to short-circuit the two platinum wires.
3. Sample preparation
NOTE: This protocol has been optimized for use with Tg(hb9:tTAad, TRE:TagRFP-P2A-VpHalo) zebrafish larvae27, in which the following two proteins, linked by a P2A cleavage peptide, were bicistronically expressed specifically in motor neurons: a reporter red fluorescent protein TagRFP and a sensor protein VpHalo, which is a fusion protein of pHluorin and HaloTag to the luminal part of VGAT (Figure 2A). The hb9 promoter drives the expression of the tTAad (tetracycline-controlled transactivator-advanced), which in turn induces the expression of the genes under the tetracycline response element (TRE) composite promoter. The Tet-inducible expression system increases the level of protein expression. pHluorin allows live monitoring of activity-dependent SV recycling, whereas HaloTag visualizes SVs recycled during a given period by covalently labeling the fused protein (Figure 2A). Although both methods have unique advantages, in this article we focus on pHluorin imaging.
- Pour 25 mL of extracellular solution containing 0.02% tricane into the glass Petri dish.
- For dissection, transfer a larva to the Petri dish. Peel the skin of the larva with two fine forceps. Use the first forceps to hold the larva in place and pinch the skin on the dorsal side of the swim bladder with the other forceps (Figure 3A).
- Remove the swim bladder, internal organs, and the head with scalpels. The skin on both sides of the fish's body can often be removed simultaneously, see Video 1.
4. Placement of the sample in the imaging chamber and insertion of the stimulating electrode
NOTE: Because the resting luminal pH of the SV is below pH 6.0, pHluorin fluorescence at NMJs in living fish is barely observable (Figure 2B). However, when the SV lumen was alkalized, restricted localization of VpHalo to NMJs was observed (Figure 2C). Notably, the confocal z-stack image of the NMJs showed that they did not overlap each other in the xy plane, except for the edges of the body segments (Figure 2C). Based on this observation, we postulated that the epifluorescence microscope was applicable for live imaging of VpHalo in zebrafish larvae, which was validated as detailed in the following protocol.
- Transfer the sample to the imaging chamber (Figure 3B) using a glass Pasteur pipette with a fire-polished tip. Mechanically fix the sample with a nylon thread glued to a C-shaped platinum wire so that it is oriented at an angle approximately parallel to the stimulating electrode. (Figure 3C).
NOTE: A C-shaped platinum wire with a nylon thread was fabricated in the laboratory. Approximately 1 cm of 0.5 mm diameter platinum wire was formed into a C-shape and tapped with a hammer to flatten it. Nylon thread can be obtained from household items. We glued the nylon thread, which was obtained by disassembling a kitchen drainer available at a grocery store. A similar fixation device is routinely used in the brain slice experiment28. - Continuously perfuse the sample with an extracellular solution containing 3 µM D-TBC at a rate of approximately 1.0 mL/min using a gravity flow perfusion system.
NOTE: It is recommended that the chamber temperature be controlled by using an in-line solution heater. - Insert the stimulation electrode into the spinal cord. Hold the electrode prepared from the theta glass pipette in step 2 on the pipette holder equipped with the motorized micromanipulator. Insert the electrode into the sample so the tip is near the spinal motor neurons, which are located on the ventral side of the spinal cord and can be identified as TagRFP-positive neurons in this specimen (Figure 3D). Advance the electrode at an oblique angle from the adjacent segment to the target position.
NOTE: The boundary between body segments is dense and hard to penetrate, so it is necessary to press the electrode slowly. The position of the electrode tip is very important. If it is distant from the spinal cord, it stimulates the adjacent muscles directly, resulting in a large image drifting in the subsequent time-lapse imaging.
5. Image acquisition
- Select the imaging region. Based on the live image of TagRFP fluorescence, select an imaging region that includes more than a few boutons and excludes those at the body segment boundary (Figure 2C and Figure 4A). Choose the region within the same body segment of the stimulation electrode because motor neuron innervation is limited within a single body segment29,30. Switch the fluorescence filter unit for GFP/pHluorin fluorescence.
NOTE: In this experimental setup, pHluorin was imaged with 470/40 nm excitation and 510/20 nm emission filters. TagRFP was imaged with 555/20 nm excitation and 595/44 nm emission filters. Micro-Manager software is used to simultaneously control image acquisition with a scientific cMOS camera and the TTL shutter of the LED light source. To synchronize image acquisition and electrical stimulation, Arduino is used as a digital I/O device. Another option that does not require a script is to use Digidata and its software from Molecular Devices. - Determine the setting of image acquisition software and digital I/O device so that image acquisition and electrical stimulation are synchronized. Optimize the exposure and intensity of the light source to acquire a sufficiently bright image in a 1 Hz time-lapse mode without saturation and enter the exposure time in the Exposure [ms] field of the main Micro-Manager window.
- Determine the stimulation frequency, the number of action potentials (APs), and the time between the start of image acquisition and stimulation delivery, coding them in the Arduino script. Depending on the parameters, determine the number of acquired images corresponding to the total length of image acquisition and enter it in the Count field of the Multi-Dimensional Acquisition window of the Micro-Manager. Set 1 s in the Interval field to achieve 1 Hz time-lapse imaging. For electrical stimulation, deliver 1 ms constant voltage pulses (70 mV) through the stimulus isolator.
- Perform image acquisition. Execute the digitizer command and perform image acquisition. Verify that there is no unacceptable image drift and that pHluorin responses can be observed. Otherwise, the electrode position is incorrect. Return to step 4.2.
NOTE: Tissue damage that can potentially affect the pHluorin response can easily be identified by the DIC image of muscle fibers. If no pHluorin response is observed in the absence of such damage, electrode positioning may be incorrect. This can be identified as large image drift because improper electrode positioning causes muscle contraction, as described in step 4.2. The other problem that sometimes results in failure to elicit pHluorin response is air trapped in the theta glass capillary, which leads to electrical isolation of the electrode. Muscle contraction due to incorrect electrode positioning causes image drift in the Z-axis, which cannot be corrected in subsequent image analyses (see step 6.5). Therefore, it is recommended that data with large image drifts be identified during image acquisition and excluded. - Depending on the purpose of the experiment, change the stimulation intensity (i.e., frequency and number of pulses) and/or temperature. Save the time-lapse images as a time series stack of TIFF images. See Video 2.
6. Image analysis
NOTE: Use Fiji to perform the following image processing and analysis. Use Microsoft Excel or similar spreadsheet software to calculate the measurement results. Use Igor Pro to perform curve fitting on the obtained result.
- Create a difference image that highlights active synapses as described below.
- Open the time series stack of images in Fiji by choosing File > Open. If the displayed images are dim, choose Image >Adjust >Brightness/Contrast >Auto. Do not click Apply, as this will rescale the signal intensity, making further analysis impossible. Choose Analyze > Set Scale and enter the calibration factor defined in the imaging condition.
- Create a stack of five images taken during the pre-stimulus period by selecting Image > Duplicate and entering an appropriate number that indicates the range of the image sequence (e.g., 11-15 for the experiment with a 15 s pre-stimulus period).
- Select Image > Stacks > Z Project and select Average Intensity from the Projection Type drop-down menu. Press OK to create a representative image of the pre-stimulus period (Figure 4B). The averaging process is important to reduce the effect of signal fluctuations.
- Create an average image of the post-stimulus period using similar processing (Figure 4B). Duplicate a stack of five images immediately after the end of stimulation (e.g., the 26-30th image for the 15 s pre-stimulus period and 10 s stimulus period experiment). Select Process > Image Calculator and set the averaged pre-stimulus image and the averaged post-stimulus image as Image 1 and Image 2 in the drop-down menus, respectively.
- Select Subtract from the Operation drop-down menu and press OK to create a difference image that highlights active synapses (Figure 4B).
- Define the regions of interest (ROIs) to be analyzed.
- Select Edit > Selection > Specify and create a 7 µm diameter circular ROI on the difference image created in step 6.1. Place the ROI on the highlighted active synapse and press T to add the ROI in the ROI Manager. In the representative result shown in Figure 4C-D, 6 ROIs were positioned surrounding the boutons.
- Position another 5 ROIs of the same size in regions where no signal increase is observed. Use their average fluorescence as the background signal in the next step. Save the ROIs by selecting More >Save from the ROI Manager menu.
- Measure the signal intensity and calculate the substantial change in fluorescence.
- Select the original time series stack and transfer the ROIs saved in step 6.2 to the stack. Select Analyze > Set Measurements and select only the Mean gray value check box. Measure the average fluorescence intensity in the ROIs over all time points by selecting More > Multi Measure from the ROI Manager menu.
- Copy all values in the Results window and paste them into a spreadsheet program. Calculate the average background signal from the 5 background ROIs and subtract it from each synaptic ROI, which provides a substantial change of fluorescence in each bouton (Figure 4D). Average all data from a single view (in this case, 6 boutons), counted as n = 1 experiment. In Figure 4E, each trace obtained by averaging is represented as F/F0 by dividing the value at all time points by the average value during the initial baseline period.
- Estimate the fluorescence decay time constant (tau) by curve fitting.
- Open a new data table in Igor Pro by selecting Window > New Table. Copy the time point and F/F0 data from the spreadsheet and paste them into the table in a different row. Choose Window > New Graph, select F/F0 data as Y Wave and time point data as X Wave, and press Do It to create a graph.
- Choose Window > Show Info and define the range of data to be analyzed by placing one cursor on the signal peak and the other on the end of the trace. Choose Analysis > Curve Fitting and select exp_XOffset in the Function drop-down menu and the appropriate X and Y Waves in the Wave drop-down menu.
- Click Data Options and press the Cursors button to set the curve fitting range. Click Coefficients, enter 1 for Y0, and press Do It. Curve fitting by this procedure provides a tau value that represents the rate of fluorescence decay, which reflects the rates of SV endocytosis and reacidification.
- Perform manual drift correction (Optional) as described below.
- If image drift occurs and the selected spot moves outside the 7 µm diameter ROI during the image acquisition period, run the Manual Drift Correction plugin. Open the time series image stack in Fiji by selecting File > Open. Select the Point tool by clicking on the Point toolbar.
- Find the brightest bouton as a landmark and place a point in the center of it. Press T to add the point to the ROI manager. Repeat this process for the entire sequence of images. Display the first image and select Plugins > Registration > Manual Drift Correction. Save the corrected image series stack as a new file and use it for analysis.
NOTE: Although X-Y drift can be corrected, excessive Z-drift is not correctable with this method.
Results
If the dissected sample is prepared without severe tissue damage and the stimulation electrode is properly inserted into the spinal cord, a robust pHluorin response can be elicited by high-frequency electrical stimulation (Figure 4D,E). The pre-stimulus baseline fluorescence was likely due to the probe present on the surface of the presynapse. The increase in fluorescence during stimulation reflects the exocytotic release of the probe to the surface. The subsequent decay reflects endocytosis and reacidification of the probe-containing SVs. These properties of the pHluorin-based probe are in good agreement with previous studies in various experimental setups10,11,12,13,14,15,16,17,18,19. In this example, we selected synapses with relatively large signal increases to compare with those elicited by a weaker stimulus (Figure 4E). However, in the 20 Hz 100 APs condition, all boutons observed in the cytosolic TagRFP image (Figure 4A) exhibited detectable signal change that is apparent in the difference image of pHluorin fluorescence (Figure 4B), indicating that selection is not necessary. When comparing the pHluorin response to a given stimulus strength between control and experimental groups, it is recommended that ROIs be placed on the boutons seen in the TagRFP image, as selecting ROIs based on the pHluorin response itself would lead to a biased result.
Figure 4D shows the signal from individual boutons. Although the observed signal changes were large compared to the baseline signal fluctuation in all boutons, some showed baseline signal close to zero, making it difficult to accurately calculate relative signal changes such as F/F0. This is probably due to the low surface expression of the probe and the high background fluorescence of the epifluorescence image. To obtain a reliable F/F0 value, data from individual boutons were averaged and plotted as a single trace (Figure 4E, green trace). In the same set of boutons, pHluorin response was measured at different stimulus intensities and temperatures, and the F/F0 calculated from the average trace was superimposed on the graph (Figure 4E). Stimulation with 20 Hz 25 APs still caused a detectable increase, about 1/4th of the change elicited by the 20 Hz 100 APs, whereas the 50 Hz 500 APs caused a greater response. Because endocytosis and vesicle reacidification take longer after an excessive exocytotic event, the recording temperature was increased to 31 °C in the 50 Hz 500 APs condition to accelerate them. The fluorescence decay time constants estimated by step 6-4 were 16.6 s, 56.8 s, and 62.7 s for the 20 Hz 25 APs, 20 Hz 100 APs, and 50 Hz 500 APs, respectively.
It is important to verify that the fluorescence trace represents the true pHluorin response and is not an artifact due to image drift or muscle contraction caused by direct depolarization with the electrode. All of these artifacts are difficult to eliminate in the NMJ preparation. While excessive motion in the z-axis must be identified and removed from the analysis, the majority of motion in the x- and y-axes can be corrected through Manual Drift Correction, as outlined in step 6.5.
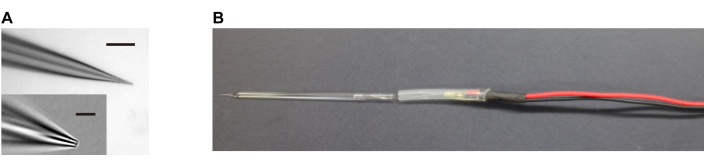
Figure 1: Preparation of stimulation electrode. (A) Theta glass pipette is used as a bipolar stimulation electrode. (Inset) Magnified view of the pipette tip. Scale bar, 100 µm and 10 µm (Inset). (B) Theta glass pipette and a pair of platinum wires connect each end of the theta glass capillary to the stimulus isolator. For experiments, the platinum wire is inserted further than the displayed image, and the pipette is wrapped by the silicone tubing. Please click here to view a larger version of this figure.

Figure 2: Sample prepared from Tg(hb9:tTAad, TRE:TagRFP-P2A-VpHalo) zebrafish larva. (A) Schematic representation of VpHalo located on the SV membrane (left), exposure of pHluorin to neutral pH during SV recycling (middle), and its labeling with HaloTag ligand conjugated to fluorescent dye during SV recycling (right). Although VpHalo is useful for both applications, this protocol focuses on pHluorin live imaging, which allows real-time monitoring of SV exo/endocytosis. This figure has been modified from27. (B) DIC (gray), TagRFP (yellow), and pHluorin (cyan) images of living 6 dpf larvae captured by epifluorescence microscopy. The reporter TagRFP and VpHalo, a fusion protein of pHluorin and the neurotransmitter transporter VGAT, are specifically expressed in motor neurons under the control of the hb9 promoter, also known as the mnx1 promoter. Tet-Off inducible expression system is incorporated to enhance gene expression. Note that pHluorin targeted to the SV lumen at the NMJs is not visible due to the acidic pH inside the SVs. The black rectangle in the DIC image shows the area where the confocal images in (C) were captured. Scale bar, 100 µm. (C) Confocal z-stack images of TagRFP (yellow), pHluorin (cyan), and postsynaptic AChR (magenta) in the NMJ sample prepared according to the protocol described in step 3. The postsynaptic AChR clusters were stained with α-bungarotoxin CF633 conjugate. Prior to imaging, the sample was stimulated with a high potassium extracellular solution containing Tris buffer (pH 8.0) so that the pH-sensitive pHluorin inside the SVs emits strong fluorescence. Note that the NMJs indicated by the colocalization of presynaptic pHluorin and postsynaptic AChR clusters are sparsely distributed, except for the border of body segments (arrowhead). The white rectangle in the merged image indicates a typical region recommended for obtaining images in the described protocol. Scale bar, 20 µm. Please click here to view a larger version of this figure.
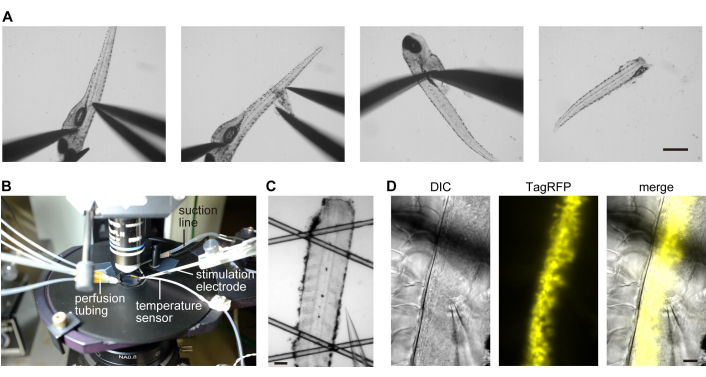
Figure 3: Preparation of larval zebrafish NMJ sample. (A) Sample preparation procedure. The skin of the larvae is removed with two fine forceps. Head and internal organs are removed with two scalpels. See Video 1 for more details. Scale bar, 0.5 mm. (B) A custom-made recording chamber with perfusion system, stimulation electrode, and temperature sensor. The chamber is continuously perfused with extracellular solution by gravity flow. The setup comprises four perfusion lines, with a switching valve that can be controlled by a PC, which enables the alteration of the perfusate during image acquisition if necessary. (C) NMJ sample on the recording chamber. The sample is mechanically fixed with a nylon thread glued to a C-shaped platinum wire. Scale bar, 100 µm. (D) Theta glass pipette is inserted into the spinal cord. The DIC image shows that the tip of the pipette is placed near the center of the spinal cord. TagRFP image (yellow) shows motor neurons located on the ventral side of the spinal cord. Scale bar, 20 µm. Please click here to view a larger version of this figure.
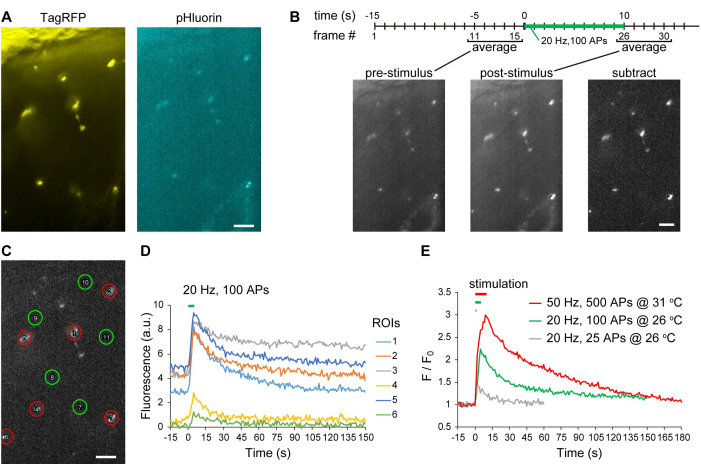
Figure 4: Image acquisition and processing of the pHluorin response at the NMJs. (A) TagRFP (yellow) and pHluorin (cyan) images were acquired from the middle part of the body segment where the stimulating electrode was placed. (B) pHluorin image averaged from 5 consecutive images acquired during the pre-stimulus period (left) and immediately after the 20 Hz 100 APs stimulus (middle, post-stimulus). A difference image (right) was created by subtracting the pre-stimulus image from the post-stimulus image, highlighting the responding boutons. The timeline diagram represents the frame numbers used for averaging. Scale bar 10 µm. (C) ROIs (red circles) surrounding responding boutons visible in the different images shown in (B). To measure background fluorescence, 5 additional ROIs (green circles) are placed in the region where no apparent fluorescence change is observed. (D) Changes in mean fluorescence intensity in each ROI shown as red circles in (C). The average change of 5 background ROIs was subtracted from the fluorescence of each bouton. (E) Average trace of relative pHluorin response from a single experiment. Fluorescence changes measured at each bouton shown in (D) were averaged and plotted as F/F0 (green line, 20 Hz 100 APs at 26 °C). We routinely used this average trace as data for n = 1 experiment. We repeated the experiment in the same boutons with different stimulation intensities and temperatures. Please click here to view a larger version of this figure.
Video 1: The video shows the preparation of the larval zebrafish NMJ sample. It plays at the same frame rate as the recording (30 fps). Please click here to download this Video.
Video 2: The video shows the change in pHluorin fluorescence in response to 20 Hz 100 pulses of electrical stimulation at the larval zebrafish NMJs. It was recorded at 1 fps and is played at 15 fps. Please click here to download this Video.
Discussion
The larval zebrafish NMJ is an emerging model system for the study of synaptic physiology and pathology26,31. A transgenic zebrafish expressing SpH in a neuron-specific manner has already been generated and employed for the analysis of a mutant exhibiting a locomotor defect17. Wen et al.17 demonstrated an approximately 2-fold increase in pHluorin fluorescence during stimulation of 1000 APs at 100 Hz in WT control NMJs. In contrast, our recent study using VpHalo demonstrated that a more than 3-fold increase in pHluorin fluorescence was observed during 200 APs at 20 Hz, which was a considerably weaker stimulation compared to the previous report of SpH17,27. Therefore, VpHalo allowed monitoring of SV recycling with improved responsiveness and offered the possibility of performing experiments closer to physiological conditions.
The abovementioned studies of SpH and VpHalo both used confocal laser scanning microscopes, which are very expensive and, therefore, often difficult to customize for live imaging applications. In this article, we present a protocol for VpHalo live imaging using a low-cost epifluorescence microscope and demonstrate that the results are comparable to those obtained with a confocal laser scanning microscope. As illustrated in Figure 4E, 100 APs at 20 Hz stimulation at 26 °C resulted in a more than 2-fold increase in pHluorin fluorescence, and weaker stimulation (25 APs at 20 Hz) was sufficient to elicit a discernible response. The fluorescence recovery time constants estimated here were also comparable to those measured by confocal microscopy in a previous study27. Therefore, this method allows the analysis of both exo- and endocytosis of AP-driven SV recycling at NMJs.
Although VGAT is not an endogenous protein in cholinergic motor neurons, we showed that VpHalo localizes to all SV pools, i.e., the readily releasable pool, the recycling pool, and the resting pool27. However, an endogenous SV protein as the fusion partner would be preferable for monitoring the NMJ function. Among the SV proteins, we have tested synaptophysin-pHluorin, called SypHy, at the zebrafish NMJ. Since the original SypHy, derived from rat synaptophysin, is diffusely distributed along the axon and does not specifically target the presynaptic terminal in zebrafish neurons32, zebrafish synaptophysin b was used as in recent studies23,24,25. However, the expression of the zebrafish version of SypHy in the motor neuron-specific Tg line we generated was much weaker than the VpHalo expressing Tg described here and thus did not match our experimental goal (unpublished data). The expression of the fusion protein with the endogenous protein may be limited by the pre-existing counterpart in the stable transgenic line. Recently, spontaneous SV fusion in the zebrafish NMJ was detected with SypHy using a transient expression system that provides robust protein expression33,34. However, it should be noted that spontaneous SV fusion at the presynaptic terminal is difficult to distinguish from constitutive trafficking of other organelles, such as endosomes35, which often contain pHluorin-based probes and are less acidic than normal SVs36. Therefore, it is critical to confirm the localization of pHluorin to the bona fide SVs by eliciting responses in an AP-dependent manner, especially when using the probe derived from other species21,33.
The advantage of optical imaging for presynaptic function in NMJs is its ability to assess the activity of individual terminals. In contrast, patch clamp recording measures the sum of current derived from all the terminals of the muscle, as well as those from adjacent muscles connected by gap junctions. However, unlike electrophysiological techniques, pHluorin imaging in this NMJ sample lacks sufficient sensitivity to detect single AP-driven events. Further improvement of the optical setup and/or transgenic specimen will be required to achieve this goal.
The NMJ tissue sample described here is suitable for the application of tailored stimulation and perfusion of solutions, including one containing an AChR antagonist. Live imaging of the AP-dependent pHluorin response was thus readily performed. Perfusion of the de-skinned NMJ sample would also allow several types of experiments, such as acid quenching of surface probes, SV alkalinization with ammonium ions, and acute inhibition of SV reacidification, all of which have been frequently performed to study SV recycling in depth6,7,10,11,12,13. In a previous study, we showed that 2 hours after dissection, 85% of the releasable SV pool was still exo/endocytosed in response to depolarizing stimulation27. Therefore, it is conceivable that this sample is physiologically active for at least a few hours. On the other hand, the protocol described here is arguably too invasive to observe true physiological activities. It would be desirable in the future to perform a similar pHluorin imaging in intact fish, which exhibit natural motor neuron firing patterns reflecting swimming behavior, rather than externally delivered stimulation. The fictive swimming paradigm, in which the tail of an immobilized zebrafish larva is stimulated with a fluid jet to elicit motor neuron firing, would be useful for this purpose34.
Disclosures
No conflict of interest is declared.
Acknowledgements
This work was supported by Japan Society for the Promotion of Science KAKENHI Grant 18K06882 to F. O.; and Japan Society for the Promotion of Science KAKENHI Grant 21K06429 and 24K10020 to Y.E.
Materials
| Name | Company | Catalog Number | Comments |
|---|---|---|---|
| 40x water immersion objective | Olympus | LUMPLFLN40XW | |
| 4ch gravity flow perfusion system | ALA | VCPlus-4G | |
| 5x objective | Olympus | NPLN5X | |
| Custum made imaging chamber | Physiotech | custum made | A black acrylic plate (10.7 cm diameter, 3 mm thick) with a well (1 cm diameter at the bottom, 1.5 cm diameter at the top) holding approximately 0.5 ml of perfusate. |
| Digital I/O device | Arduino | Uno Rev3 | |
| D-Tubocurarine dichloride pentahydrate | Sigma | 93750 | |
| Excel | Microsoft | Microsoft Office Professional Plus 2016 | |
| Fiji / imageJ | https://imagej.net/ | imageJ 1.54f | |
| Fine forceps | AsOne | 7-562-05 (Dumont #5) | |
| Glass Pasteur pipette | IWAKI | IK-PAS-5P | The tip should be trimmed and fire-polished until the final diameter is 1.5–2 mm. |
| Glass Petri dish | AsOne | 1-4564-06 | |
| Igor Pro | WaveMetrics | Ver. 6.37 | |
| Inline solution heater | Warner Instruments | SF-28 | |
| LED illumination system | X-cyte | XYLIS | |
| Methylen blue | Wako | 133-06962 | |
| Micro-Manager | https://micro-manager.org/ | Ver. 2.0.0 | |
| Mini magnetic clamp for perfusion tube | Warner Instruments | 64-1553 | |
| Motorized micromanipulator | Scientifica | PatchStar | |
| Motorized movable sample plate | Scientifica | MMSP | |
| Pipette holder | Narishige | H-13 | |
| Pipette puller | Narishige | PC-100 | |
| Platinum wire (φ0.1mm) | Nilaco | PT-351165 | |
| Platinum wire (φ0.5 mm) | Niaco | PT-351381 | |
| Scalpel | AsOne | 8-3086-02 (Feather #11) | |
| Scientific cMOS camera | Thorlabs | CC215MU | |
| Sea salt | NAPQO | Instant Ocean | |
| Stereo microscope | Olympus | SZX7 | |
| Stimulus isolater | AMPI | ISO-FLEX | |
| Suction tube | Warner Instruments | ST-3, 64-1406 | |
| Temperature controller | Warner Instruments | TC-324C | |
| Theta glass capillary | Sutter Instrument | BT-150-10 | |
| Tricaine (MS-222) | TCI | T0941 | |
| Upright microscope | Olympus | BX51WI |
References
- Sudhof, T. C. The synaptic vesicle cycle. Ann Rev Neurosci. 27, 509-547 (2004).
- Kavalali, E. T., Jorgensen, E. M. Visualizing presynaptic function. Nat Neurosci. 17 (1), 10-16 (2014).
- Miesenbock, G., De Angelis, D. A., Rothman, J. E. Visualizing secretion and synaptic transmission with ph-sensitive green fluorescent proteins. Nature. 394 (6689), 192-195 (1998).
- Sankaranarayanan, S., De Angelis, D., Rothman, J. E., Ryan, T. A. The use of phluorins for optical measurements of presynaptic activity. Biophys. J. 79 (4), 2199-2208 (2000).
- Chanaday, N. L., Cousin, M. A., Milosevic, I., Watanabe, S., Morgan, J. R. The synaptic vesicle cycle revisited: New insights into the modes and mechanisms. J Neurosci. 39 (42), 8209-8216 (2019).
- Egashira, Y., Takase, M., Takamori, S. Monitoring of vacuolar-type h+ atpase-mediated proton influx into synaptic vesicles. J Neurosci. 35 (8), 3701-3710 (2015).
- Egashira, Y., et al. Unique ph dynamics in gabaergic synaptic vesicles illuminates the mechanism and kinetics of gaba loading. Proc Natl Acad Sci U S A. 113 (38), 10702-10707 (2016).
- Schoch, S., et al. Snare function analyzed in synaptobrevin/vamp knockout mice. Science. 294 (5544), 1117-1122 (2001).
- Takamori, S., et al. Molecular anatomy of a trafficking organelle. Cell. 127 (4), 831-846 (2006).
- Granseth, B., Odermatt, B., Royle, S. J., Lagnado, L. Clathrin-mediated endocytosis is the dominant mechanism of vesicle retrieval at hippocampal synapses. Neuron. 51 (6), 773-786 (2006).
- Fernandez-Alfonso, T., Kwan, R., Ryan, T. A. Synaptic vesicles interchange their membrane proteins with a large surface reservoir during recycling. Neuron. 51 (2), 179-186 (2006).
- Kwon, S. E., Chapman, E. R. Synaptophysin regulates the kinetics of synaptic vesicle endocytosis in central neurons. Neuron. 70 (5), 847-854 (2011).
- Voglmaier, S. M., et al. Distinct endocytic pathways control the rate and extent of synaptic vesicle protein recycling. Neuron. 51 (1), 71-84 (2006).
- Balaji, J., Ryan, T. A. Single-vesicle imaging reveals that synaptic vesicle exocytosis and endocytosis are coupled by a single stochastic mode. Proc Natl Acad Sci U S A. 104 (51), 20576-20581 (2007).
- Santos, M. S., Park, C. K., Foss, S. M., Li, H., Voglmaier, S. M. Sorting of the vesicular gaba transporter to functional vesicle pools by an atypical dileucine-like motif. J Neurosci. 33 (26), 10634-10646 (2013).
- Wen, H., et al. Synchronous and asynchronous modes of synaptic transmission utilize different calcium sources. Elife. 2, e01206(2013).
- Wen, H., Hubbard, J. M., Wang, W. C., Brehm, P. Fatigue in rapsyn-deficient zebrafish reflects defective transmitter release. J Neurosci. 36 (42), 10870-10882 (2016).
- Wyatt, R. M., Balice-Gordon, R. J. Heterogeneity in synaptic vesicle release at neuromuscular synapses of mice expressing synaptophluorin. J Neurosci. 28 (1), 325-335 (2008).
- Tabares, L., et al. Monitoring synaptic function at the neuromuscular junction of a mouse expressing synaptophluorin. J Neurosci. 27 (20), 5422-5430 (2007).
- Odermatt, B., Nikolaev, A., Lagnado, L. Encoding of luminance and contrast by linear and nonlinear synapses in the retina. Neuron. 73 (4), 758-773 (2012).
- Almeida, R. G., et al. Myelination induces axonal hotspots of synaptic vesicle fusion that promote sheath growth. Curr Biol. 31 (17), 3743-3754.e5 (2021).
- Zhang, Q., et al. Synaptically silent sensory hair cells in zebrafish are recruited after damage. Nat Comm. 9 (1), 1388(2018).
- Vaithianathan, T., Henry, D., Akmentin, W., Matthews, G. Nanoscale dynamics of synaptic vesicle trafficking and fusion at the presynaptic active zone. eLife. 5, e13245(2016).
- Vaithianathan, T., Wollmuth, L. P., Henry, D., Zenisek, D., Matthews, G. Tracking newly released synaptic vesicle proteins at ribbon active zones. iScience. 17, 10-23 (2019).
- Shrestha, A. P., Vaithianathan, T. Tracking the dynamics of single fused synaptic vesicle proteins from a single ribbon active zone in zebrafish retinal bipolar cells. STAR Protoc. 3 (1), 101107(2022).
- Egashira, Y., Zempo, B., Sakata, S., Ono, F. Recent advances in neuromuscular junction research prompted by the zebrafish model. Curr Opinion Physiol. 4, 70-75 (2018).
- Egashira, Y., Kumade, A., Ojida, A., Ono, F. Spontaneously recycling synaptic vesicles constitute readily releasable vesicles in intact neuromuscular synapses. J Neurosci. 42 (17), 3523-3536 (2022).
- Weng, W., Li, D., Peng, C., Behnisch, T. Recording synaptic plasticity in acute hippocampal slices maintained in a small-volume recycling-, perfusion-, and submersion-type chamber system. J Vis Exp. (131), e55936(2018).
- Myers, P. Z., Eisen, J. S., Westerfield, M. Development and axonal outgrowth of identified motoneurons in the zebrafish. J Neurosci. 6 (8), 2278-2289 (1986).
- Westerfield, M., Mcmurray, J. V., Eisen, J. S. Identified motoneurons and their innervation of axial muscles in the zebrafish. J Neurosci. 6 (8), 2267-2277 (1986).
- Brehm, P., Wen, H. Zebrafish neuromuscular junction: The power of n. Neurosci Lett. 713, 134503(2019).
- Ben Fredj, N., et al. Synaptic activity and activity-dependent competition regulates axon arbor maturation, growth arrest, and territory in the retinotectal projection. J Neurosci. 30 (32), 10939-10951 (2010).
- Mandal, A., et al. Retrograde mitochondrial transport is essential for organelle distribution and health in zebrafish neurons. J Neurosci. 41 (7), 1371-1392 (2021).
- Wong, H. C., Drerup, C. M. Using fluorescent indicators for in vivo quantification of spontaneous or evoked motor neuron presynaptic activity in transgenic zebrafish. STAR Protoc. 3 (4), 101766(2022).
- Truckenbrodt, S., Rizzoli, S. O. Spontaneous vesicle recycling in the synaptic bouton. Front Cell Neurosci. 8, 409(2014).
- Casey, J. R., Grinstein, S., Orlowski, J. Sensors and regulators of intracellular ph. Nat Rev Mol Cell Biol. 11 (1), 50-61 (2010).
Reprints and Permissions
