Here, we present a protocol to utilize micro-computed tomography (micro-CT) to quantify ventilated regions in a unilateral bleomycin-induced pulmonary fibrosis model via intratracheal instillation on the lesional side.
A subscription to JoVE is required to view this content. Sign in or start your free trial.
Method Article
Unilateral Lung Volume Analysis Using Micro-CT for Enhanced Assessment of Pulmonary Fibrosis in Preclinical Models
* These authors contributed equally
In This Article
Summary
Abstract
Pulmonary fibrosis (PF) is a progressive and irreversible interstitial lung disease characterized by poor prognosis and limited treatment options. The traditional mouse model of pulmonary fibrosis induced by intratracheal instillation of bleomycin can result in uneven drug distribution and high mortality rates. The refined unilateral intratracheal instillation method for bleomycin administration in mice enables the creation of a more uniform and controlled pulmonary fibrosis model, providing a better simulation of the disease in humans. Here we present a protocol to utilize micro-computed tomography (micro-CT) to quantify ventilated regions in a unilateral bleomycin-induced pulmonary fibrosis model via intratracheal instillation on the lesional side. This approach allows for the quantification of overall lung volume and ventilated lung regions, providing a sensitive and accurate measure of disease progression and treatment response. This study involves anesthesia, precise drug administration, micro-CT scanning, and post-processing using 3D Slicer software for image analysis. The unilateral lung volume analysis following bleomycin treatment demonstrated a significant reduction in lung volume compared to controls. Masson's Trichrome staining confirmed the presence and increased deposition of collagen in the BLM-treated mice. Herein, we evaluated pulmonary fibrosis in preclinical models by performing unilateral lung volumetric analysis using micro-CT, providing researchers with a precise and thorough assessment method for evaluating therapeutic interventions in PF studies.
Introduction
Pulmonary fibrosis (PF) is a devastating and irreversible lung disease with limited treatment methods. The global incidence of PF ranges from 1 to 13 per 100,000 individuals, with a significant increase in prevalence observed with advancing age1. Despite significant efforts over the past decades, the therapeutic landscape for PF remains limited, with only two antifibrotic agents, nintedanib and pirfenidone, currently approved for the treatment of PF2. The underlying pathogenesis of pulmonary fibrosis is highly complex, encompassing various aspects of molecular and cellular physiology3. Experimental in vivo animal models, induced by various agents, are currently essential tools for investigating pathogenic mechanisms and disease phenotypes.
The bleomycin-induced pulmonary fibrosis mouse model, administered via intratracheal instillation, is extensively recognized for elucidating the underlying cellular and molecular mechanisms and for identifying potential therapeutic targets4. However, the asymmetric and nonselective distribution of intratracheally instilled bleomycin can lead to high mortality rates, primarily due to inhomogeneous fibrosis and bilateral lung injury5,6. To address this issue, we have proposed a unilateral intratracheal administration approach to ensure even delivery of experimental agents within the left lung and to better mimic the pathological process observed in PF patients7,8,9. Besides, the unilateral administration technique can also be utilized to evaluate drugs requiring localized distribution or for other experimental interventions targeting a specific lung.
In preclinical models, micro-computed tomography (micro-CT) has become increasingly valuable for investigating pulmonary pathologies and has proven to be a powerful tool for longitudinal studies, capable of providing qualitative and quantitative data to monitor disease progression as well as response to therapy interventions10. Micro-CT has been utilized to evaluate total volume, ventilated and non-ventilated regions, bronchial morphology, and tissue density. Based on our previous studies, we have developed a novel imaging method in which micro-CT was used to analyze the unilateral lung volume and assess the fibrosis levels in a murine model of lung fibrosis7,8,9. This method allows for the quantification of aerated lung regions, providing a more accurate and sensitive measure of disease progression and response to treatment.
This study introduces a unilateral ventilated lung volume analysis method derived from micro-CT scans in mice treated with bleomycin. This innovative method offers a more precise and comprehensive assessment of lung fibrosis, potentially transforming how we evaluate therapeutic interventions' efficacy in preclinical studies. This study contributes excellent refinement in the analysis of preclinical lung fibrosis models, providing a powerful quantitative analysis method for assessing treatment effects alongside disease progression.
Access restricted. Please log in or start a trial to view this content.
Protocol
All animal experiments were approved by the Animal Care and Use Committee of Guangzhou Medical University. The experiments were conducted on 6-8-week-old, 25-30 g male C57BL/6 mice. Mice were housed under a 12-h light/dark cycle (light: 25 lux) with ad libitum access to food and water and were randomly assigned to control and BLM groups.
1. Unilateral pulmonary intratracheal instillation
- Anesthetize C57BL/6 male mice (6-8 weeks old, 25-30 g) with an intraperitoneal injection of 1% pentobarbital sodium (50 mg/kg).
- Monitor the level of anesthesia by observing the respiratory rate and limb withdrawal reflex.
- Secure the mouse in a supine position on a plastic board angled at 70°-90°, restraining by the incisors and limbs.
- Use sterile blunt-ended forceps to gently retract the tongue.
- Insert a custom 22 G blunt needle into the trachea using a small animal laryngoscope to visualize the epiglottis and oropharynx structures. Rotate the board counterclockwise to -70° to align the left main bronchus parallel to the main bronchus. Advance the needle until resistance is felt.
NOTE: Pre-measure the catheter length by using a practice mouse of similar size to ensure optimal insertion length. - Rotate swiftly to a 30° angle and infuse 40 µL of bleomycin solution (0.02 mg). Remove the needle.
- Hold the mouse in position for at least 30 s to ensure proper drug distribution.
- Allow the mouse to recover prone on a warming blanket.
2. Micro-computed tomography (micro-CT) scanning
NOTE: Mice were scanned using the micro-CT system as per the manufacturer's instructions.
- Perform micro-CT scanning on mice for 3 weeks after bleomycin instillation.
- Add an appropriate amount of isoflurane to the vaporizer of the small animal gas anesthesia machine, turn on the vaporizer, adjust the induction concentration to 3%, and place the mice in the induction box until they lose the flip-flop reflex and exhibit slow, deep breathing.
- Remove the mice from the induction box and place them supine in the scanning table so that the mice have their limbs extended and their bodies aligned along the midline.
- Set the isoflurane maintenance concentration in the scanning table to 1%.
- Set the Micro-CT scanning mode: transverse field of view 43 mm, resolution 2K x 2K, pixel size 0.042 mm, slice thickness 0.042 mm.
- After scanning, place the mice on a warming blanket until they awaken.
3. Micro-CT post-processing: Unilateral selective lung segmentation and volume analysis
NOTE: Image processing and quantitative analysis were performed using the free, open-source software 3D Slicer (http://www.slicer.org), following the manufacturer's instructions. Clinical Hounsfield Unit (HU) ranges for the lung window were applied to normalize HU images, segmenting the lung parenchyma into normo-aerated regions ([-1000, -350] HU) as previously reported8,9,11. The image processing procedure is outlined as follows:
- Open 3D Slicer. The operational interface is illustrated in Figure 1.
- Click Load to import imaging data in DICOM format. Axial, coronal, and sagittal images will be displayed in the main interface (Figure 2).
- Adjust the parameters related to the sagittal view as shown in Figure 3 (optional). (1: show hidden options; 2: choose to Rename current volume; 3: Enter New name).
- In the Segment Editor module, click Add to create a segmentation for selective lung analysis (right lung) (Figure 4) (1: Volumes; 2: Segment Editor; 3: Add segment; 4: Set Threshold; 5: Adjust threshold range; 6: Use for masking; 7: Set sphere brush).
- Adjust the threshold range to [-1000, -350] HU and enable the Use for Masking option.
- Use the Paint tool with a sphere brush to segment the desired lung regions.
- Select the Island tool and choose Keep Selected Island. Highlight the right lung, then click Show 3D to display the 3D model in the visualization panel (Figure 5) (1: Edit islands (connected components); 2: Choose 'Keep selected island'; 3: Show 3D model).
- In the Terminology panel, change the 3D model's color to blue (optional).
- Repeat steps 3.4-3.6 for the left lung. Process the axial chest CT images layer by layer to calculate the ventilated left lung volume and create a 3D model (Figure 6).
- Change the 3D left lung model's color to yellow (optional).
- Set the opacity of the right lung segmentation to 0.2.
- Export the 3D model as required (Figure 7).
- Capture screenshots of the 3D view or slice images and save them (Figure 8) (1: Annotation Screenshot; 2: Choose the format of the image; 3: Modify the save path).
- Use the Segment Statistics module to calculate lung volume (mm3) for each segment and perform quantitative analysis of normo-aerated regions (Figure 9).

Figure 1: The interface of 3D Slicer software. The figure displays the main operational interface of 3D Slicer software. Please click here to view a larger version of this figure.
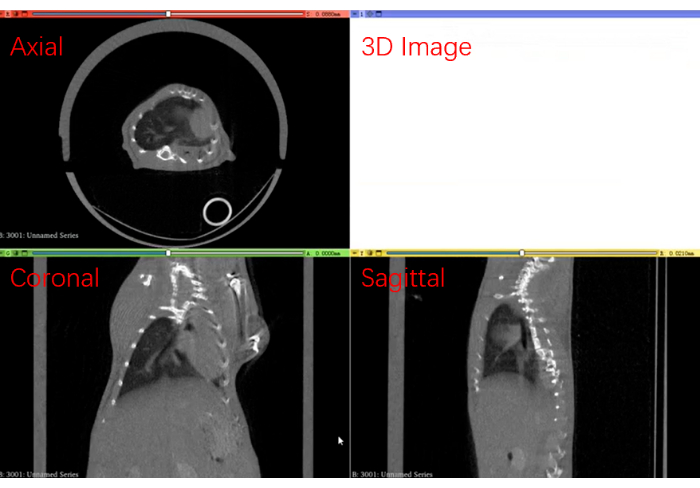
Figure 2: CT images of pulmonary fibrosis induced by unilateral intratracheal instillation in mice. Axial, coronal, and sagittal views, along with 3D lung reconstruction post-bleomycin instillation. Please click here to view a larger version of this figure.
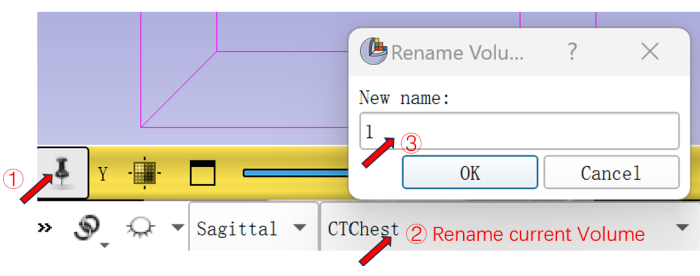
Figure 3: Sagittal view parameter adjustment. The figure illustrates the adjustment of parameters, enabling precise visualization and analysis. Please click here to view a larger version of this figure.
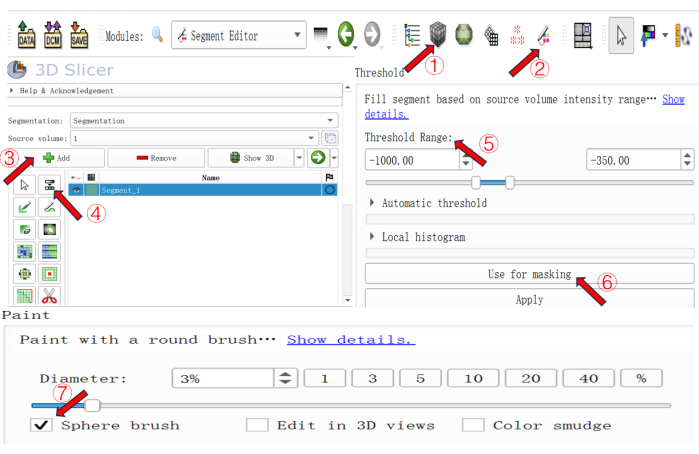
Figure 4: Segmentation editing and parameter adjustments. The figure demonstrates the process of segmentation editing and the corresponding parameter adjustments. Please click here to view a larger version of this figure.
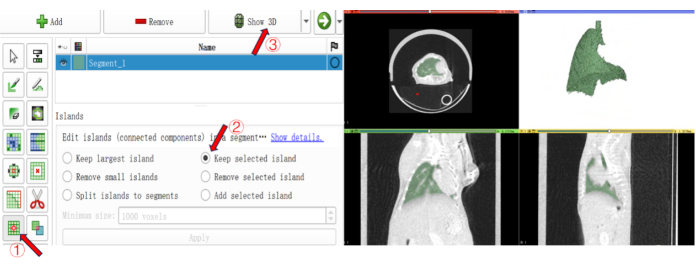
Figure 5: 3D segmentation of right lung. The process involves three sequential steps: editing connected components for lung segmentation (Step 1), selecting Keep selected island to isolate the right lung (Step 2), and clicking Show 3D to render the model in the visualization panel (Step 3). Please click here to view a larger version of this figure.

Figure 6: 3D reconstruction of the left lung based on micro-CT analysis. Axial chest CT images were processed layer-by-layer to segment aerated regions, quantify ventilated volume, and reconstruct a 3D model. Please click here to view a larger version of this figure.
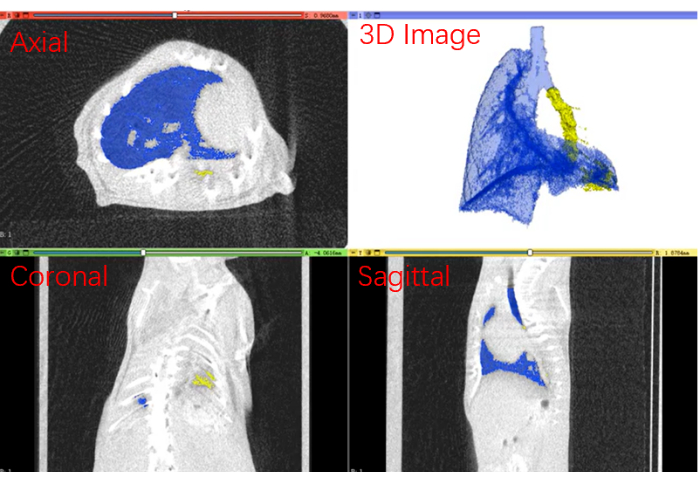
Figure 7: 3D lung reconstruction based on micro-CT analysis of ventilated lung volume in a unilateral pulmonary fibrosis model. Reconstructed models were exported in specified formats to predefined directories. Please click here to view a larger version of this figure.
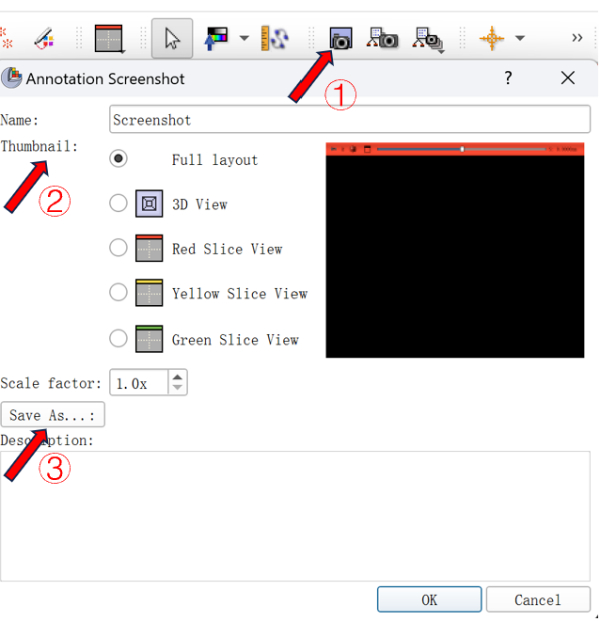
Figure 8: Guide to save images. The figure outlines sequential steps for saving images, starting from initiating the save function via the Annotation Screenshot menu to selecting formats and defining storage paths. Please click here to view a larger version of this figure.
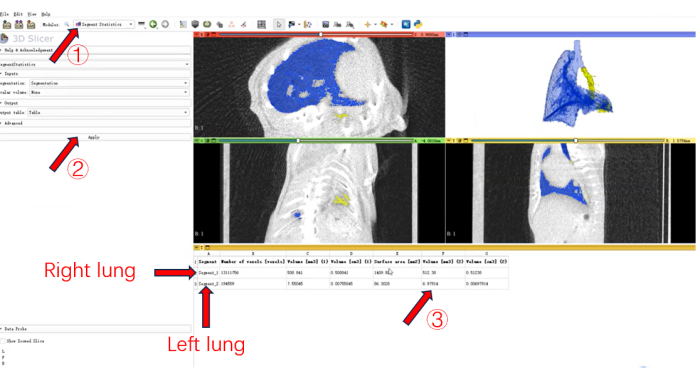
Figure 9: Statistical analysis based on micro-CT in a unilateral pulmonary fibrosis model. Quantitative data derived from normo-aerated regions were analyzed. Please click here to view a larger version of this figure.
4. Masson's trichome staining
- Fix the lung sample with 4% paraformaldehyde at room temperature (RT) overnight, dehydrate using a graded ethanol series, and embed in paraffin. Prepare slices with a thickness of 5 µm with a rotary microtome.
- Perform Masson's trichrome staining on the sections as follows.
- Rinse the deparaffinized and rehydrated sections in distilled water, followed by mordant treatment in preheated Bouin Fluid at 56-60 °C for 1 h or overnight at RT.
- After washing, stain the sections with Weigert's iron hematoxylin solution for 10 min, rinse under running warm tap water for 10 min, and immerse in Biebrich scarlet-acid fuchsin solution for 10-15 min.
- Achieve differentiation using phosphomolybdic-phosphotungstic acid solution for 10-15 min, and monitor until collagen-rich regions transitioned from red to clear.
- Then, directly transfer the slides to aniline blue solution for 5-10 min, rinse in distilled water, and differentiate in 1% acetic acid solution for 2-5 min.
- Following dehydration through graded ethanol (95% to absolute alcohol) and xylene clearing, mount the sections with a resinous medium.
5. Masson's trichrome staining machine learning analysis
- Histopathologically assess the collagen composition analysis in control and bleomycin-treated lungs using Masson's Trichrome staining.
- To reduce observer-dependent biases, acquire high-resolution digital images of stained lung sections using a whole-slide image scanner.
- Then, quantitatively analyze the collagen areas with automated software orbit image analysis8,9,12. The training process is briefly described below.
- Manually delineate several representative annotations for each tissue category (e.g., collagen, normal tissue, and fibrotic tissue). Use the extracted pixel-wise features from annotated training regions to construct the training set for the support vector machine (SVM).
- For Masson-stained sections, define tissue classification into three categories: collagen, normal tissue, and background.
NOTE: The machine learning model undergoes iterative training on whole slide images (WSIs) through repeated annotation and refinement until pathologist-validated evaluations confirm accurate tissue categorization. Once satisfactory classification accuracy is achieved, the process becomes fully automated: Features are extracted from each pixel within valid regions of interest (ROIs), and the SVM subsequently predicts the corresponding tissue category with high precision.
Access restricted. Please log in or start a trial to view this content.
Results
Figure 10A-D shows the results of the lung volume changes and the staining analysis.
To assess the impact of bleomycin (BLM) on lung tissue, we conducted a comparative analysis of lung volumes between saline-treated groups (Ctrl) and BLM-treated groups using 3D imaging techniques. The left lung volume is significantly reduced in the BLM group compared to Ctrl. Quantification of left lung volume (mm3) shows a significant...
Access restricted. Please log in or start a trial to view this content.
Discussion
Pulmonary fibrosis is a devastating disease characterized by the progressive scarring of lung tissue, leading to a decline in lung function and, ultimately, respiratory failure1. The pulmonary fibrosis mouse model, induced by various pharmacological agents and administration methods, is an essential tool for understanding disease progression and evaluating the efficacy of potential therapeutics, particularly in bleomycin intratracheal instillation13. However, the bleomycin ...
Access restricted. Please log in or start a trial to view this content.
Disclosures
The authors declare no conflicts of interest.
Acknowledgements
This work was supported by grants from the National Natural Science Foundation of China (82300092) and Independent Research of State Key Laboratory of Respiratory Diseases (SKLRD-Z-202302) and Funding for Innovation Capacity Building Project of Guangdong Provincial Research Institutes (KD032024001).
Access restricted. Please log in or start a trial to view this content.
Materials
| Name | Company | Catalog Number | Comments |
|---|---|---|---|
| 0.9% saline | Hopebio | HBPP008-100 | |
| 22G blunt needle | BD | 383922 | |
| 3D Slicer image computing platform | 3D Slicer | https://www.slicer.org/ | |
| Bleomycin | MCE | HY-17565 | |
| Isoflurane | RWD | R510-22 | |
| Masson Stain Kit | Yeasen | 60532ES58 | |
| Micro-CT | Pinseng | SNC-100 | |
| Orbit | Orbit Image analysis | https://www.orbit.bio/ | |
| Pentobarbital sodium | Sigma | P3761 | |
| Small animal laryngoscope | Yuyan Instruments | CG-02M | |
| SPSS | IBM | Version 19.0 | |
| Warm Blanket | Lab Anim Tech | LAT-16-0323 |
References
- Podolanczuk, A. J., et al. Idiopathic pulmonary fibrosis: state of the art for 2023. Eur Respir J. 61 (4), 2200957(2023).
- Raghu, G., Selman, M. Nintedanib and pirfenidone: new antifibrotic treatments indicated for idiopathic pulmonary fibrosis offer hopes and raises questions. Am J Respir Crit Care Med. 191 (3), 252-254 (2015).
- Moss, B. J., Ryter, S. W., Rosas, I. O. Pathogenic mechanisms underlying idiopathic pulmonary fibrosis. Annu Rev Pathol. 17, 515-546 (2022).
- Kolb, P., et al. The importance of interventional timing in the bleomycin model of pulmonary fibrosis. Eur Respir J. 55 (6), 1901105(2020).
- Jenkins, R. G., et al. An official American Thoracic Society workshop report: use of animal models for the preclinical assessment of potential therapies for pulmonary fibrosis. Am J Respir Cell Mol Biol. 56 (5), 667-679 (2017).
- Wu, Z., et al. Integrating network pharmacology, experimental validation and molecular docking to reveal the alleviation of Yinhuang granule on idiopathic pulmonary fibrosis. Phytomedicine. 128, 155368(2024).
- Liao, S., et al. Direct intrabronchial administration to improve the selective agent deposition within the mouse lung. J Vis Exp. (147), e59450(2019).
- Fu, Z., et al. Therapeutic effects of fatty acid binding protein 1 in mice with pulmonary fibrosis by regulating alveolar epithelial regeneration. BMJ Open Respir Res. 10 (1), e001568(2023).
- Song, S., et al. Intracellular hydroxyproline imprinting following resolution of bleomycin-induced pulmonary fibrosis. Eur Respir J. 59 (5), 2100864(2022).
- Pennati, F., et al. Micro-CT-derived ventilation biomarkers for the longitudinal assessment of pathology and response to therapy in a mouse model of lung fibrosis. Sci Rep. 13 (1), 4462(2023).
- Choi, E. J., et al. Serial micro-CT assessment of the therapeutic effects of rosiglitazone in a bleomycin-induced lung fibrosis mouse model. Korean J Radiol. 15 (4), 448-455 (2014).
- Yang, P., et al. Comprehensive analysis of fibroblast activation protein expression in interstitial lung diseases. Am J Respir Crit Care Med. 207 (2), 160-172 (2023).
- Liu, T., De Los, S. F., Phan, S. H. The bleomycin model of pulmonary fibrosis. Methods Mol Biol. 1627, 27-42 (2017).
- Ruscitti, F., et al. Longitudinal assessment of bleomycin-induced lung fibrosis by micro-CT correlates with histological evaluation in mice. Multidiscip Respir Med. 12, 8(2017).
- Vande, V. G., et al. Longitudinal micro-CT provides biomarkers of lung disease that can be used to assess the effect of therapy in preclinical mouse models, and reveal compensatory changes in lung volume. Dis Model Mech. 9 (1), 91-98 (2016).
- Buccardi, M., et al. A fully automated microCT deep learning approach for precision preclinical investigation of lung fibrosis progression and response to therapy. Respir Res. 24 (1), 126(2023).
- Ferrini, E., et al. A new anesthesia protocol enabling longitudinal lungfunction measurements in neonatal rabbits by microCT. Am J Physiol Lung Cell Mol Physiol. 321 (6), L1206-L1214 (2021).
- Jensen, M., et al. 3D whole body preclinical microCT database of subcutaneous tumors in mice with annotations from 3 annotators. Sci Data. 11 (1), 1021(2024).
- Lai, R., et al. The longitudinal and regional analysis of bleomycininduced pulmonary fibrosis in mice by microcomputed tomography. Heliyon. 9 (5), e15681(2023).
Access restricted. Please log in or start a trial to view this content.
Reprints and Permissions
