Here we present a protocol for acquiring and recording electroencephalographic (EEG) signals from neurodivergent children before, during, and after participating in dolphin-assisted therapy (DAT) sessions.
A subscription to JoVE is required to view this content. Sign in or start your free trial.
Method Article
Electroencephalographic Signal Acquisition Framework for Neurodiverse: A Case Study of Dolphin-Assisted Therapy
In This Article
Summary
Abstract
This protocol details the essential steps for acquiring and recording electroencephalographic (EEG) signals in neurodivergent children before, during, and after participating in Dolphin-Assisted Therapy (DAT) sessions. Its main objective is to provide consistent and reliable data that allow for an accurate assessment of brain activity at various stages of the therapeutic process. The protocol establishes a clear framework for comparing the obtained EEG signals, ensuring that each recording meets the standards required for effective analysis and interpretation. To this end, a comprehensive approach is used that combines electronic tools and mathematical methods, such as power spectral analysis, to identify changes in children's brain activity during the intervention. Furthermore, the replicability of the results is ensured, favoring validity and consistency in scientific studies related to the therapy. This protocol, by standardizing data acquisition, seeks to optimize therapeutic outcomes and provide a solid basis for comparing different studies on the impact of DAT on childhood neurodiversity. Furthermore, it provides a robust system for future research, facilitating objective interpretation of therapy effects and improving interventions.
Introduction
The cultural differences between various human groups largely depend on their cognitive abilities. While some individuals can adapt to these cultural norms, others often face marginalization. Therefore, it is essential for these individuals to participate in sessions that promote their integration into human society1.
Children with neurodevelopmental disorders, such as attention deficit hyperactivity disorder (ADHD) or autism spectrum disorder (ASD), often require a combination of physical and alternative therapies for comprehensive and effective rehabilitation2,3. It is important to note that, in addition to conventional therapies, alternative therapies have been developed to holistically address the physical, emotional, and spiritual aspects of patients. These therapies aim to complement traditional approaches and promote a more complete recovery2,4. When recommended by health professionals, these therapies can serve as valuable complements to conventional medicine3.
One alternative therapy that has garnered increasing public interest due to its advancements in pain relief and improvement in learning skills in children with disabilities is Dolphin-Assisted Therapy (DAT)5. This therapy leverages the interaction between humans and dolphins, typically pregnant or nursing bottlenose dolphins, in an aquatic environment to improve the quality of life of children with different abilities.
Currently, DAT lacks a fully standardized method, as variations have been observed in the processes applied to patients, therapists and/or specialists involved, session duration and frequency, as well as the type of dolphin and its training to achieve therapeutic effects6,7,8. According to Jette et al.9, the standardization of these therapies enhances data collection for research, as consistent data collection allows for comparative studies and the development of new evidence-based therapeutic strategies.
The absence of a standardized data capture system in DAT complicates the objective evaluation of its effects, limiting the comparability of results across studies. Despite the growing popularity of DAT, the methodological framework used to monitor patient changes varies considerably depending on the institution and research team, resulting in inconsistent and even contradictory outcomes10,11.
This variability has raised concerns within the scientific community, as there are no reliable parameters to measure therapeutic efficacy in terms of cognitive, emotional, or behavioral improvements in patients12. The lack of standards also affects the development of rigorous protocols, potentially leading to biased interpretations of results obtained in different DAT studies.
Variability in electroencephalographic (EEG) signal acquisition procedures, such as electrode placement, equipment calibration, and environmental conditions, can introduce inconsistencies in the results, complicating the interpretation of therapeutic effects and comparisons across studies13,14. Therefore, it is essential to standardize the data capture process for EEG signals in these therapies to obtain more accurate and reliable data, thereby contributing to the optimization of therapeutic practices and providing solid evidence of the effectiveness of DAT.
A standardized protocol promotes greater transparency in studies. When uniform methods are used, data and procedures can be shared more openly and effectively, allowing other researchers to verify and validate results. This is particularly important in emerging or underexplored fields, where researchers heavily rely on the replication and validation of previous studies to advance the understanding of the subject15.
A standardized data capture system, particularly one based on the use of neurophysiological tools such as electroencephalography, could provide more accurate data on the effects of DAT on the brain activity of neurodivergent patients. Although EEG is a non-invasive and widely used method to study brain activity, its application in monitoring alternative therapies remains inconsistent, affecting the reliability and validity of the data obtained16.
Alternative therapies, such as DAT, offer researchers an opportunity to explore the effects of treatments on patients' brains by analyzing brain signals like EEG, combined with mathematical techniques and artificial intelligence tools to assess the efficacy and efficiency of various interventions.
This study, therefore, describes a proposed testing protocol to evaluate treatment outcomes in México for children diagnosed with neurodevelopmental disorders, incorporating DAT. This proposal was carefully developed in collaboration with Delfiniti México, specialists in human-dolphin interaction, focusing not only on swimming activities but also on dolphin-mediated therapeutic interventions.
Access restricted. Please log in or start a trial to view this content.
Protocol
NOTE: The methodology used in this research was approved by the Ethics Committee of the National Polytechnic Institute of México in accordance with the Confidentiality Commitment Letter D/1477/2020. This document endorses the sample collection method and the ethical treatment provided to the bottlenose dolphins by the research team. The responsible use of participant data was ensured, and their consent was obtained for the use of the data in the experiments. Prior to sample collection and device connection, the procedure was thoroughly explained to the participants, who were free to withdraw from the study if they disagreed. Those who agreed to participate signed a written informed consent form. Additionally, participants were informed about the tests to be conducted; however, some did not fully understand the procedures before entering the tank with the cetaceans.
NOTE: This protocol outlines the detailed steps for acquiring and recording electroencephalographic (EEG) signals from neurodiverse children before, during, and after participating in Dolphin-Assisted Therapy (DAT) sessions. This protocol is divided into eight stages.
1. Patient consent
- Initial interview with parents and consent
- Schedule a meeting with the parents or guardians of the participating child. Do this in person at the Delfiniti Dolphinarium in Ixtapa, México.
- Conduct a detailed interview to gather relevant information about the child's neurodiversity, medical history, behavioral patterns, and previous therapy experiences.
- Describe the purpose of EEG data acquisition and recording, the procedures involved, and the potential benefits and risks. Ensure that parents or guardians understand and sign an informed consent form. Ensure this form complies with ethical standards and institutional guidelines.
- Collaboration with the dolphinarium staff: Organize a meeting with the therapy team at the dolphinarium, including trainers, therapists, and any relevant administrative staff. Ensure that the meeting covers the study's objectives and the roles of each team member.
NOTE: This stage prepares the parents and the dolphinarium team for the acquisition and recording of EEG signals, ensuring understanding, coordination, and an appropriate environment for the child during therapy while adhering to ethical and technical standards.
2. Preparation of the environment
- Equipment preparation
- Set up the EEG equipment (Table 1) in a quiet area, free from distractions, near the dolphinarium before any therapy session takes place. Ensure that all equipment is functioning properly and that spare parts are available.
- Calibrate EEG devices according to manufacturer specifications to ensure accurate and reliable data (Table 2, section poor signal).
NOTE: This stage ensures the proper setup and calibration of the equipment for the acquisition and recording of EEG signals in a suitable environment, ensuring that it functions correctly and is ready to capture accurate data before, during, and after the DAT.
| Hydrofone | Sampling Rate 96000 sps |
| Hydrophone Sensitivity 8103 25.41e-6; V/Pa | |
| Charge Converter Sensitivity 2647A 0.001 V/pC | |
| ThinkGear ASIC Module 1 (TGAM1) | Sampling frequency 512 sps |
| Bluetooth V3.0 | |
| Logitech C920 | Sampling frequency18 sps |
| Laptop Windows11 | Model: Machenike T58-V |
| CPU: i7-10870H (2.2GHz-5GHz/ 8Cores) | |
| GPU: NVIDIA Geforce RTX3060 Laptop GPU Dual Channel,Up To 32G | |
| Storage: M.2 PCIE. 2.5" HDD | |
| Screen: 144Hz 15.6 Inch FHD |
Table 1: Materials required for monitoring Dolphin-Assisted Therapy (DAT). This table details the equipment necessary for EEG signal acquisition and recording before, during, and after DAT.
| Equipment calibration | |
| Poor signal | An EEG signal captures electrical currents from activated neurons in the cerebral cortex, detectable by EEG systems. These systems function as brain-computer interfaces (BCI), using surface electrodes placed according to the International 10-20 Positioning System, The ThinkGear TGAM1 IS a non-invasive BCI that records and analyzes neural signals, achieving a precision level of 98 %. This is possible taking into account the data integrity, discarding those samples where the flag or indicator called Poor Quality Value is equal to zero. |
| The attributes of brain wave activity monitored by the sensor are quantified through designated flag values: Signal Flatness (25), Signal Excessiveness (26), Power Ratio (27), and Off-Head Detection (29). Concurrent flag indications are possible; for example, a flag value of 51 for suboptimal signal quality indicates non-compliance with both the flatness and excessiveness criteria. Flag values have been meticulously selected to ensure the uniqueness of each possible combination. In addition, a flag value of 200 is indicative of a state in which the sensor has recorded off-head conditions for a duration of four seconds. | |
| The RAW signal of the time series with a sampling frequency of 512 Hz, which allows sampling up to 256 Hz, thus making it possible to separate the signals into fundamental brain wave bands or rhythms, as well as to eliminate the 60 Hz frequency, due to electromagnetic interference from the AC power line through a 60 Hz Notch filter namely a Band Stop Filter. | |
| Bluetooth connection | To connect a TGAM1 sensor to a PC via Bluetooth, first ensure the sensor is powered on and the PC's Bluetooth is enabled. Pair the sensor by searching for devices in the PC's Bluetooth settings, selecting the TGAM1 sensor, and entering the pairing code (usually "0000" or "1234"). Once paired, open the application that will use the sensor, select it as the input device, and configure the correct COM port if required. Test the connection by verifying data transmission in the application, and troubleshoot by checking range, restarting devices, or updating drivers if needed. |
Table 2: Equipment calibration. This table provides a detailed description of the calibration of the components of the equipment used.
3. Pre-DAT stimulus
- Child preparation
- Introduce the child to the EEG acquisition equipment in a friendly and non-threatening manner. Take time to ensure the child feels comfortable. Use toys, pictures, or comforting objects familiar to the child to reduce anxiety, among others.
- Explain the EEG acquisition and recording procedure to the child using age-appropriate language and visual aids. Demonstrate how the EEG sensor works and allow the child to touch and explore the equipment if they wish.
- Acquisition and recording of EEG signals
- Place the child comfortably in a chair or on a mat, according to their preference and comfort. Then, verify if the Bluetooth connection is stable via the PC terminal. Ensure that they are seated in a way that allows easy access to their scalp for the placement of the EEG acquisition and recording sensor (Table 2 section Bluetooth connection).
- Position the EEG acquisition and recording sensor on the child's head gently and carefully, specifically at the FP1 point (Figure 1), ensuring it is snug but comfortable and the electrode is correctly connected. Use a pediatric-sized band and adjust it as needed to ensure a secure fit, as shown in Figure 2.
- After correct placement of the sensor and proper positioning of the electrode (Figure 3), set the EEG acquisition system for sample rate to 512 Hz (samples/second). This acquisition rate is sufficient to accurately record neural activity up to 256 Hz (per the Nyquist theorem), which covers all clinically relevant EEG frequency bands (0.5-100 Hz). Take a reference EEG measurement for 1 min with these parameters your control to obtain a stable point to compare the signal and the signal post-therapy.
NOTE: In EEG research, it is common to use 30-s time windows for analysis, as in sleep studies, where the data is segmented into epochs of this duration to classify sleep stages and recognize repeated cycles of brain activity17,18,19. However, this approach may be limited in situations such as monitoring critically ill patients, where brief events like seizures might go unnoticed. Therefore, the length of the windows should be adapted to the specifics of the analysis. In this study, broader windows were used to better capture brain activity associated with the intervention: one minute before, five minutes during, and one minute after therapy. This approach allows the identification of both long-term dynamic patterns and short-term changes related to the therapy, providing a more comprehensive view of the neurology induced by the intervention and facilitating more accurate inferences about its therapeutic effects. - Immediately back up the acquired and recorded EEG signal data to a secure storage device. Conduct an initial analysis to verify the quality and integrity of the data, verifying that the Poor Signal flag of the TGAM1 sensor is less than 51, as shown in Table 2 poor signal section.
- Continuously monitor the child for any signs of discomfort or distress during the acquisition and recording of the EEG signals. Provide reassurance and breaks if needed. Keep the child relaxed by calmly conversing or engaging in their favorite activities.
NOTE: This stage of the protocol aims to ensure a smooth and effective process for the acquisition and recording of EEG signals prior to the DAT, providing valuable data to enhance the understanding and efficacy of the DAT.
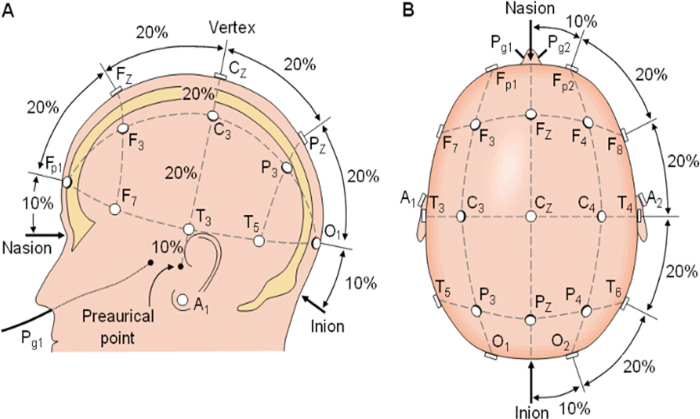
Figure 1: International 10-20 system for the placement of extracranial electrodes. The sensor must make contact at the FP1 point23. Please click here to view a larger version of this figure.
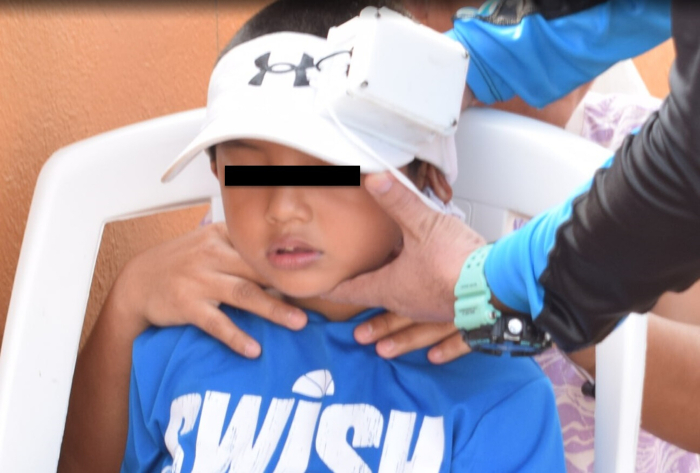
Figure 2: Use of electroencephalographic device. This Figure shows the correct way to place the EEG device. Please click here to view a larger version of this figure.
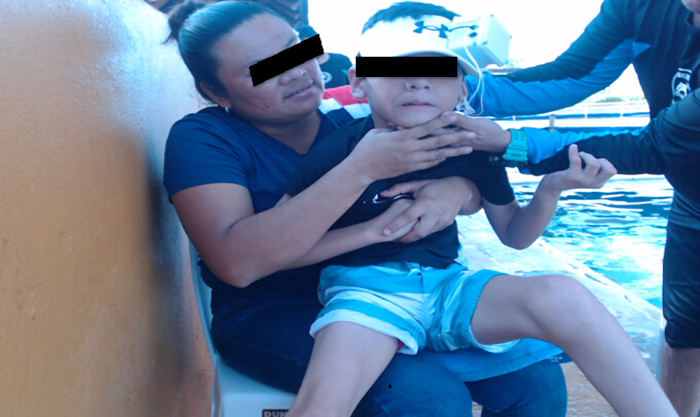
Figure 3: Acquisition and recording of EEG signals before DAT. This Figure shows the process of acquiring EEG signals before therapy starts. Please click here to view a larger version of this figure.
4. DAT stimulus
- EEG equipment setup
- Ensure the cap containing the EEG signal acquisition and recording device is properly positioned on the child's head. Check that the electrode makes good contact with the scalp and wipe the forehead, if necessary, as shown in Figure 1.
- Verify that the wireless connection is stable and that data transmission is functioning correctly since a Bluetooth EEG acquisition and recording device is being used, as shown in Table 2 Bluetooth connection section.
- Entering the water and initial data collection
- Assist the child in entering the water under the dolphinarium staff's supervision. Ensure that the child is comfortable and that the EEG equipment is waterproof and securely fastened.
- Ensure that the EEG acquisition and recording equipment is waterproofed and securely fastened.
- Collect and record reference EEG signal data as the child enters the water and begins to interact with the dolphins.
- During dolphin-assisted therapy
- Continuously monitor the acquisition and recording of EEG signals for 5 min (uninterrupted) while the child interacts with the dolphins (Figure 4). Ensure that the equipment is properly fitted and that the child remains relaxed.
NOTE: Review the written note from step 3.2.3. - Secure that someone on the staff takes detailed notes on the child's behavior, interactions with the dolphins, and any notable changes during the acquisition and recording of the EEG signals.
- Continuously monitor the acquisition and recording of EEG signals for 5 min (uninterrupted) while the child interacts with the dolphins (Figure 4). Ensure that the equipment is properly fitted and that the child remains relaxed.
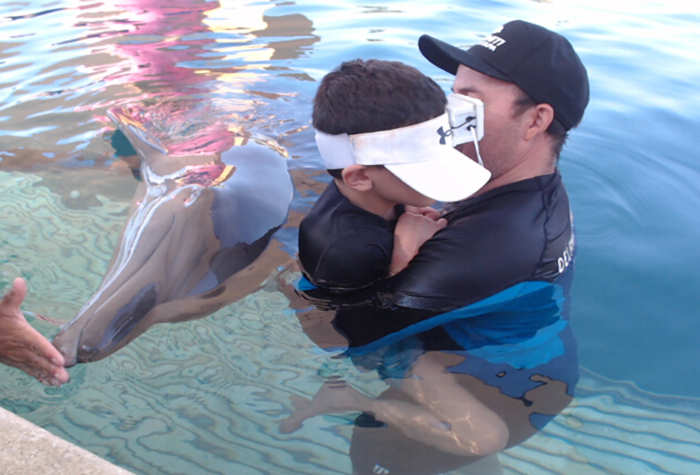
Figure 4: Acquisition and recording of EEG signals during DAT. This Figure shows the process of acquiring EEG signals during therapy. Please click here to view a larger version of this figure.
- Post-therapy data management:
- Immediately back up the acquired and recorded EEG signal data to a secure storage device.
NOTE: A plain text document (.txt) is obtained. - Assist the patient in exiting the water.
NOTE: This stage aims to ensure a smooth and effective process for continuing the acquisition and recording of EEG signals during DAT, providing valuable data to enhance the understanding and efficacy of this therapeutic approach, which allows obtaining data for continuous improvement of the DAT process and thus helping to identify any singular behavior of the dolphin towards the patient with a certain affectation and even during therapies to identify which points in the patient's body are stimulated and which generate changes in their behavior, which modifies the patient's brain activity.
- Immediately back up the acquired and recorded EEG signal data to a secure storage device.
5. Post-DAT stimulus
- Post-therapy preparation for the child
- Help the child transition from the therapy area to a comfortable and dry space.
- Explain to the child, in an appropriate age manner, that the acquisition and recording of EEG signals will continue for a little longer.
- Verify the EEG acquisition and recording equipment, as well as its recalibration. Ensure that the EEG acquisition and recording equipment remains in place and functions properly after the therapy session.
- Initial post-therapy data collection:
- Acquire, record, and immediately store the reference EEG signal data for 1 min immediately after the child has exited the water (Figure 5).
NOTE: Review the written note from step 3.2.3. - Allow the child to relax in a comfortable environment.
- Acquire, record, and immediately store the reference EEG signal data for 1 min immediately after the child has exited the water (Figure 5).
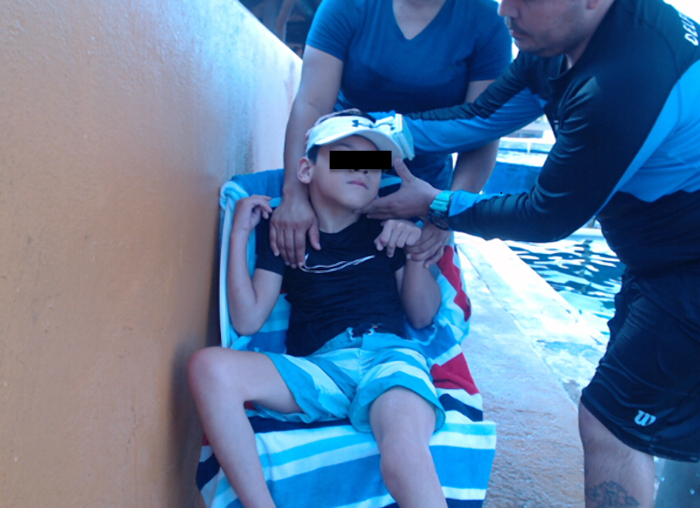
Figure 5: Acquisition and recording of EEG signals after DAT. This Figure shows the process of acquiring EEG signals after therapy. Please click here to view a larger version of this figure.
- Post-therapy structured activities:
- Engage the child in low-stimulation activities, such as listening to soft music.
- Continuously monitor the acquisition and recording of EEG signals for 1-min epochs, in order to ensure data stability while minimizing participant fatigue.
- Post-therapy data management: Immediately back up the acquired and recorded EEG signal data to a secure storage device.
NOTE: This stage ensures a smooth and effective process for continuing EEG signal acquisition and recording after the DAT.
6. Acquiring EEG data
- Data analysis and report preparation
NOTE: Processing of EEG raw data is controlled using a User Interface in order to promote intuitive understanding in relation to a Perception-Action Cycle, as shown in Figure 6.- Launch the Integrated Development Environment (IDE) for EEG signal acquisition and load the system.
- Open the IDE designed for EEG processing (Figure 7).
NOTE: The system will display available resources on the computer, including connected devices like webcams and EEG acquisition hardware.
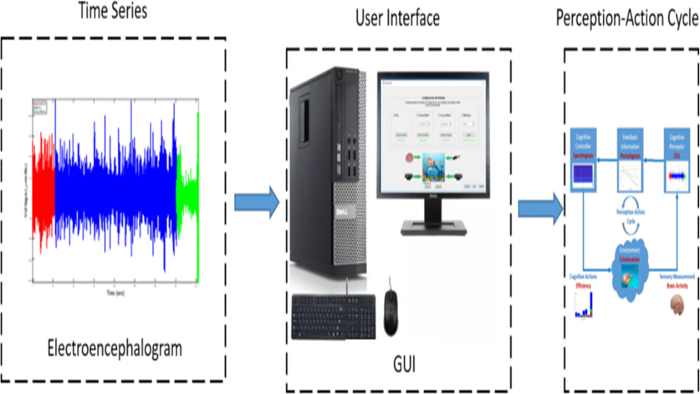
Figure 6: EEG processing. Processing raw EEG data is controlled by a user interface to promote intuitive understanding in relation to a perception-action cycle. Please click here to view a larger version of this figure.
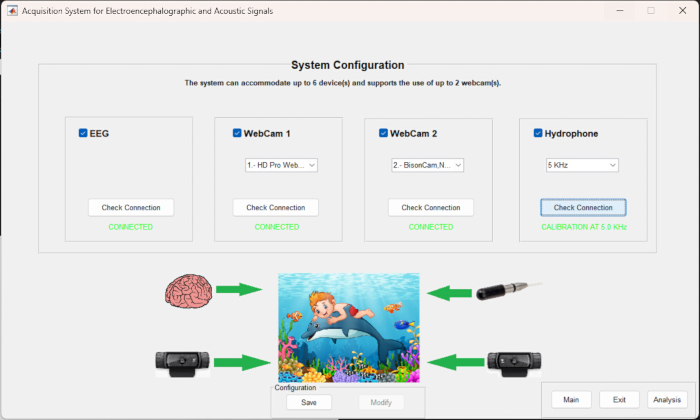
Figure 7: The integrated development environment (IDE) for EEG signal. The system will display available resources on the computer, including connected devices like webcams and EEG acquisition hardware. Please click here to view a larger version of this figure.
- Access the System Configuration Window:
- Navigate to the System Configuration Window within the IDE (Figure 8).
- Select the EEG device for sampling and configure its settings (Sampling rate = 512 sps, Channels to record = Fp1).
- Save the configuration to ensure consistency across sessions.
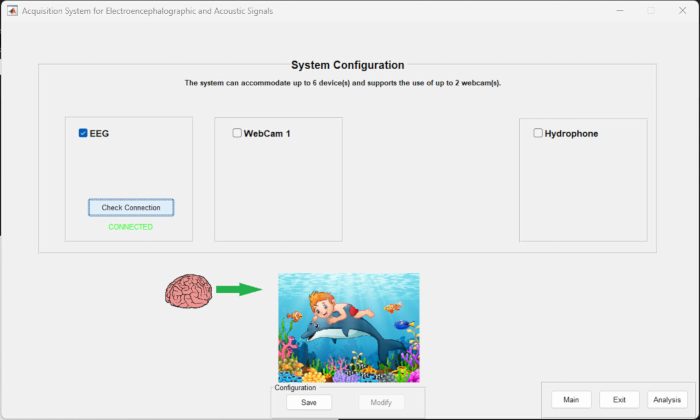
Figure 8: System configuration window. Displays the System Configuration Window, where devices are set up and customized. Please click here to view a larger version of this figure.
- Input patient information.
- Use the Patient Information Window ( Figure 9) to enter the following details: Patient's name and diagnosis, duration of the experiment in minutes, context of data collection relative to the DAT process (e.g., before, during, or after).
- Confirm the entries to proceed.
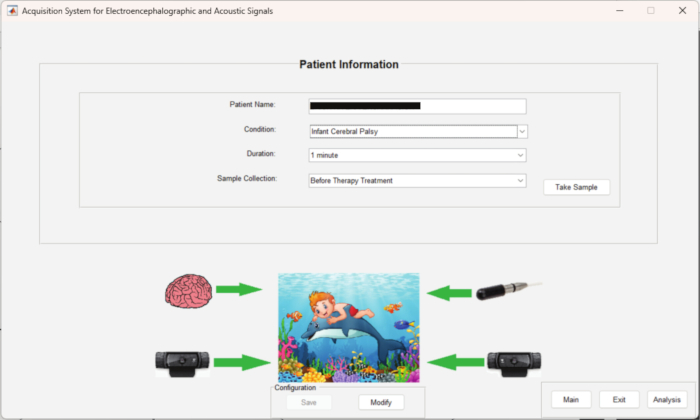
Figure 9: Patient information window. Shows the Patient Information Window, used for entering essential details like name, diagnosis, and experiment parameters. Please click here to view a larger version of this figure.
- Start Data Sampling:
- From the main screen, initiate data acquisition by activating the EEG sampling section.
- Click on the take sample button (Figure 10) to begin data capture.
NOTE: During the process, the take sample button will be disabled to prevent additional interactions while data is being collected from the configured devices. - Once the process is complete, a message indicating completed will appear Figure 11). At the end, a folder will be created containing the camera images and text files with the results of the EEG and hydrophone.
NOTE: The folder includes the patient's data, the date of the capture, the time it was taken, and whether there were additional captures on the same day with the same configuration.
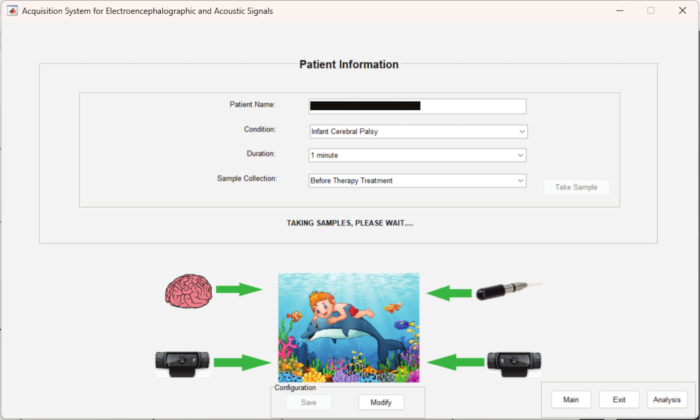
Figure 10: Start data sampling. This Figure shows the initiate data acquisition by activating the EEG sampling section. Please click here to view a larger version of this figure.
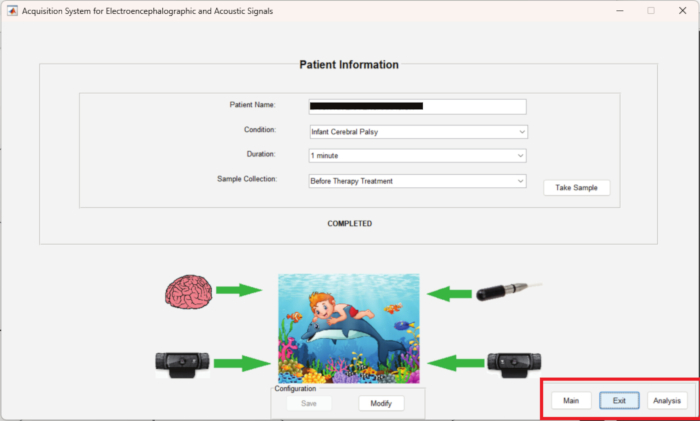
Figure 11: Complete sample taken from the patient. The figure shows when the software has completed the capture of the patient's samples. Please click here to view a larger version of this figure.
7. Analyzing EEG data
- Navigate to the Data Analysis Window, as shown in Figure 11 (highlighted in red). Next, in the Analysis section of the main User Interface (UI) (highlighted in red), select the EEG signals collected during the experiment for processing (Figure 12).
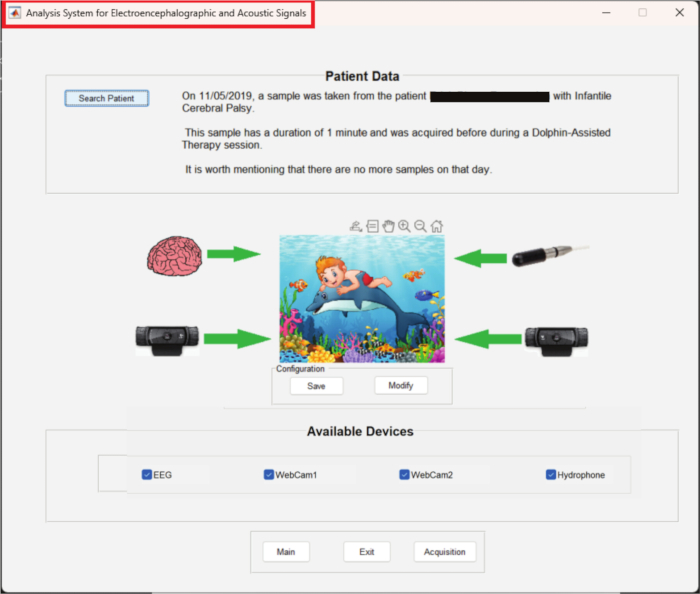
Figure 12: data analysis window. This Figure shows the analysis section of the main interface. Please click here to view a larger version of this figure.
- Apply signal processing techniques (the IDE supports several methods for analyzing EEG data). Apply the signal processing techniques by implementing the computational pipeline defined in Equations 1-5.
- Raw EEG signal visualization: Inspect the recorded signals in microvolts to verify their integrity and quality.
- FFT Periodogram: Perform a Fast Fourier Transform to analyze the frequency components of the EEG signals.
- To perform the decomposition of EEG signals into their frequency components using the Fast Fourier Transform (FFT), apply the following mathematical process. The EEG signal, represented as x(t) in the time domain, is transformed into its frequency domain representation X(f) using the equation (1)20,21,22
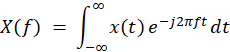 (1)
(1) - For discrete signals, like EEG sampled at a specific rate, use the Discrete Fourier Transform (DFT), calculated as (2)20,21,22
![Discrete Fourier Transform equation, Σx[n]e^(-j2πkn/N), formula for frequency analysis.](/files/ftp_upload/67935/67935eq10.jpg "figure-protocol-14") (2)
(2)
Here, N is the number of samples, x[n] is the discrete signal, and k corresponds to the frequency bins. - The steps involve first loading the raw EEG signal from a .txt file (time-series voltage values), then applying the FFT algorithm (Equation 2) to transform the signal into the frequency domain, and finally, plotting the power spectral density (PSD) or periodogram to visualize frequency components. The output is interpreted by identifying peaks in the spectrum corresponding to dominant brainwave frequencies (e.g., delta, theta, alpha).
- To perform the decomposition of EEG signals into their frequency components using the Fast Fourier Transform (FFT), apply the following mathematical process. The EEG signal, represented as x(t) in the time domain, is transformed into its frequency domain representation X(f) using the equation (1)20,21,22
- Spectrogram analysis: Generate spectrograms to examine how the frequency content of the signal evolves over time.
- Preprocessing: Segment the EEG signal x(t) into overlapping time windows (e.g., 1-second windows with 50% overlap) to capture the time-varying frequency characteristics. Multiply each window by a Hamming window w(t) to minimize spectral leakage, according to equation (3)20,21,22.
 (3)
(3) - Fourier rransformation: Apply the FFT to each windowed segment to convert the time-domain signal into the frequency domain, yielding a complex-valued spectrum, according to equation (4) 20,21,22
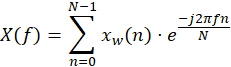 (4)
(4)
NOTE: X(f) represents the frequency components, N is the number of samples in the segment, and f is the frequency. - Spectrogram generation: Compute the squared magnitude of X(f) to obtain the power spectral density (PSD) for each time segment, as shown in equation (5)20,21,22:
 (5)
(5)
NOTE: The result is plotted as a spectrogram, where the x-axis represents time, the y-axis represents frequency, and the color intensity indicates the power of each frequency component. - Select the EEG or Hydrophone option and load the data, as shown in the red-highlighted box in Figure 13.
- Band-pass filtering: Apply a band-pass filter to isolate specific frequency ranges, such as low beta and low gamma bands, which are relevant for the perception-action cycle.
- Preprocessing: Segment the EEG signal x(t) into overlapping time windows (e.g., 1-second windows with 50% overlap) to capture the time-varying frequency characteristics. Multiply each window by a Hamming window w(t) to minimize spectral leakage, according to equation (3)20,21,22.
- FFT histogram: Identify the key frequency bands such as delta (0.5-4 Hz), theta (4-8 Hz), alpha (8-13 Hz), beta (13-30 Hz), and gamma (>30 Hz), which are essential for EEG analysis.
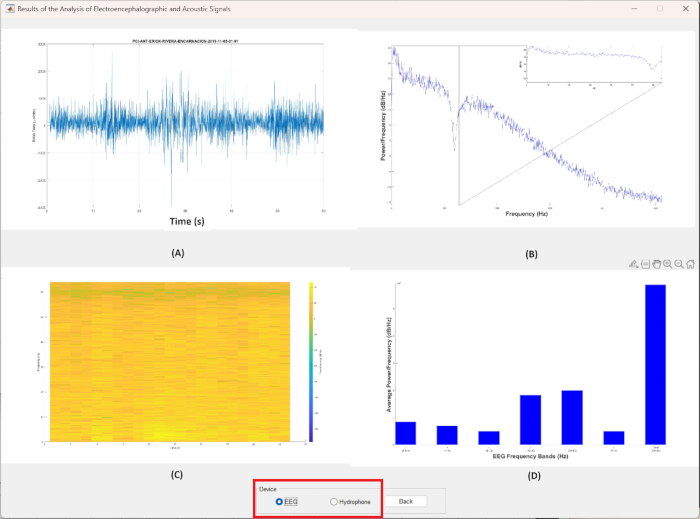
Figure 13: Results from EEG processing. Outputs generated by the system, showing the raw data and the processed EEG signals (A), the signal processing through the FFT periodogram (B), the spectrogram (C) and the band-pass filtered spectrogram (D). Please click here to view a larger version of this figure.
- Review and interpret results.
- Examine processed outputs (FFT periodograms/spectrograms) as follows.
- Periodograms: Identify dominant frequency peaks (e.g., alpha: 8-13 Hz) using the PSD plot (Equation 5). Peaks exceeding baseline noise indicate physiologically relevant oscillations.
- Spectrograms: Analyze time-frequency power dynamics (e.g., beta/gamma bursts during action-perception tasks) by interpreting color intensity gradients (time [s] on x-axis, frequency [Hz] on y-axis). Correlate power changes (e.g., low-beta suppression) with task epochs.
- Contextualize findings by cross-referencing spectral patterns (e.g., theta/delta ratios) with patient metadata (e.g., clinical condition, task performance) and annotating events (e.g., stimulus onset) on spectrograms to align neural activity with experimental timelines.
- Examine processed outputs (FFT periodograms/spectrograms) as follows.
- Export and save results.
- Store PSD values (frequency x power) and spectrogram arrays (time x frequency x power) in structured formats.
- Export using interface options: Select formats (e.g., TIFF for figures, ASCII for raw PSD values) compatible with MATLAB. For spectrograms, retain time-frequency resolutions in exported files.
8. Communication of results
- Compile a detailed report of the findings.
- Structure the report to include:
- Spectral analysis: Tabulate dominant frequency bands (e.g., peak alpha power at 10 Hz ± 1.5 Hz) and their statistical relevance (e.g., p < 0.05, corrected for multiple comparisons).
- Time-frequency dynamics: Highlight significant spectrogram patterns (e.g., gamma-band [30-45 Hz] power increases during motor execution) with timestamps aligned to task events.
- Clinical/experimental correlations: Annotate observations.
- Visual aids: Embed key figures (PSD plots, spectrograms) with standardized labels (e.g., "Power (µV2/Hz)") and captions specifying parameters (e.g., "Hamming window: 1 s, 50% overlap").
- Data supplement: Attach processed data files (e.g., .csv tables of band-power values per subject) for reproducibility.
- Structure the report to include:
- Feedback and closing.
- Stakeholder review: Circulate the draft report to collaborators for verification of methodological consistency (e.g., confirm FFT parameters match pre-registered protocols) and interpretation accuracy (e.g., validate theta-gamma coupling claims against raw traces).
- Finalization: Address feedback iteratively and archive all outputs (raw/processed data, scripts, reports) in a structured repository.
NOTE: Organize a meeting with the dolphinarium staff to provide a summary of the post-therapy data collection session. The results obtained will be available for the dolphinarium staff to share with the parents. In this stage, the acquired and recorded EEG data are analyzed and characterized, a detailed report is prepared, and feedback is offered to the parents regarding the results.
Access restricted. Please log in or start a trial to view this content.
Results
This study describes the process of acquisition and analysis of EEG signals through a simulated UI in IDE, complemented by the application of a standardized method for data collection. This approach provides a reference framework that facilitates comparability between studies and ensures reproducibility, enabling other researchers to replicate the procedures and obtain consistent results in various contexts.
Access restricted. Please log in or start a trial to view this content.
Discussion
Dolphin-assisted therapy (DAT) emerged as a therapeutic modality for individuals with autism and developmental24,25. DAT offers life-enriching, fresh experiences to participants, stimulating interest and sensory engagement in an arresting backdrop25,26. However, there are several limitations that affect the interpretation of the efficacy of DAT, including the demands for controlled experimental desi...
Access restricted. Please log in or start a trial to view this content.
Disclosures
The authors have nothing to disclose.
Acknowledgements
This article is supported by the National Polytechnic Institute (Instituto Politécnico Nacional) of México through project No. 20250776, granted by the Secretariat of Research and Postgraduate (Secretaría de Investigación y Posgrado), Secretaría de Ciencia, Humanidades, Tecnología e Innovación (SECIHTI). Additionally, the research described in this work was conducted at the Center for Computing Research (Centro de Investigación en Computación). It should be noted that this research is a major part of the doctoral thesis entitled Estandarización de la recolección de señales EEG de niños neurodivergentes durante Terapias Asistidas por Delfines, bajo el Paradigma de la Ciencia de Sistemas, supported by the work of Brenda Lorena Flores Hidalgo, work directed by Dr. Oswaldo Morales Matamoros and Dr. Jesús Jaime Moreno Escobar. Furthermore, support has been received through the scholarship granted with CVU 1145035 by the Secretaría de Ciencia, Humanidades, Tecnología e Innovación (SECIHTI).
Access restricted. Please log in or start a trial to view this content.
Materials
| Name | Company | Catalog Number | Comments |
|---|---|---|---|
| Charge Converter | Hottinger Brüel & Kjær | Sensitivity 2647A 0.001 V/pC Sampling frequency 512 sps | |
| Hydrofone | Hottinger Brüel & Kjær | 8103 | Sampling Rate 96000 sps Sensitivity 8103 25.41e-6; V/Pa |
| Laptop Windows11 | Machenike | Machenike T58-V | CPU: i7-10870H (2.2GHz-5GHz/ 8Cores) GPU: NVIDIA Geforce RTX3060 Laptop GPU Dual Channel,Up To 32G Storage: M.2 PCIE. 2.5" HDD Screen: 144Hz 15.6 Inch FHD |
| ThinkGear ASIC Module 1 | NeuroSky | TGAM1 | Bluetooth V3.0 |
| Webcam | Logitech | C920 | Sampling frequency18 sps |
References
- Müller, E., Schuler, A., Yates, G. B. Social challenges and supports from the perspective of adults with Asperger syndrome and other autism spectrum disabilities. Autism. 16 (5), 478-490 (2012).
- Carrillo-Mora, P., et al. Alternative and complementary medicine in neurological disorders and neurological disability patients: prevalence, factors, opinions and reasons. Complement Ther Med. 72, 102920(2023).
- Böhne, L. Ä, Wirner, C., Schoser, B., Schröter, C., Baum, P. Frequency and satisfaction of conventional and complementary or alternative therapies for neuromuscular disorders. Neurol Res Pract. 5 (1), 53(2023).
- Brondino, N., et al. Complementary and alternative therapies for autism spectrum disorder. Evid Based Complement Alternat Med. 2015, 258589(2015).
- Dolphin sonar pulse intervals and human resonance characteristics. Birch, S. Proceedings of the 2nd International Conference on Bioelectromagnetism (Cat. No.98TH8269), 2022, Melbourne, VIC, Australia. 141-142 (2022).
- Griffioen, R. E., Enders-Slegers, M. The effect of dolphin-assisted therapy on the cognitive and social development of children with Down syndrome. Anthrozoös. 27 (4), 569-580 (2014).
- Griffioen, R., Van Der Steen, S., Cox, R. F. A., Verheggen, T., Enders-Slegers, M. Verbal interactional synchronization between therapist and children with autism spectrum disorder during dolphin assisted therapy: five case studies. Animals. 9 (10), 716(2019).
- The psychosocial effect of therapeutic activities with dolphins for children with disabilities. Kreiviniene, B., Mockevičienė, D., Kleiva, Ž, Vaišvilaitė, V. Proceedings of the International Scientific Conference, 3, 94-106 (2019).
- Jette, D. U., Halbert, J., Iverson, C., Miceli, E., Shah, P. Use of standardized outcome measures in physical therapist practice: perceptions and applications. Phys Ther. 89 (2), 125-135 (2009).
- Servais, V. Some comments on context embodiment in dolphin-assisted therapy. Anthrozoös. 18 (1), 43-49 (2005).
- Brensing, K., Linke, K., Todt, D. Can dolphins heal by ultrasound: studies on the echolocation of dolphins. J Theor Biol. 225 (1), 99-105 (2003).
- Marino, L., Lilienfeld, S. Dolphin-assisted therapy for autism and other developmental disorders: a dangerous fad. Am Psychol. 33 (2), 2-3 (2007).
- Pascual-Marqui, R. D., Michel, C. M., Lehmann, D. EEG neuroimaging. Clin Neurophysiol. 118 (10), 2463-2492 (2017).
- Niedermeyer, E., Da Silva, F. L. Electroencephalography: Basic Principles, Clinical Applications, and Related Fields. , Lippincott Williams & Wilkins. New York. (2004).
- Rutherford, M. Standardized nursing language: what does it mean for nursing practice. Online J Issues Nurs. 13 (1), 1-9 (2008).
- Kwak, S., Lee, M., Lim, J. Standardization of EEG signal processing in clinical neurofeedback. Neuroimage. 152, 221-234 (2017).
- Prerau, M. J., Brown, R. E., Bianchi, M. T., Ellenbogen, J. M., Purdon, P. L. Sleep neurophysiological dynamics through the lens of multitaper spectral analysis. Physiology. 32 (1), 60-92 (2016).
- A look at the strength of micro and macro-EEG analysis for distinguishing insomnia within an HIV cohort. Gunnarsdottir, K. M., et al. Annu Int Conf IEEE Eng Med Biol Soc, , 6622-6625 (2015).
- Herman, S. T., et al. Consensus statement on continuous EEG in critically ill adults and children, part II: personnel, technical specifications, and clinical practice. J Clin Neurophysiol. 32 (2), 96-108 (2015).
- Detection of EEG signal post-stroke using FFT and convolutional neural network. Djamal, E. C., Furi, W. I., Nugraha, F. 2019 6th International Conference on Electrical Engineering, Computer Science and Informatics (EECSI), 2019, Bandung, Indonesia. 18-23 (2019).
- Emotion classification using fast Fourier transform and recurrent neural networks. Prawira, H. G., Sundari, S., Djamal, E. C., Wulandari, A. 2021 International Conference on Instrumentation, Control, and Automation (ICA), 2021, Bandung, Indonesia. 94-99 (2021).
- EEG feature extraction with fast Fourier transform for investigating different brain regions in cognitive and reasoning activity. Amin, H. U., et al. 2022 IEEE 5th International Symposium in Robotics and Manufacturing Automation (ROMA), 2022, Malacca, Malaysia. 1-4 (2022).
- Jurcak, V., Tsuzuki, D., Dan, I. 10/20, 10/10, and 10/5 systems revisited: their validity as relative head-surface-based positioning systems. Neuroimage. 34 (4), 1600-1611 (2007).
- Marino, L., Lilienfeld, S. Third time's the charm or three strikes you're out: an updated review of the efficacy of dolphin-assisted therapy for autism and developmental disabilities. J Clin Psychol. 77 (6), 1265-1279 (2021).
- Marino, L., Lilienfeld, S. O. Dolphin-assisted therapy: more flawed data and more flawed conclusions. Anthrozoös. 20 (3), 239-249 (2007).
- Marino, L., Lilienfeld, S. Dolphin-assisted therapy: flawed data, flawed conclusions. Anthrozoös. 11 (4), 194-200 (1998).
- Marino, L., Lilienfeld, S. Does Dolphin-Assisted Therapy have Healing Effects. Pseudoscience in Child and Adolescent Psychotherapy. , Cambridge University Press. New York. (2019).
- Müller, R. A., Shih, P., Keehn, B. The use of EEG biomarkers in neurodevelopmental disorders: progress and challenges. Biol Psychiatry Cogn Neurosci Neuroimaging. 4 (7), 574-583 (2019).
Access restricted. Please log in or start a trial to view this content.
Reprints and Permissions
