The presentation of detailed methods for the evaluation of right ventricle function will enhance the quality and reliability of pulmonary hypertension research, offering a robust framework for future studies and enhancing reproducibility across different laboratories.
A subscription to JoVE is required to view this content. Sign in or start your free trial.
Method Article
Evaluation of Right Ventricular Function in Experimental Models of Pulmonary Arterial Hypertension
In This Article
Summary
Abstract
Pulmonary hypertension (PH) is a chronic condition associated with reduced survival, making it a critical area of research. Experimental models of PH have significantly improved our understanding of its pathophysiology and facilitated the design of small observational and clinical trials. However, it is crucial to establish standardized methodologies to ensure comparability across different experimental studies and research groups. Standardization not only enhances reproducibility but also fosters collaboration among research teams.
In this video, we outline the methodological steps required to analyze the functional parameters of PH accurately. These include echocardiographic assessment, invasive right ventricle (RV) puncture, and calculation of the Fulton's index. Concerning echocardiography, measurement of the pulmonary arterial acceleration time and the pulmonary ejection time ratio, as well as the calculation of RV output, are presented in detail. Regarding invasive measurements, essential procedures, including anesthesia protocols, optimal animal positioning, mechanical ventilation setup, precise chest wall opening, visualization of the RV, and RV puncture techniques, are described.
The methodology for ventricular dissection (Fulton's index) is explained in detail, as well as the calculation of the RV/left ventricle plus septum ratio, corrected for the animal's body weight. We believe that providing a detailed presentation of these methods will enhance the quality and reliability of PH research, offering a robust framework for future studies and enhancing reproducibility across different laboratories.
Introduction
Adequate functional measurement of the right ventricle (RV) function in small animals has become essential since the increase in studies using animal models in respiratory and cardiovascular sciences. There are several animal models of pulmonary hypertension (PH), using monocrotaline1, hypoxia2, or Sugen + hypoxia3. They have served well to unravel new pathophysiological pathways1,4 and study new potential pharmacological5 and non-pharmacological6 treatments for PH. Nevertheless, despite the causative agent that leads to the PH phenotype, there is concern about the functional measurement of RV performance, mainly because RV function usually (1) is the primary outcome adopted by preclinical studies7; (2) different types of equipment are available to perform echocardiography and invasive puncture of the RV chamber; (3) expertise in anesthesia and some knowledge about invasive mechanical ventilation in small animals are required, as well as the recognition of an adequate window for RV assessment.
According to the 3Rs of preclinical studies (replacement, reduction, and refinement), reduction is aligned to expand methods that help obtain comparable levels of information, which increases reproducibility8. Thus, the number of animals will be reduced in research mainly as a result of strategies such as appropriate experimental design, correct statistical evaluation, and sharing practice and knowledge. In the present methodological study, three different techniques are presented after PAH induction (Figure 1). The first is the noninvasive measurement of RV function by transthoracic echocardiography. The images are obtained from long and short parasternal axis views. The diameter of the RV output tract, pulmonary acceleration time (PAT), and pulmonary ejection time (PET) are evaluated using a pulsed-wave Doppler. The PAT/PET ratio is calculated and used as an indirect index of pulmonary arterial hypertension (PAH)9,10. The second is the invasive puncture of the RV. Usually, a physiologic data acquisition system is used, continuously recording on a computer running custom-made software. The invasive right ventricular systolic pressure (RVSP) and mean pulmonary arterial pressure are often used as primary outcomes in different studies7. The third is the right ventricular hypertrophy index, also called Fulton's index11, which is the ratio of the RV to the left ventricle (LV) plus interventricular septum (S) weight (RV/LV + S), corrected for the animal's body weight. The presentation of detailed methods for the evaluation of RV function will enhance the quality and reliability of PH research, offering a robust framework for future studies and enhancing reproducibility across different laboratories.

Figure 1: Flowchart. Summary illustration of the protocols described in this article. Abbreviations: ECHO = echocardiography; LV = left ventricle; PAH = pulmonary arterial hypertension; RV = right ventricle; RVH = right ventricular hypertrophy; RVSP = right ventricular systolic pressure; S = interventricular septum. Please click here to view a larger version of this figure.
Access restricted. Please log in or start a trial to view this content.
Protocol
The study protocol was approved by the Ethics Committee on the Use of Animals (CEUA) of the Federal University of Rio de Janeiro under process number 043/22. All procedures complied with the Principles of Laboratory Animal Care and the US National Academy of Sciences Guide for the Care and Use of Laboratory Animals. The study followed the ARRIVE guidelines11.
1. Animal preparation and experimental protocol
- Calculate the number of animals as reported previously12.
NOTE: Taking into account that the differences in RVSP between CTRL and PAH achieved an effect size of d = 3.95, assuming a sample size ratio of 1 and a statistical power (1-β = 0.8) to identify significant differences (α = 0.05), three animals per group were necessary in this protocol. - Randomize (six) male Wistar rats (220 ± 10 g) to receive an intraperitoneal (i.p.) injection of monocrotaline (60 mg/kg; PAH group, n = 3) or saline solution (1 mL/kg; CTRL group, n = 3).
- On day 28, measure the cardiovascular parameters, and euthanize the animals by exsanguination through an abdominal aorta transection.
2. Echocardiography
- Electrocardiography system setup
- Check if the power cable is properly connected to the device and the outlet. Press the POWER button on the control panel for a few seconds until the system starts.
- Make sure the transducer is properly connected.
- Select PATIENT from the database to register the animal ID to start the procedure.
- Turn off the transducer by pressing the freeze button (
 ) on the control panel while preparing the animal to preserve the useful life of the device.
- Electrocardiography procedure
- Configure the anesthesia machine with 2.5% isoflurane and 1 L/min oxygen discharge.
- Put the animal in the chamber of the anesthesia machine. Once the animal is sedated, position the animal in the supine position, fix the upper paws to the surgery table with adhesive tape, and attach the mask of the anesthesia machine mask to the animal's snout. To avoid waking the animal, be sure to change the anesthesia machine toggle button from CHAMBER to MASK.
- Assess the level of anesthesia by the evaluation of pupil diameter, position, and response to light; position of the nictitating membrane; and movement in response to tail stimulation. Start the experiments when responses to a noise stimulus (handclap), as well as whisker stimulation and tail clamp response, are absent13.
- Use gauze dressing with detergent and water to wet the fur on the anesthetized animal's chest. Shave the fur from the animal's chest with a razor blade attached to the Kelly forceps. Apply a generous amount of conductive gel to the animal's chest.
- Press the 2D button on the control panel.
- Place the transducer between the third and fifth intercostal space to acquire the short axis. Direct the transducer toward the animal's left shoulder (90° angle in relation to the sternum), capturing a cross-sectional image at the level of the base of the heart, which allows visualization of the RV, aortic valve, pulmonary valve, and left atrium (Figure 2A).
- Press the freeze button (
 ) on the control panel to freeze the image and press the save button (
 ) on the control panel to save the image.
 - When the correct angle is found, remain in that position and press the pulse wave button (PW) on the control panel to obtain pulsed-wave spectral Doppler mode (Figure 2B).
- Use the trackball on the control panel to move the yellow cursor (left or right/up or down) on a screen and position it over the pulmonary valve.
- Press the five-button (5) on the control panel to obtain the blood flow curve through the pulmonary valve.
CRITICAL STEP: To obtain a good image, make sure that the curve is intensely white and the acoustics are loud and clear. - Position the transducer between the third and fifth intercostal space to acquire the long axis. Direct the transducer toward the animal's right shoulder (45°-60° angle in relation to the sternum), capturing an image of the longitudinal section, which allows visualization of the left ventricle, right ventricle, left atrium, mitral valve, and aortic valve (Figure 2C).
- Press the freeze button (
 ) on the control panel to freeze the image and press the save button () on the control panel to save the image.
 - Press the END EXAM button on the control panel to finish the experiment and save the images in the patient database.
- Data analysis
- Electrocardiography system setup:
- Check if the power cable is properly connected to the device and the outlet. Press the POWER button for a few seconds until the system starts.
- Select SEARCH on a screen and choose the respective animal ID from the database to start the analysis.
- Press the SONOVIEW button on the control panel. Click once within the image on a screen to start the analysis.
NOTE: The image is delimited by a dotted line. This line must be continuous after clicking to start the analysis. - Using the trackball, select the short-axis image in pulsed-wave spectral Doppler mode in the right corner of the screen.
- Press the calculator button (
 ) on the control panel and select the parameter heart rate (HR) on a screen. Using the trackball, position the cursor line from peak to peak of two curves. Do this three times to get the average value.
 - Press the calculator button (
 ) on the control panel; select the parameter pulmonary valve (PV) and after parameter pulmonary valve acceleration time (PV AccT/ET) on a screen. Using the trackball, position the cursor line from the start to the peak of the curve. Then, position the line from the start to the end of the same curve. Do this three times to get the average value (Figure 3A).
 - Save the data by pressing the save button () on the control panel.
- Using the trackball, select the long-axis image in the right corner of the screen.
- Press the calculator button (
 ) on the control panel; select the parameter right ventricular outflow tract (RVOT) and after parameter right ventricular outflow tract diameter (RVOT DIAM) on a screen. Using the trackball, position the cursor from one wall of the RV to the other wall. Do this three times to get the average value (Figure 3B).
 - Save the images with data by pressing the save button () on the control panel.
- Transfer the images to the external hard drive. Select SEARCH on a screen and the respective animal ID from the database. Select EXPORT on a screen and choose the external hard drive.
- Electrocardiography system setup:
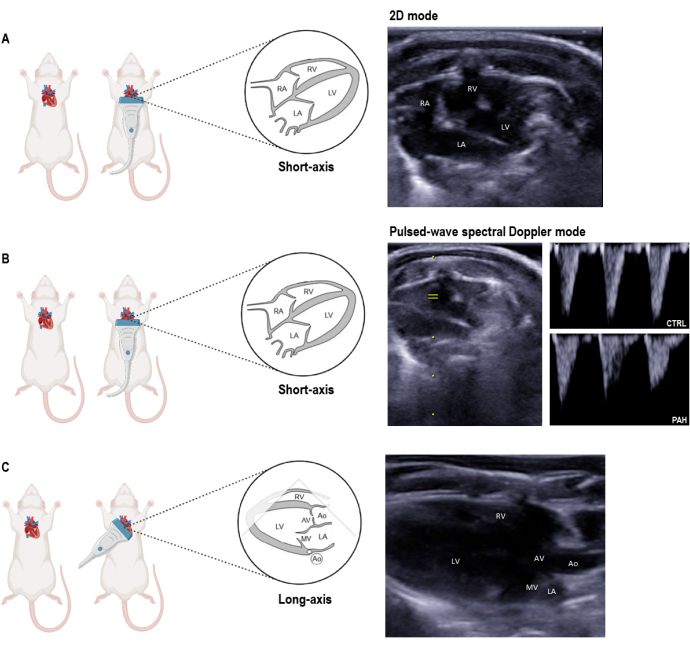
Figure 2: Parasternal window of transthoracic echocardiography. Schematic image of the transducer position for acquisition of cross-sectional images and a representative image of the short axis in (A) 2D mode and (B) pulsed-wave spectral Doppler mode, and the (C) long axis. Abbreviations: Ao = aorta; AV = aortic valve; CTRL = control; LA = left atrium; LV = left ventricle; MV = mitral valve; PAH = pulmonary arterial hypertension; RA = right atrium; RV = right ventricle. Please click here to view a larger version of this figure.
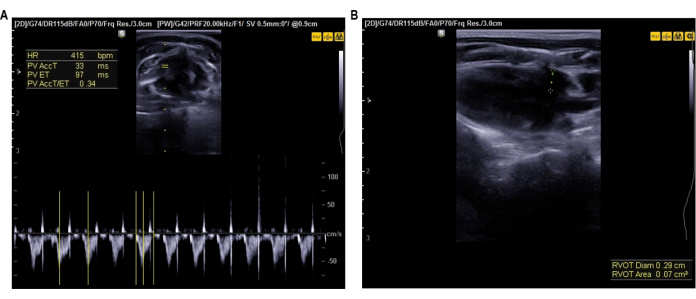
Figure 3: Transthoracic echocardiography data analysis. (A) Representative image of the position of the dotted line for calculation of the PAT/PET ratio, and (B) representative image of the position of the connector to analyze the right ventricle outflow diameter. Abbreviations: HR = heart rate; PAT = pulmonary artery acceleration time; PET = pulmonary ejection time; PV AccT = pulmonary valve acceleration time; PV ET = pulmonary valve ejection time; PV AccT/ET = pulmonary valve acceleration time to pulmonary valve ejection time ratio; RVOT Diam = right ventricular outflow tract diameter; RVOT Area = right ventricular outflow tract area. Please click here to view a larger version of this figure.
3. Right ventricular systolic pressure
- Right ventricular systolic pressure preparation
- Mechanical ventilator: Set on the mechanical ventilator the following parameters: Fraction of inspired oxygen (FiO 2 ), 21%; tidal volume, 8 mL/kg; respiratory rate, 70 bpm; and positive end-expiratory pressure (PEEP), 3 cmH2O.
- Monitor and signal transducer: Connect the 19 G scalp vein set used for puncture to a monitor so that the pressure can be visualized.
- Zeroing procedure for the multi-channel physiological recorder's pressure transducer:
- Connect the pressure transducer to the appropriate hemodynamic cable and channel of multiparameter Monitor.
- Align both the pressure transducer and end tip of the scalp vein at a similar height of the animal's thorax.
- Press the zero button in the multiparameter screen. Move the scalp vein connected to pressure transducer upward and downward, and check if values increase and decrease, respectively.
CRITICAL STEP: The scalp vein set must be filled with heparinized saline to ensure proper signal transmission. Avoid air bubbles in the line to prevent signal interference.
- Calibration procedure for the multi-channel physiological recorder's pressure transducer: Using an external and analogical sphygmomanometer, check if the pressure applied in the pressure transducer is similar to that observed in the multipameter monitor screen. If not, adjust the channel gain.
- For a computer with an open dedicated acquisition system, set the software:
- Open the program and click DataAcquisitionSystem on the screen. This opens the window where the pressure signal can be monitored.
- In this window, click the white arrow on a screen in the top left corner.
- A pop-up will appear prompting configuration; click OK.
- In the new window, go to Physical Channel, and click Browse.
- Using the CTRL button on a keyboard, select all channels except for 'ai7', and click OK.
- Below Physical Channel, see Input Terminal Configuration set to default. Use the side arrows to change it to RSE, then click OK.
- A new window will open where the signal acquisition can be checked, and the baseline can be calibrated. Press Load Configuration, select the appropriate configuration file, and then press Load Signals on the right side of the window.
- Wait for 5-10 s for the signal to appear on the screen. Once visible, click on Signal 0, select Signal 6, and then click on Zero Baseline.
- Navigate to the file directory and choose the location where data will be saved during the experiment. Click Current Folder in the bottom right corner.
- Now that all parameters are set in the software, click OK. Return to the main program window and click Acquire. The program will start signal acquisition.
- In the bottom right corner, select the signal according to the configuration (signal 6).
NOTE: Ensure that the signal on the computer monitor matches the signal on the transducer monitor and fluctuates when the scalp vein set is moved. If not, troubleshoot the signal transmission before proceeding.
- Right ventricular systolic pressure procedure
- After echocardiography, administer an i.p. combination of 87.5 mg/kg ketamine and 12.5 mg/kg xylazine to anesthetize the animal.
- Once the animal is sedated, administer 400 µL of lidocaine subcutaneously (s.c.) in the tracheal region.
- Tracheostomy
- Once the animal is sedated, place it in the supine position and fix the upper paws with adhesive tape to the surgery table on a heat source to maintain body temperature (e.g., a heated surgical table).
- Clean the throat area with 70% alcohol. Then, use a gauze dressing with detergent and water to wet the fur on the anesthetized animal's throat. Shave the fur from the animal's throat with a razor blade attached to the Kelly forceps.
- Make an incision in the skin using tissue forceps with teeth and scissors.
- Expose the trachea by retracting the submaxillary gland and bluntly dissecting the surrounding muscles using tissue forceps with teeth and curved Kelly forceps.
- Carefully pass a suture line beneath the trachea using curved Kelly forceps.
- Using the loose ends of the suture line, lift the trachea gently for better visualization, and make a small cut between two cartilage rings using a scalpel blade. Be cautious of the cartilage rings to avoid cutting the larynx.
- Insert the tracheostomy cannula gently with the beveled tip facing downward, and after positioning correctly, turn upward, advancing approximately five rings but no deeper.
NOTE: If the tracheostomy cannula contains mucus, it is necessary to exhale it with a syringe before attaching it to the mechanical ventilator. - Secure the cannula with the suture line, ensuring it stays in place.
- Administer 2 mg/kg pancuronium bromide to paralyze the muscles' animal.
NOTE: Pancuronium bromide can be injected intravenously through a tail vein catheter or intraperitoneally. - Connect the animal to the mechanical ventilator, tested and configured in volume-controlled ventilation mode.
- With the animal tracheostomized and connected to the mechanical ventilator, proceed to expose the heart.
- Catheterization
- Clean the chest area with 70% alcohol. Then, use a gauze dressing with detergent and water to wet the fur on the anesthetized animal's chest. Shave the fur from the animal's chest with a razor blade attached to the Kelly forceps.
- To open the thoracic cavity, make an incision in the skin from the base of the xiphoid process, stopping about 0.5 cm below the tracheostomy site.
- Cut the internal and external intercostal muscles to expose the ribs and sternum.
- Expose the heart by cutting the sternum with scissors, and use Kelly forceps to hold each side of the thoracic cavity for better access to the RV.
NOTE: Always cut along the sternum to minimize excessive bleeding, which could impair visibility. - The heart is covered by the pericardium. Remove this thin membrane using forceps so that the heart chambers can be differentiated.
- Now that the animal has been tracheostomized, connected to the ventilator, and the heart is exposed, proceed with the right ventricular puncture.
- Ensure the computer is on, LabView is open, and the baseline is configured for signal acquisition before assess the RVSP. Locate the RV, using the interventricular branch of the coronary arteries as a reference. This branch is visible and indicates the position of the interventricular septum, separating the right and left ventricles.
- In the software, verify that signal acquisition has started. Click the save button on a screen and enter the animal's ID.
- Using the heparinized saline-filled 19 G scalp vein set, puncture slightly above the reference point, ensuring the needle is not inserted too deeply.
CRITICAL STEP: Overinserting the needle could puncture the left ventricle, yielding pressures unrelated to the pulmonary artery. - Verify the accuracy of the puncture by the pressure values obtained: RVSP in control animals, 10-20 mmHg; RVSP in animals with pulmonary arterial hypertension, up to 60 mmHg; acquired pressure >80 mmHg indicates that probably the cannula reached the left ventricle (Figure 4B).
- Record at least 10 stable pressure wave peaks to ensure data reliability.
- At the end of signal acquisition, administer heparin to the animal for blood collection by puncture of the left ventricle or abdominal vena cava using a heparinized syringe.
NOTE: Heparin can be injected intravenously through a tail vein catheter or directly into the left ventricle. - After blood collection, euthanize the animal by exsanguination by cutting the abdominal vena cava and proceed with organ collection for further analysis.
- Save the signal in the file directory chosen at the beginning of the experiment. Transfer the images to the external hard drive by selecting the files in the computer folder and copy/paste the .bin files to an external hard drive.
4. Data analysis
NOTE: Check the routine code used in MATLAB to analyze the transducer signal for RVSP (Supplemental File 1). It was developed based on the needs of this research project.
- Open the program, click the browse for paste button (
 ) on the MATLAB screen, and select the file on the computer's internal hard drive that contains the appropriate code.
 - On the left corner of the MATLAB screen, observe the list of files that contain the codes for each channel recognized by the transducer.
- Choose the code for the channel configuration that was chosen at the beginning of the experiment to detect the signal (channel 6).
- Press the run button (
 ) and select the .bin file on the external hard drive to analyze.
CRITICAL STEP: In the bottom right corner, change the archive type from All MATLAB files to All Files, otherwise the .bin files will not appear. - Select the best area of the curve by clicking once at the beginning and once at the end. The best area is the one with the most homogeneous curves, with peaks and troughs visually equal (Figure 4A).
- Select 10 s of the curve by clicking once at the beginning (0 s) and once at the end (10 s) (Figure 4A).
NOTE: The X axis represents time in seconds and the Y axis represents pressure in mmHg. - Adjust the baseline by subtracting the lowest trough value in the command window and pressing ENTER on the keyboard. The software generates all the data automatically (Figure 4A).
- Observe the data presented in two columns; the first is the time of the peak and the second is the value of the peak (pressure).
NOTE: The curves obtained from the puncture represent the systolic (peak) and diastolic (trough) pressures of the RV. The MATLAB analysis presents both values. - Copy and paste the data of the systolic pressure into a .txt file and delete the values referring to time.
- Change all periods to commas in the .txt file to be able to obtain the average.
- Select 10 peak pressure values and average them.
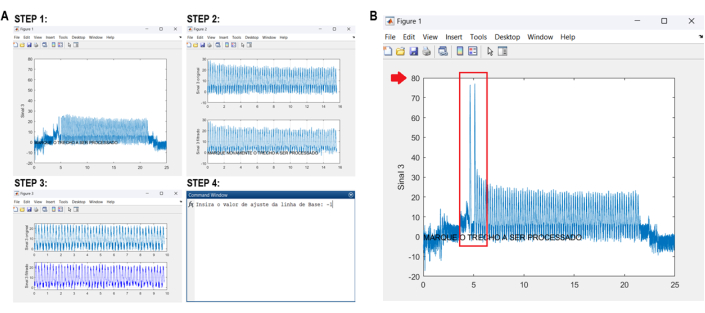
Figure 4: Right ventricular systolic pressure data analysis. (A) Representative images of the steps to select areas of the curve during the analysis. (B) Example of a curve shows a peak of approximately 80 mmHg, indicating that the puncture was deep enough to reach the left ventricle. After smoothly pulling back, it reached the right ventricle cavity. It is possible to see in the curve that appears on the first step. Please click here to view a larger version of this figure.
5. Right ventricular hypertrophy index
- Procedure
- At the beginning of the experimental protocol, measure the animal's body weight.
- After measuring the RVSP, euthanize the animal by exsanguination and remove the organs from the thoracic cavity en bloc to separate the heart of the euthanized animal.
- Dissect the vessels at the base of the heart (aorta, pulmonary artery, vena cava, and pulmonary veins).
CRITICAL STEP: Be careful to avoid dissecting the right and left auricles. - Dry the heart with gauze and record the weight of the dry whole heart measured on the precision balance.
- Dissect the left and right atriums and discard them.
- Separate the RV from the LV associated with the S.
- Dry each component dissect with gauze and record the weight of the RV and LV + S separately measured on the precision balance.
- Data analysis
- Calculate the right ventricular hypertrophy index as Fulton's index, which allows for assessment of RV hypertrophy by comparing the weight of the RV free wall with the weight of the LV + S walls corrected by the body weight:

NOTE: Fulton's index in control animals, up to 0.4 mg; Fulton's index in animals with PAH, >0.4 mg.
- Calculate the right ventricular hypertrophy index as Fulton's index, which allows for assessment of RV hypertrophy by comparing the weight of the RV free wall with the weight of the LV + S walls corrected by the body weight:
Access restricted. Please log in or start a trial to view this content.
Results
For the statistical analyses, each variable was tested for normality and variance using the Shapiro-Wilk test. Data are presented as means ± standard deviation. The unpaired t test was used to compare particle concentrations in the control (CTRL) and pulmonary arterial hypertension (PAH) groups (p<0.05).
Echocardiographic alterations in the animal model of PAH
Figure 4 shows that the PAT/PET ratio was lower in animals with PAH (0.4...
Access restricted. Please log in or start a trial to view this content.
Discussion
PAH is a progressive disease characterized by excessive vascular remodeling, which promotes an increase in pulmonary vascular resistance, resulting in augmented RV afterload14. Accordingly, the RVSP represents a functional variable that directly correlates with the severity of PAH15. Over time, the adaptive response of the RV is compensatory concentric hypertrophy (measured by Fulton's index)16 and ventricular dilation (measured by RV outflow dia...
Access restricted. Please log in or start a trial to view this content.
Disclosures
The authors have no conflicts of interest to declare.
Acknowledgements
The authors thank Mr. André Benedito da Silva for support with the experiments, Ms. Verônica Cristina dos Santos Lima for animal care, and Ms. Lorna O'Brien for English grammar revision. This study was supported by the Rio de Janeiro State Research Foundation (FAPERJ E-26/202.766/2018, E-26/010.001488/2019).
Access restricted. Please log in or start a trial to view this content.
Materials
| Name | Company | Catalog Number | Comments |
|---|---|---|---|
| Reagents | |||
| Alcohol 70% | Montenegro | ALC70-001 | |
| Conductive gel | Mercor | CG-002 | |
| Saline solution (NaCl 0,9%) | BioPharma | SAL-009 | |
| Instruments | |||
| 19 G scalp vein set | Descarpack | SVS-19G | |
| Curved kelly forceps | ABC instrumentos cirurgicos | CKF-003 | |
| Kelly forceps | ABC instrumentos cirurgicos | KF-004 | |
| Needles (18, 22 and 26 G) | Descarpack | NDL-MIX | |
| Petri dish | GlassLab | PD-150 | |
| Razor blade | ABC instrumentos cirurgicos | RB-005 | |
| Scalpel | ABC instrumentos cirurgicos | SC-006 | |
| Scissors | ABC instrumentos cirurgicos | SCIS-007 | |
| Suture line | ABC instrumentos cirurgicos | SUT-008 | |
| Syringes (1, 3, and 5 mL) | Descarpack | SYR-135 | |
| Tracheostomy cannula | MedTech | TC-010 | |
| Tweezer | ABC instrumentos cirurgicos | TWZ-011 | |
| Drugs | |||
| Dextroketamine hydrochloride 5% | Cristália | DXT-005 | 87.5 mg/kg intraperitoneal |
| Isoflurane 1 mL/mL 240 mL | Cristália | ISO-240 | 2.5% inhalation solution |
| Lidocaine hydrochloride 1% | Cristália | LID-001 | 400 µL subcutaneous locally |
| Monocrotaline | Sigma-Aldrich | C2401 | 60 mg/kg intraperitoneal |
| Pancuronium bromide 2 mg/mL | Cristália | PAN-002 | 2 mg/kg intravenous |
| Sodium heparin 5000 IU/mL | Cristália | HEP-5000 | diluted 1:4 in 1 mL |
| Xylazine hydrochloride 2% | Syntec | XYL-002 | 12.5 mg/kg intraperitoneal |
| Equipment | |||
| GraphPad Prism 9 | GraphPad Software, Inc | GP9 | |
| Networked Multiparameter Veterinary Monitor LifeWindow 9x | Digicare Animal Health | LW9x | |
| LabView software | National Instruments, Corp. | LV-2019 | |
| MATLAB R2019a (Version) software | The MathWorks, Inc. | MATLAB-2019 | |
| Monitor and signal transducer | MedTech | MST-015 | |
| Precision scale | Sartorius | PS-020 | |
| R540 Mice&Rat Animal Anesthesia Machine | RWD Life Schience Co.,LTD | R540-ANA | |
| Scale | Ohaus | SCL-025 | |
| Servo-i mechanical ventilator | Getinge AB | SERVO-I | FiO2 = 21%; tidal volume = 8 ml/kg, respiratory rate = 70 bpm, and PEEP = 3 cmH2O |
| SonoView software | SONOTEC Ultraschallsensorik Halle GmbH | SV-2020 | |
| UGEO HM70A system | Samsung Eletrônica da Amazônia LTDA | HM70A | |
| G*Power 3.1.9.7 | University of Düsseldorf, Germany | gpower |
References
- Gomez-Arroyo, J. G., et al. The monocrotaline model of pulmonary hypertension in perspective. Am J Physiol Lung Cell Mol Physiol. 302 (4), L363-L369 (2012).
- Zhu, Z., et al. Echocardiographic assessment of right ventricular function in experimental pulmonary hypertension. Pulm Circ. 9 (2), 2045894019841987(2019).
- Bikou, O., Sassi, Y. The sugen/hypoxia rat model for pulmonary hypertension and right heart failure. Methods Mol Biol. 2803, 163-172 (2024).
- Hill, N. S., Gillespie, M. N., McMurtry, I. F. Fifty years of monocrotaline-induced pulmonary hypertension: What has it meant to the field. Chest. 152 (6), 1106-1108 (2017).
- Santos, R. T., et al. Pharmacological agents and potential new therapies in pulmonary arterial hypertension. Curr Vasc Pharmacol. 22 (3), 155-170 (2024).
- Tsai, J., Malik, S., Tjen, A. L. S. C. Pulmonary hypertension: Pharmacological and non-pharmacological therapies. Life (Basel). 14 (10), 1265(2024).
- Suen, C. M., et al. Regenerative cell therapy for pulmonary arterial hypertension in animal models: a systematic review. Stem Cell Res Ther. 10 (1), 75(2019).
- Hubrecht, R. C., Carter, E. The 3Rs and humane experimental technique: Implementing change. Animals (Basel). 9 (10), 754(2019).
- Thibault, H. B., et al. Noninvasive assessment of murine pulmonary arterial pressure: validation and application to models of pulmonary hypertension. Circ Cardiovasc Imaging. 3 (2), 157-163 (2010).
- Trittmann, J. K., et al. PATET ratio by Doppler echocardiography: noninvasive detection of pediatric pulmonary arterial hypertension. Pediatr Res. 92 (3), 631-636 (2022).
- Percie du Sert, N., et al. The ARRIVE guidelines 2.0: updated guidelines for reporting animal research. J Cereb Blood Flow Metab. 40 (9), 1769-1777 (2020).
- Lisboa Braga, C., et al. Therapeutic effects of hypoxia-preconditioned bone marrow-derived mesenchymal stromal cells and their extracellular vesicles in experimental pulmonary arterial hypertension. Life Sci. 329, 121988(2023).
- Heil, L. B. B., et al. The effects of short-term propofol and dexmedetomidine on lung mechanics, histology, and biological markers in experimental obesity. Anesth Analg. 122 (4), 1015-1023 (2016).
- Humbert, M., et al. ESC/ERS Guidelines for the diagnosis and treatment of pulmonary hypertension. Eur Heart J. 43 (38), 3618-3731 (2022).
- D'Alto, M., et al. Right heart catheterization for the diagnosis of pulmonary hypertension. Heart Fail Clin. 14 (3), 467-477 (2018).
- Fulton, R. M., Hutchinson, E. C., Jones, A. M. Ventricular weight in cardiac hypertrophy. Br Heart J. 14 (3), 413-420 (1952).
- Lang, R. M., et al. Recommendations for cardiac chamber quantification by echocardiography in adults: an update from the American Society of Echocardiography and the European Association of Cardiovascular Imaging. Eur Heart J Cardiovasc Imaging. 16 (3), 233-270 (2015).
- Stenmark, K. R., Meyrik, B., Galie, N., Mooi, W. J., McMurtry, I. F. Animal models of pulmonary arterial hypertension: the hope for etiological discovery and pharmacological cure. Am J Physiol Lung Cell Mol Physiol. 297 (6), L1013-L1032 (2009).
- Mukherjee, M., et al. Guidelines for the echocardiographic assessment of the right heart in adults and special considerations in pulmonary hypertension: Recommendations from the American Society of Echocardiography. J Am Soc Echocardiogr. 38 (3), 141-186 (2025).
- Spyropoulos, F., et al. Echocardiographic markers of pulmonary hemodynamics and right ventricular hypertrophy in rat models of pulmonary hypertension. Pulm Circ. 10 (2), 2045894020910976(2020).
- Rajaram, S., et al. Comparison of the diagnostic utility of cardiac magnetic resonance imaging, computed tomography, and echocardiography in assessment of suspected pulmonary arterial hypertension in patients with connective tissue disease. J Rheumatol. 39 (6), 1265-1274 (2012).
- Chin, K. M., et al. Association of N-terminal pro brain natriuretic peptide and long-term outcome in patients with pulmonary arterial hypertension. Circulation. 139 (21), 2440-2450 (2019).
Access restricted. Please log in or start a trial to view this content.
Reprints and Permissions
