This protocol outlines advanced material fabrication and ex vivo rat heart methods for optical and electrical bidirectional biointerfacing, enabling precise cardiac stimulation, recording, and infarction modeling for bioelectronics research.
Method Article
Bidirectional Electrical and Optoelectronic Interfaces in Healthy and Ischemic Ex Vivo Rat Hearts
* These authors contributed equally
In This Article
Summary
Abstract
Electrophysiological studies are pivotal in exploring interactions between materials and cardiac biointerfaces. Recent advancements have introduced various novel conductor and semiconductor materials for bidirectional interfaces with cardiac models, facilitating low-intensity pacing alongside high spatiotemporal and high signal-to-noise ratio (SNR) recordings. The ex vivo rodent heart model serves as an effective platform for validating the functionalities of new materials and devices, bridging in vitro findings to translational insights while minimizing ethical and administrative concerns. In this protocol, we detail the isolation and ex vivo perfusion of adult rat hearts using a Langendorff apparatus, establishing precise bidirectional stimulation and recording with high-performance semiconductors and conductors, including nanoporous silicon, nanoporous carbon, and flexible mesh-like microelectrode arrays. Additionally, we present a myocardial infarction model induced by ischemia-reperfusion (I/R) injury, assessed through multichannel recording and mapping as well as infarct staining, enabling cardiac disease-relevant studies and potential therapeutic explorations. This methodology offers valuable insights into materials-bio interface research and the development of next-generation cardiac bioelectronics.
Introduction
The field of cardiac bioelectronics is advancing rapidly, driven by the need to develop materials and devices that enable precise and efficient bidirectional communications with the heart1,2,3,4. Electrophysiological studies play a pivotal role in this endeavor, providing critical insights into how materials interact with cardiac biointerfaces through modulation and sensing. While in vitro models, such as cultured HL-1 cell lines and primary cardiomyocytes from rodents, offer a controlled environment for initial assessments5,6,7,8, their simplicity often fails to replicate the complex, dynamic conditions of a living heart. These models lack the heart's 3D architecture, crucial for coordinated electrical conduction and mechanical force generation, and cannot mimic rhythmic contraction-relaxation cycles or perfusion dynamics critical for oxygen and nutrient delivery9. Conversely, in vivo models provide the most physiologically relevant insights but come with significant ethical, administrative, and technical challenges, including the need for extensive training, sophisticated surgical setups, and compliance with stringent regulatory frameworks10.
To bridge this gap, ex vivo heart models, such as the Langendorff-perfused adult rat heart, offer a compelling alternative to scientific research11,12. These models combine the physiological relevance of in vivo systems with the controllability and accessibility of in vitro setups. By isolating the heart and maintaining it in a functional state, the Langendorff apparatus enables researchers to conduct high-fidelity studies on cardiac electrophysiology under precisely controlled conditions. The absence of systemic variables such as neural inputs and circulating hormones simplifies the interpretation of results while preserving key aspects of cardiac physiology. Additionally, ex vivo models mitigate many ethical concerns and reduce resource burdens, making them a versatile and practical platform for translational research13.
In addition to its translational potential, this protocol sets a benchmark for material performance evaluation. By incorporating representative material strategies, such as optoelectronic platforms for wireless photostimulation and electronic systems for wired stimulation and recording, it establishes a reproducible framework for comparative studies. This standardization not only facilitates innovation but also enhances the reproducibility and reliability of findings across research groups. In the past, many high-performance photoelectrodes and electrodes have shown great promise for bioelectrical studies, such as PEDOT: PSS14, MXene15, iridium oxides16, platinum17, molybdenum18, silicon19,20,21, quantum dots22,23,24, and organic semiconductors25. Here, this protocol presents representative and state-of-the-art materials, including nanoporous silicon26, nanoporous carbon27, and flexible mesh-like gold multielectrode arrays (MEAs)28,29, integrating into the protocol to demonstrate their capabilities in bidirectional cardiac interfaces. These materials enable low-intensity suprathreshold stimulation, high spatiotemporal resolution, and high SNR recordings, showcasing their potential for advancing cardiac bioelectronics. Moreover, the inclusion of a myocardial infarction model induced by I/R injury provides a robust framework for disease-relevant studies and therapeutic explorations.
This work presents detailed methods for fabricating and applying advanced materials for leadless photostimulation and electrical stimulation and sensing with ex vivo rat hearts (Figure 1A). Nanoporous silicon membranes were fabricated through photolithography patterning, reactive ion etching (RIE), and buffered hydrofluoric acid (HF) release from silicon-on-insulator (SOI) wafers with a 5 µm device layer, followed by stain-etching and transfer to soft Polydimethylsiloxane (PDMS) membranes26. For electrical stimulation and recording, nanoporous carbon was developed by laser ablation of salt-incubated cellulose substrates, followed by water-phase transfer and heat lamination, offering improved charge storage and injection capabilities compared to traditional gold electrodes27. Additionally, flexible MEAs were fabricated on polyimide-coated Si wafers using photolithography, e-beam metallization, etching, encapsulation, and release processes to enable spatially resolved epicardial recording and mapping28,29.
Beyond fabrication, the protocol provides a step-by-step protocol for adult rat heart isolation, perfusion, monitoring, and interfacing with optical and electrical devices. The devices were tested on isolated hearts, demonstrating representative results in pacing and recording for electrophysiological evaluation. This protocol also introduces a method for creating a myocardial infarction model through I/R, validated by physiological recordings, staining, and morphological evaluations. This comprehensive methodology establishes a reproducible framework for evaluating materials and devices in cardiac biointerfaces. Figure 1B-D outlines the workflows of materials fabrication for evaluation in this ex vivo cardiac model. Figure 2A-C demonstrates the expected results in pictures of the as-fabricated devices.
Protocol
All animal procedures were approved by the Institutional Animal Care and Use Committee of the University of Chicago (protocol number 72378).
1. Nanoporous silicon membrane fabrication (Figure 1B, Figure 2A, Figure 3)
- Design the photomask pattern in AutoCAD software (Figure 3). Ensure the device size matches the length scale of the biological target. For the rat heart, use a device size of 2 - 10 mm. In the design, add small hole arrays of 20 - 100 µm diameter to facilitate the release of Si device layer in buffered HF. Make the three large holes of 200 - 1000 µm diameter, forming a chiral letter L to help identify the correct side of the membrane.
- Clean the SOI wafer with acetone and isopropyl alcohol (IPA) for 3 min each in the ultrasonic bath. Perform dehydration baking at 200 °C for 20 min on the hot plate.
- Spin coat the thick positive resist AZ40XT-11D at 3000 rpm for 45 s, baking at 115 °C for 3 min. Be careful not to pour too much photoresist on the wafer. After the spin coating, clean up the residues on the backside of the wafer using acetone swabs.
NOTE: AZ40XT-11D is a very viscous positive photoresist. - Use the Heidelberg MLA150 direct writer to expose the photoresist pattern at 375 nm and a dose of 800 mJ/cm2. Perform the post-exposure baking at 110 °C for 2 min.
- Develop the pattern in AZ 300MIF developer for 2 min. Rinse the wafer with deionized (DI) water for 60 s and then dry with N2 air.
- Etch the uncovered SOI using an SF6/CHF3 (20 sccm:50 sccm) RIE process for 12 min using inductively coupled plasma at 600 W and a radiofrequency of 60 W in an inductively coupled plasma fluoride etcher with a chamber pressure of 10 mT, resulting in an etching rate of about 660 nm/min.
- Strip the photoresist using AZ NMP in an 80 °C ultrasonic bath for 10 min and clean the wafer in an ultrasonic bath for 3 min in acetone, followed by 3 min in IPA, and dried using compressed nitrogen.
- Immerse the sample in buffered HF at room temperature to eliminate buried oxide layers. The device releases in 4 - 8 h. Slightly increase the solution temperature (40 °C) to facilitate the release.
- Carefully transfer the released membranes with 1 cm x 1 cm filter paper to two separate DI water baths sequentially to remove any residual HF.
NOTE: Experiment can be paused here. Soak the membrane in an IPA bath for storage at 4 °C. - Transfer the membrane using filter paper to a Petri dish with deionized (DI) water. The membrane will float on the water surface due to hydrophobicity and surface tension.
NOTE: Silicon membranes can move rigorously from IPA to water due to the Marangoni effect30. - In a separate Petri dish, make the stain-etching solution containing a 100:1 volume ratio of concentrated HF and concentrated nitric acid (e.g., 10 mL of HF and 0.1 mL of HNO3). Mix it well before etching.
- Transfer the membrane with filter paper to the stain-etching solution and etch for 30 s. Pay attention to the side of the Si membrane by noting the letter L orientation formed by the three major holes. The Si membrane should float on the etchant, where only one side of the membrane is etched.
- Transfer the membrane with filter paper to two separate DI water dishes to wash away the residue HF.
NOTE: The experiment can be paused here. Transfer the membrane to IPA for storage at 4 °C. - Make a supporting substrate with thin PDMS. Mix part A (base polymer) and part B (curing agent) at a weight ratio of 10:1 and degas for 30 min.
- Spin coat PMMA (495 A6) sacrificial layer on glass slide at 2,000 rpm for 45 s. Bake at 180 °C for 60 s.
- Spin coat PDMS at 4,500 rpm for 45 s on the PMMA-coated glass, which should result in 10 - 20 µm thickness. Cure in 80 °C oven or hot plate for 2 h.
NOTE: To mitigate mechanical damage, PDMS was used as a soft substrate for accommodating the nanoporous silicon membranes, providing protection against potential damage from direct handling with tweezers. - Transfer the stain-etched Si membrane from IPA to PDMS. Use clean tissue to remove the excess IPA, and the Si membrane will attach firmly to PDMS after the IPA evaporates. Pay attention to the side of the Si membrane by identifying the letter L orientation formed by the three major holes. The etched porous Si should face outside, and the unetched Si should interface with PDMS.
- Cut the PDMS circumferentially using a razor blade that contains the Si membrane. Leave sufficient space and be careful not to damage the Si membrane.
- Soak the device in acetone until the Si/PDMS is released. Avoid soaking for too long, as it may cause PDMS swelling. Rinse it with DI water and dry it with N2. Perform O2 plasma treatment at 400 W for 10 min.
2. Flexible microelectrode arrays fabrication (Figure 1C, Figure 2B, Figure 4)
- Design the structure of flexible MEAs in AutoCAD (Figure 4). We introduce two different designs featuring the same electrode projection area but different substrate structures (Figure 2B, Figure 4).
- Clean the silicon wafer substrate in acetone and IPA for 3 min each in an ultrasonic bath.
NOTE: This protocol does not require additional surface treatment to enhance adhesion between polyimide (PI) and Si wafer to facilitate device release. Oxygen plasma treatment can be used to enhance adhesion if needed. - Pour 4 mL of the PI precursor solution of poly (pyromellitic dianhydride-co-4,4′-oxydianiline) on the wafer. Spin coat the wafer at 1,500 rpm for 45 s. Use NMP or acetone to remove the precursor on the backside of the wafer.
- Pre-bake at 110 °C for 3 min, then at 180 °C for 3 min. Cure the PI-coated wafer in the resist oven with a profile mode. Start from room temperature, heat up to 250 °C at the ramp rate of 4 °C/min, and hold for 30 min. Then heat the wafer to 350 °C at the ramp rate of 2.5 °C/min, and keep at 350 °C for 60 min, then slowly cool down to RT. The result is a PI film of approximately 5 µm in thickness.
- Spin coat the PI-coated wafer with AZ nlof 2020 at 2,000 rpm for 45 s. Bake the wafer at 110 °C for 2 min. Use the Heidelberg MLA150 direct writer to expose the photoresist pattern at 375 nm and a dose of 200 mJ/cm2.
- Perform the post-exposure baking at 110 °C for 2 min. Develop the pattern in AZ 300MIF Developer for 1 min. Rinse the wafer with DI water for 60 s and then dry with N2 air.
- Deposit 10 nm of Titanium and 200 nm of Gold using an e-beam evaporator. Strip the photoresist using AZ NMP in 80 °C bath for 3 h and clean the wafer in an ultrasonic bath for 3 min in acetone, followed by 3 min in IPA and dried using compressed nitrogen.
- Spin coat the thick positive resist AZ40XT-11D at 3,000 rpm for 45 s. Clean the photoresist on the backside of the wafer using acetone. Bake the wafer at 115 °C for 3 min.
- Use the Heidelberg MLA150 direct writer to expose the photoresist pattern at 375 nm and a dose of 800 mJ/cm2. Perform the post-exposure baking at 110 °C for 2 min.
- Develop the pattern in AZ 300MIF Developer for 3 min. Rinse the wafer with DI water for 60 s and then dry with N2 air.
- Etch the uncovered PI using an SF6/CHF3 (20 sccm:50 sccm) RIE process for 20 min with inductively coupled plasma at 600 W and a radiofrequency of 60 W in an inductively coupled plasma fluoride etcher with a chamber pressure of 10 mT.
- Strip the photoresist using AZ NMP in 80 °C bath for 10 min and clean the wafer with mild sonication for 3 min in acetone, followed by 3 min in IPA and dried using compressed nitrogen.
NOTE: Use low power ultrasonication to avoid the device detaching. Avoid sonication if the PI shows signs of detaching. - Process the wafer in a hexamethyldisilazane (HMDS) oven to apply HMDS treatment. Spin coat SU-8 2002 at 2,000 rpm for 45 s. This results in a SU8 thickness of approximately 2.5 µm.
- Bake the wafer at 95 °C for 20 min. Use the Heidelberg MLA150 direct writer to expose the photoresist pattern at 375 nm and a dose of 950 mJ/cm2.
- Bake the wafer at 95 °C for 12 min.
- Develop the pattern in SU-8 Developer for 1 min. Rinse it with IPA and DI water, and dry with N2 gas. If white stains appear on the wafer during the IPA rinse, soak the wafer in SU8 developer until white stains disappear.
- Perform a hard bake at 160 °C overnight. Use shorter bake times (~30 min) for acute experiments. Do not bake below 150 °C or over 200 °C. Peel off the flexible PI-supported flexible MEA from the substrate.
3. Nanoporous carbon fabrication ( Figure 1D, Figure 2C, Figure 5)
- Design the carbon film pattern in the design software (Figure 5).
NOTE: This method contains the fabrication protocol for two kinds of electrodes: nanoporous carbon-based stimulation electrode and sensing electrode. - Impregnate the filter paper in aqueous solutions of sodium borate (0.15 M, pH 9.4) for 1 h and then dry at 60 °C overnight (Figure 1D).
NOTE: Grade 1 Whatman filter paper primarily served as the representative fiber-based porous substrate. Sodium borate is incorporated into cellulose fibers after the impregnation and drying process. Salt acts as catalysts that facilitate photochemical carbonization under laser synthesis27. - Perform laser synthesis using a CO2 laser with pre-designed patterns (Figure 5A). Conduct patterning in raster mode with optimized parameters: power = 1.8 W; speed = 1.6 cm/s; points per inch = 1000.
- Prepare polyethylene terephthalate (PET) film with a thickness of 50 µm and clean the film with acetone and isopropyl alcohol (IPA) for 3 min each in the ultrasonic bath.
- Deposit 5 nm of Titanium and 100 nm of Gold using an e-beam evaporator. Apply the water phase transfer procedure to transfer the MEA onto the PET film (12.5 µm).
NOTE: Water-phase transfer was conducted using two consecutive processes: water-phase separation and capillary transfer. - Submerge paper substrates gradually in DI water for delamination during water-phase separation.
NOTE: The strain energy induced by cellulose swelling facilitated the separation of the carbon membrane from the supporting substrate in less than a second, causing it to float on the water surface. - Use the supporting substrate, e.g., PET film, for transferring the patterns in water medium during capillary transfer. Submerge the substrate in water and bring it in contact with one end of the desired carbon membrane to form a contact line (the transfer front). Then, hold the substrate by hand and move in a tilted or vertical direction at a low velocity.
NOTE: For hydrophobic supporting substrates, external force or O2 plasma treatment could be applied to assist in forming the contact line. - After transfer, apply approximately 20 µL of perfluorosulfonic acid (PFSA) polymer solution (with a concentration of ~5% in a mixture of lower aliphatic alcohols and water) to the carbon patterns and allow to dry under room temperature (23 °C) and pressure (1 atm) conditions for fixation.
- Secure the nanoporous carbon-based stimulation electrode by connecting it to a Cu wire using conductive silver adhesive. Encapsulate the exposed junction between the Cu wire and the electrode with silicone adhesive to ensure insulation and stability. After a curing for 3 h at room temperature, the stimulation electrode is ready for use. Experiment can be paused here.
- Design the carbon and MEA pattern in the AutoCAD (Figure 5B). Fabricate 4 x 4 microelectrode arrays on a 25 µm PI film using the standard photolithography procedure as described in step 2.
NOTE: The PI film can be created through PI precursor or by laminating commercial PI film on Si wafer using AZ2020 photoresist. The protocol for photolithography and metal deposition is the same as step 2. - Create a monolithic carbon membrane (2 cm x 2 cm) on a paper substrate after salt impregnation and laser writing, as in steps 3.1-3.3. Transfer the carbon pattern onto predesigned PET support film using a standard water-phase transfer method, as in steps 3.6-3.9.
- Apply a 10 wt% polyethylene-co-vinyl acetate (EVA) solution in hexane to the carbon pattern and wait for drying under room temperature (23 °C) and pressure (1 atm) conditions. Design and laser-cut a 10 µm-thick PET template (with an EVA coating on the underside) with 16 holes aligned to the MEA pattern, serving as the encapsulation layer.
- Align the MEA, PET encapsulation layer, and carbon membrane on the PET support. Press the assembly using a commercial hot laminator at a processing temperature of 120 °C for transfer and encapsulation.
- Cool the nanoporous carbon-enabled sensing electrode to room temperature, remove the residue, and rinse it with ethanol and water 3x before using it.
4. Rat heart isolation, perfusion, and monitoring (Figure 6)
- Prepare rats before heart extraction (Figure 6A). This protocol used male CD/SD rats of 3 to 4 months old, obtained from Charles River.
- Prepare N-2-hydroxyethylpiperazine-N'-2-ethanesulfonic acid (HEPES) Tyrode's Solution by dissolving the chemicals according to Table 1. Adjust pH to 7.2-7.4 with 2M NaOH. Pre-oxygenate by bubbling oxygen gas for 0.5-1 h and continue oxygenation until the end of the experiments.
- Place three tubes of Hanks' Balanced Salt Solution (HBSS, no calcium, no magnesium) on ice. Prepare clean surgical instruments (sharp scissors, bent scissors, two hemostats, sharp tweezers, two pairs of small tweezers).
NOTE: Surgery is not meant for survival, so sterility is not necessary. - Pick up adult CD/SD male rats weighing between 400 and 500 g from the animal facility. Administer 0.5 mL of heparin (1000 IU/kg) intraperitoneally into the lower abdomen. Use thick gloves to hold the rat for protection.
- Scruff the rat by its upper back, so that the abdomen is exposed. Hold the rat firmly, but without excessive force to not hurt the animal. Quickly and accurately inject the heparin solution. Wait for 20-30 min. Prepare Langendorff apparatus in the meantime.
NOTE: The rat can be anesthetized in advance to ensure the proper surgical procedure preparation step. - Prior to refilling HEPES Tyrode's Solution, wash the intravenous therapy (IV) bag with water and fully dry it to ensure the proper eventual composition. Fill the bag with pre-oxygenated HEPES Tyrode's Solution.
- Turn on the thermostat and water circulation in the Langendorff apparatus at 37 °C (Figure 6A). Prepare the cannula, suture, and place the Petri dish on the cold pack for tissue sectioning. Prime the cannula with ice-cold HBSS before sectioning.
- Prepare to perform rat thoracotomy (Figure 6B). Anesthetize the animal with isoflurane in a bell jar configuration. Put 8 to 10 mL of isoflurane in a 50 mL tube filled with a gauze pad. Enclose the animal with the open tube (with isoflurane) in a container.
- Observe the progress of anesthesia by testing the toe pinch reflex. Animals will be put under anesthesia and lose consciousness within 2-3 min. Transfer it to the surgical board immediately after it loses consciousness.
- Transfer the animal to the operating board. Put it on its back and place 5 mL of isoflurane in a 50 mL tube filled with a gauze pad over the rat's mouth. Confirm general anesthesia by pinching one of the paws. Continue only if no response was noted.
- Secure the upper and lower limbs to the surgical board. Make an incision (~ 5 cm) to open the rat's ribcage just below the chest. Carefully cut through the diaphragm to expose the heart and lungs.
- Cut through the ribs on both sides to fully open the ribcage to provide complete access. Secure the ribcage at the sternum using a hemostat. Hold the vena cava from below the heart using a hemostat. Remove the heart by cutting under the hemostat with bent blunt scissors as close to the bottom of the rib cage as possible.
- Transfer the heart to ice-cold HBSS. Minimize the duration of the step to prevent prolonged interruption of oxygen supply to the contracting heart.
- Prepare to perform Langendorff perfusion and monitoring. Fill the cannula and Petri dish completely with ice-cold HBSS. Ensure that no bubbles are present in the system.
- Transfer heart to the Petri dish prefilled with HBSS for sectioning. Using tweezers and scissors, remove lungs and other connective tissue (Figure 6C).
NOTE: Blunt dissection is recommended for the sectioning procedure to prevent any potential damage to the heart. For sectioning of adjacent tissues, use two scissors and carefully tear the tissue apart. - Locate the aorta by pressing on the heart and tracing the path of blood as it exits. Cut under the first ascending artery and cannulate the aorta if the aortic arch is preserved during extraction (Figure 6D). Secure the aorta to the cannula with a double knot.
NOTE: Avoid inserting the cannula too deeply to ensure the valve remains closed. Do not position the suture too low, as this may obstruct the coronary arteries. - Prime the Langendorff apparatus with pre-oxygenated working solution. Open the buffer flow and attach the canula to the apparatus (Figure 6E). Ensure no air bubbles are introduced. The heart begins contracting at this step.
NOTE: Initially, some buffer may splash from the ventricles, but excessive leakage is not expected. Adjust the suture as needed to prevent buffer leakage. No cardiac fibrillation will be observed in this step if the surgery and preparation are conducted properly. - Cut off the atria. Deflate the balloon before inserting it into the left ventricle, then fill it with water using the connected syringe.
- Connect BP-100 probes to the perfusion line and water-filled balloons to monitor perfusion and left ventricular pressure (LVP), respectively (Figure 6F).
NOTE: The BP-100 probes need calibration before use. Bubbles in the balloons need to be expelled to ensure the precise pressure sensing. - Monitor the HEPES Tyrode's buffer pressure and the baseline of LVP. Ensure the buffer pressure is maintained within the optimal range of 80-100 mmHg. Adjust the baseline LVP to approximately 20 mmHg by modifying the water volume injected into the balloon (Figure 6F).
- Connect ECG electrodes. Ground the cannula and position the electrode on the sides, top, or apex based on preference (Figure 6F).
- Amplify all signals (perfusion, left ventricular pressure, and ECG) using an IA-400D amplifier and interfaced with a computer using a digitizer with Clampex software (Figure 6F).
5. Myocardial infarction creation using IR process (Figure 6G, Figure 7)
- Fill the heated chamber with pre-warmed 37 °C HEPES Tyrode's buffer. Submerge the heart into the buffer within the heated chamber and adjust the stopcock to stop the buffer flow, inducing global ischemia. Adjust the duration of ischemia based on the specific goals of the experiment.
- Turn the stopcock to restore the buffer flow into the heart after 30 min of ischemia, initiating reperfusion. Allow reperfusion of the heart for 45 min before terminating the experiment for staining to assess infarction size (Figure 6G).
NOTE: The ischemia or reperfusion time is determined based on experimental objectives. - Verify successful ischemia induction by observing heart rate reduction and irregular ECG patterns (Figure 7A). Arrhythmia or ventricular fibrillation will be observed.
- Slowly administer 10 mL of 4 °C HBSS through the side port of the stopcock to arrest the heart. Remove the heart from the perfusion column, trim away any remaining atrial tissue, and place the heart in a tissue slicing matrix.
- Cover the matrix with transparent film and freeze the heart at -80 °C for about 8 min or until it reaches a marshmallow-like consistency. Remove the tissue slicing matrix from the freezer and insert razor blades to slice the heart into 2 mm-thick sections.
- Remove the tissue slices from the slicing matrix one by one and store them at -80 °C until they are needed for biochemical experiments.
- Perform infarct staining (Figure 7B). Incubate the heart slices in 10 mL of 1% w/v triphenyltetrazolium chloride (TTC) at 37 °C for 30 min.
- Transfer the tissue slice to 10% buffered formalin and allow it to fix at room temperature overnight. For the best results, remove the heart from formalin and image the tissue within 24 h. Minimize light exposure during this step to prevent degradation of the stain.
- Photograph the stained slice and use software such as ImageJ to estimate infarct size.
6. Establishing bidirectional optoelectrical interfaces between devices and heart tissue (Figure 8, Figure 9)
- Place the silicon optoelectronic membrane on the desired location for stimulation. Silicon membrane self-attaches to the epicardium with capillary force (Figure 8A). If attachment is difficult, use wet-tissue adhesives to help with attachment.
NOTE: Reducing the perfusion rate could reduce the amount of water on the heart surface, which facilitates the attachment. Once attached to the heart surface, the silicon membrane typically attaches to the pre-determined position during operation. - Connect the electrodes to the RHD systems or other electrophysiological platforms for data recording. The MEAs feature 16-channel I/O pads with a 0.5 mm pitch at one end, which are connected through a zero-insertion-force (ZIF) connector to an adaptor board. The adaptor board is then linked to the headstage through an Omnetics connector.
- Place the flexible MEAs on the ventricular surfaces of the isolated rat heart (Figure 8A). Place the MEAs within the window if using a window-shaped silicon membrane (Figure 8B).
- Program the 635 nm laser source with desired frequency (e.g., 4 Hz) and duty cycle (e.g. 0.4%, 1 ms pulse duration) using Transistor-Transistor Logic (TTL) signals. Focus the laser spot on the silicon membrane, with spot size around 1 mm. Wear protective laser safety goggles. Start with low intensity for focusing.
- Start the recording and stimulation protocol. Gradually increase the laser intensity until an uninterrupted override pacing is observed (Figure 8C).
NOTE: In this protocol's standards, it defines the threshold intensity to be which the laser enables 10 s of uninterrupted pacing. - Program the laser profile with different pulse durations to get intensity versus duration profile to benchmark the device performance (Figure 8D). The setup allows multichannel recording of ECG, TTL, and LVP (Figure 8E).
- Change the location of the silicon membrane or light spot location and repeat step 6.3-6.6 to study how different pacing locations affect paced waveforms and heart conduction (Figure 9A).
- Identify the paced QRS peaks from each recording site to construct the isochrone or activation delay map. Identify the earliest QRS peak and set that location as zero delay to plot the activation delay map (Figure 9B-C).
NOTE: While the activation delay map in sinus rhythm (without pacing) can serve as a reference, its pattern may vary significantly depending on heart conditions and MEA placement18,30. The results are more meaningful when a clear stimulation source, such as external pacing, is present.
7. Establishing bidirectional electrical interfaces between devices and heart tissue ( Figure 10)
- Connect stimulation electrodes (0.5 cm x 0.5 cm) in a two-electrode configuration, placing the working electrode on the left ventricular wall while the counter electrode is on the right ventricular wall.
- Deliver square current waveforms (e.g., 1 mA, 1 ms pulse duration) through a potentiostat until successful pacing (Figure 10A-B). Perform tests to obtain stimulation current vs. pulse duration and stimulation voltage vs. pulse duration plots to evaluate material stimulation efficacy (Figure 10C-D).
- Perform electrical recording using a 4 x 4 microelectrode array (2 mm spacing between electrodes) and recorded using a RHD USB interface board and RHD 16-channel input recording headstage. Record the signals at 10 kS/s in the 0.1-100 Hz bandwidth.
- Measure the noise of each recording electrode (Figure 10E). Calculate the SNR using the following equation (Figure 10F):
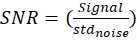 or
or 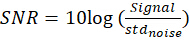
where Signal is signal amplitude and stdnoise is the standard deviation of noise levels. In the recording, the 60-Hz notch filter is off to reflect the raw results. - Perform additional analysis and plot isochronal maps of the electrical propagation using Python.
- Determine a timestamp of peak deflection (paced QRS complex) for each contraction and calculate the average for multiple signals. Use Gaussian interpolation for map rendering to improve readability.
Results
The stimulation electrophysiology of a wide range of optoelectronic and electronic materials can be efficiently validated using the ex vivo heart system, which provides a convenient and controlled setup (Figure 1A). High charge-injection materials such as porous silicon and porous carbon facilitate bioelectrical modulation with low optical intensity and low-voltage stimulation, ensuring safety and charge-balanced capacitive operation.
Nanoporous silicon exhibits significantly higher photocurrent generation compared to conventional silicon structures, such as p-n or p-i-n junctions (Figure 11A), due to its porosity-enabled heterojunction20, enhanced charge-storage capacity, reduced impedance, and improved optical absorption. These predominantly capacitive photocurrents enable biosafe, charge-balanced stimulation31 (Figure 12A-B), achieving optical pacing of ex vivo rat hearts at 240 bpm with a light intensity of 0.51 mW/mm2 and a pulse duration of 1 ms (Figure 8C), or as low as 0.167 mW/mm2 with a 10 ms pulse duration (Figure 11B) -- values comparable to or lower than optogenetic methods and well below laser safety thresholds31,32. Below these intensities, partial or non-capture of light pulses may occur. In contrast, other materials, such as p-i-n silicon membranes or gold-decorated p-i-n silicon membranes, require significantly higher optical intensities to elicit pacing (Figure 11B). Continuous pacing with nanoporous silicon increases mechanical contraction, as indicated by elevated LVP (Figure 8E). Furthermore, in its monolithic form, the device demonstrates high spatial-resolution photocurrent injection under localized light pulses, enabling multisite and potential random-access stimulation studies26.
In bidirectional, window-shaped silicon membrane studies (Figure 3D, Figure 8B), multisite stimulation produces distinct multielectrode recording profiles and heart conduction patterns, validating wave propagation originality from each stimulation point (Figure 9). This feature highlights the system's ability to analyze complex cardiac conduction pathways with high precision and the ability to diagnose abnormal heart conditions such as myocardial infarction.
The fabricated MEAs are approximately 10 µm thick, incorporating macroporous structures or serpentine interconnects to minimize bending stiffness and enhance flexibility or stretchability (Figure 4)33,34. The arrays consist of 16 independent recording sites arranged in a 4 x 4 configuration, covering a 6 mm x 6 mm area. These arrays enable direct epicardial signal recording at multiple sites on the heart surface. A representative 16-channel recording is illustrated in Figure 13. Isochrone maps constructed from the recordings visualize electrical conduction across the heart surface, with or without localized stimulation. Localized stimulation often induces delays in conduction that override the ex vivo heart's intrinsic sinus rhythm and conduction pathways (Figure 9B).
Nanostructured carbon materials present an effective solution to enhance bioelectronic device performance owing to their high charge storage capacity and low impedance (Figure 14). Our salt-assisted laser transfer method enables facile patterning and instant transfer of nanoporous carbon devices onto flexible substrates or traditional Au electrodes for enhancing bioelectronics performance. Impedance characterization further confirmed that the carbon coating substantially reduced the impedance of the Au electrode by approximately 2 orders of magnitude, from 7244.4 Ω to 63.1 Ω at 100 Hz frequency pertinent to ECG signals (Figure 14A-B). The Helmholtz capacitance of the Au electrode increased significantly after carbon coating, from 0.025 mF/cm2 to 1.98 mF/cm2 (Figure 14C). The increase in capacitance using this microcapacitor coating strategy can effectively lower the polarization voltage compared with the traditional Au electrode (Figure 14D).
This protocol establishes a nanoporous carbon-based platform for effective biointerfaces toward electrical modulation or sensing of cardiac systems (Figure 10). For evaluating the performance of nanoporous carbon electronics for cardiac stimulation, the Au or Au-C electrode was placed on the left ventricular (LV) wall for charge injection at biphasic square current waveforms35 (Figure 10A). Upon 4 Hz stimulation (1 mA), both Au and Au-C electrodes achieved effective overdrive pacing (Figure 10B). However, a notably higher ECG amplitude, indicative of contraction strength, was observed in the Au-C group. Both electrodes demonstrated an exponential decrease in the threshold current for stimulation with pulse duration. Stimulation thresholds, which indicate the lowest voltages for effective frequency modulation, were also measured across various pulse widths (Figure 10C-D). The strength-duration curve was modelled using the equation:

where I(t) refers to the stimulus current at the pulse duration (t), Irheobase is the threshold current at an infinitely long pulse duration (rheobase), and τ is the membrane time constant36. The calculation utilizes the minimum charge necessary for successful stimulation at chronaxie as 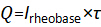 . Qmin. Values were determined as 0.79 and 0.71 µC for Au and Au-C electrodes, respectively (Figure 10C). At a stimulation current of 4 mA/cm2, threshold voltages for effective stimulation were observed at 1.32 V and 0.90 V for Au and Au-C electrodes, respectively (Figure 10D). The 30.3% reduction in threshold voltage suggests a potential decrease in oxidative stress during prolonged stimulation31, thus facilitating safer bioelectronics applications with minimal tissue damage. Additionally, a carbon-grafted 16-channel Au electrode was developed for enhanced epicardial ECG signal detection (Figure 10E-F). The nanostructured carbon transfer notably improved the signal-to-noise ratio by 8.0-fold compared to traditional Au electrodes, demonstrating the effectiveness of nanoporous carbon-based coatings for high-fidelity bioelectronics.
The successful induction of I/R infarction models was validated either on-site during the experiment or post-experimentally through physiological signal monitoring or TTC staining, respectively. Following slicing and staining, the infarcted heart will exhibit a white-colored region, representing myocardial damage and corresponding to the infarction size (Figure 7B). In contrast, a healthy heart will lack white regions after staining. During real-time monitoring, a successful ischemia model will display a significantly reduced heart rate, evident in LVP and ECG readings. Additionally, MEA mapping of the ischemic heart will reveal a decreased electrical conduction velocity across the epicardium, resulting in an increased delay time37 (Figure 7A).

Figure 1: Schematic illustration of the protocol and fabrication workflow. (A) Schematic illustration of the ex vivo rat heart setup and device interfacing. (B) Fabrication process of porous Silicon membrane (step 1). The fabrication of the porous Si membrane begins with an SOI wafer, where a photoresist layer is patterned via photolithography to define hexagonal features. RIE selectively removes exposed silicon, followed by a lift-off process in buffered HF to release Si membranes. The membrane undergoes stain-etching in an HF-based solution, generating a nanoporous Si structure. The resulting porous Si membrane is carefully detached and transferred onto a PDMS substrate for mechanical support. Finally, plasma treatment modifies the surface properties for enhanced photocurrents. (C) Fabrication process of flexible macroporous multielectrode arrays (step 2). The fabrication of flexible MEAs begins with PI coating on a silicon wafer to serve as the flexible substrate layer. Photopatterning is performed using AZ 2020 photoresist to define electrode areas. Metal deposition (Au/Ti) is carried out via e-beam evaporation to create conductive traces, followed by another photopatterning step using AZ 40XT-11D to protect selected regions from RIE to form macroporous substrate. A SU-8 photopatterning and hard bake step adds encapsulation before the final lift-off process releases the flexible MEA from the Si wafer. (D) Workflow of carbon membrane patterning and transfer (step 3), encompassing fiber processing via salt impregnation, microfabrication through laser synthesis, and water assisted pattern transfer from paper substrate to other supports. Figure 1D has been modified from27. Please click here to view a larger version of this figure.
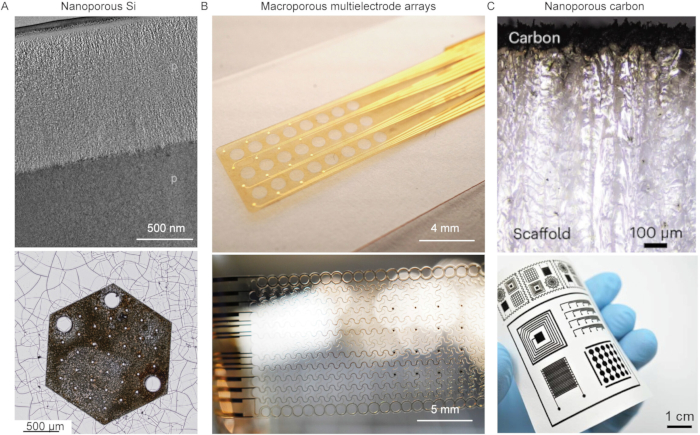
Figure 2: Optical and SEM images of the as-fabricated devices. (A) Cross-sectional SEM (top) and optical microscopic image (bottom) of nanoporous Si. (B) Optical images of macroporous multielectrode arrays with hollow (top) and serpentine (bottom) designs. (C) Cross-sectional optical microscopic image (top) and photo (bottom) of carbonized substrates. Figure 2A has been modified from26. Figure 2C has been modified from27. Please click here to view a larger version of this figure.
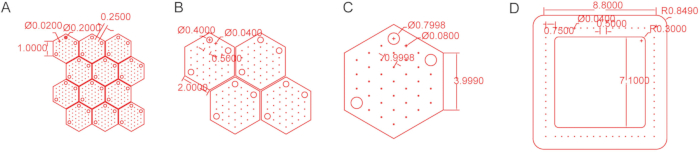
Figure 3: CAD designs of the Si membrane device. The figure details the parameters for (A) small, (B) medium, (C) large, and (D) open window-shaped silicon membrane devices. Unit: mm. This figure has been modified from26. Please click here to view a larger version of this figure.
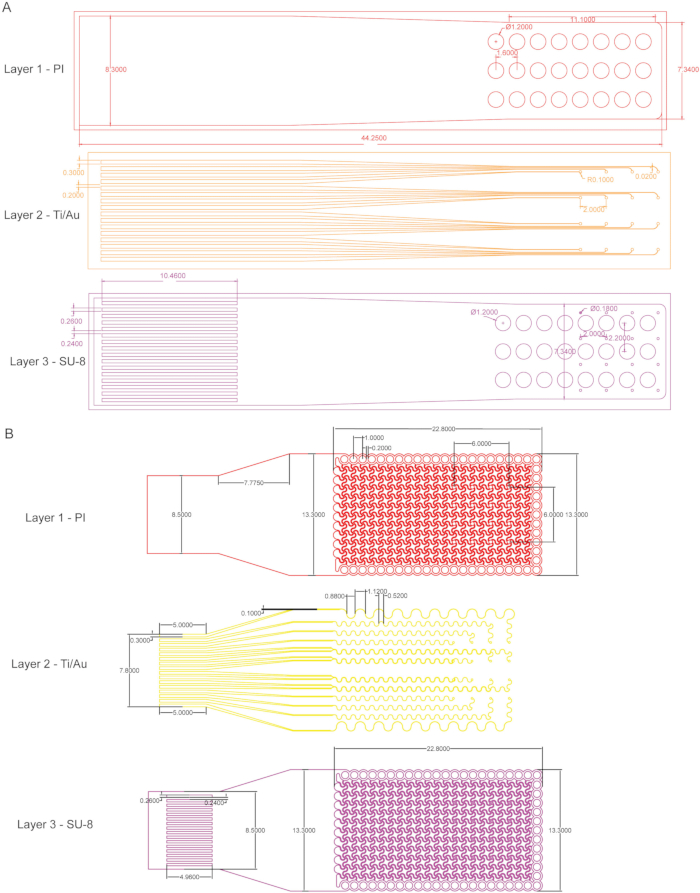
Figure 4: CAD design of the macroporous MEAs. (A) The design drawings and annotations for the hollow-shaped MEA. (B) The design drawings and annotations for the serpentine-shaped MEA. Unit: mm. Figure 4A has been modified from26. Figure 4B has been modified from28. Please click here to view a larger version of this figure.
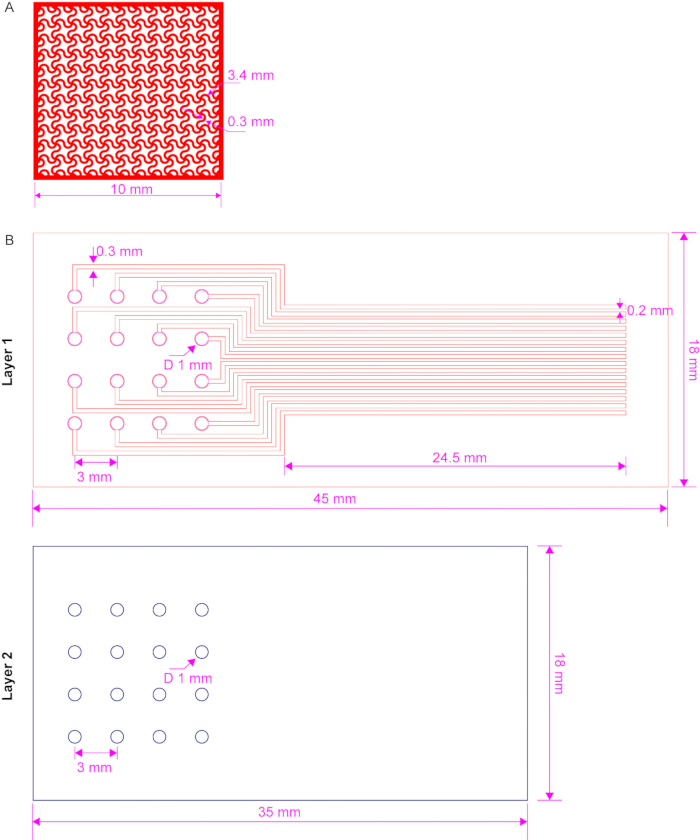
Figure 5: Schematics and designs of the carbon-based electrode arrays for heart interfacing. (A) Design for the stimulating electrode interfaces (step 3). During a typical stimulation, stimulation electrodes were connected in a two-electrode configuration. The working electrode (serpentine nanoporous carbon pattern) was placed on the left ventricular wall, while the counter electrode was placed on the right ventricular wall and connected to the ground. Square current waveforms were delivered through a potentiostat. (B) The 16-channel MEAs for carbon electrode masking and transfer (step 3). Layer 1 indicates the Au pattern of a 16-channel MEA on a PI substrate. Layer 2 indicates the PET encapsulation film. This figure has been modified from27. Please click here to view a larger version of this figure.
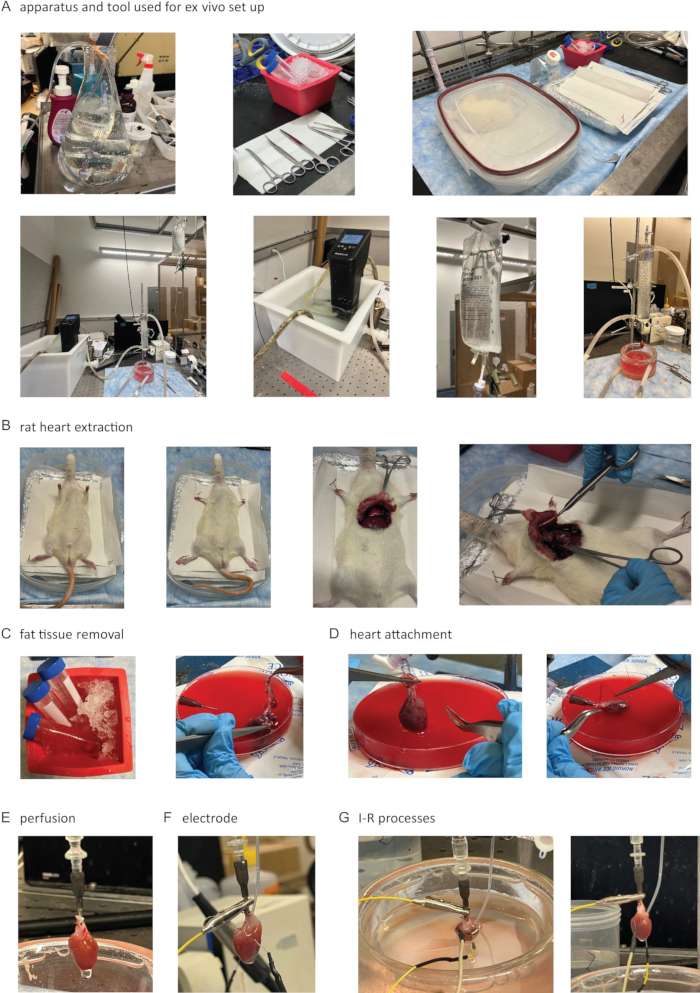
Figure 6: Schematic and photographic depiction of the ex vivo setup and experimental process. (A) Apparatus and tools used for ex vivo setup, including conical flasks containers, surgical instruments, perfusion systems, and temperature control systems (step 4). (B) Rat heart extraction process: Anesthetize the animal with isoflurane; Secure the rat's arms; open the rat's ribcage; harvest the rat heart. (C) Removal of surrounding fat tissue from the extracted heart to prepare it for the experimental setup. (D) Attachment of the extracted heart to the ex vivo perfusion system. (E) Perfusion setup showing the heart connected to the system to simulate physiological conditions. (F) Heart ECG recording set up. (G) Ischemia-reperfusion (I/R) processes are demonstrated through the setup (step 5). Please click here to view a larger version of this figure.
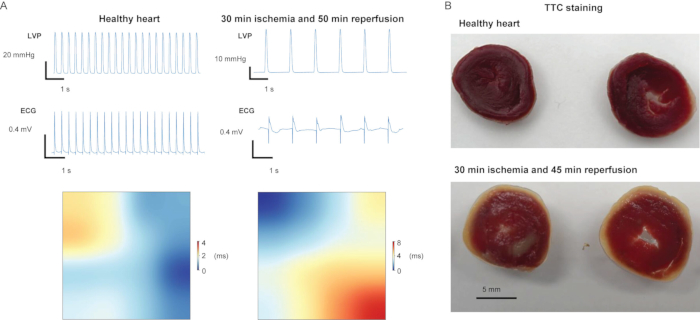
Figure 7: Comparison between healthy isolated heart and I/R heart. (A) LVP, ECG, and ECG propagation delays were recorded from sham healthy hearts, and ischemia/reperfusion (I/R) hearts. (B) Representative photographs of triphenyltetrazolium chloride (TTC)-stained healthy heart and I/R heart sections. The white area indicates the size of the infarcted area. Please click here to view a larger version of this figure.
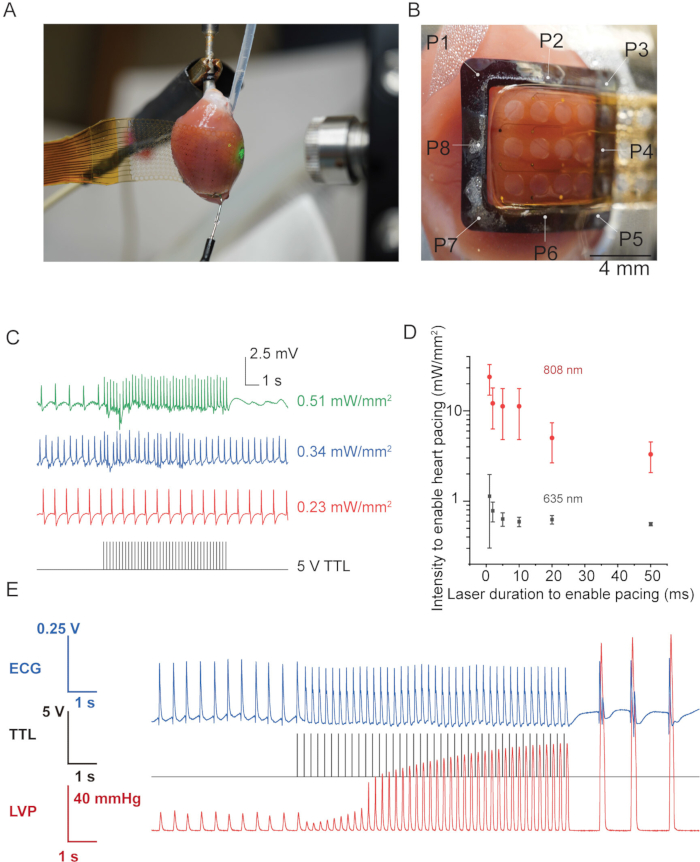
Figure 8: Bidirectional optoelectronic pacing and electrical recording of ex vivo rat heart using porous silicon membrane and flexible MEAs. (A) Photograph showing the attachment of the silicon membrane and placement of serpentine-shaped MEAs next to the silicon membrane on the heart. (B) Photograph showing the attachment of an open window-shaped silicon membrane and hollow-shaped MEAs fitted within the Si window. (C) Optical pacing on the ex vivo rat heart showing non-capture, partial capture, and full capture at three different intensities at 240 bpm, and 1 ms pulse duration. (D) Plot of intensity versus duration to evaluate pacing threshold of the device. (E) Optical pacing profiles under 0.24 mW/mm2 intensity and 10 ms pulse duration. Figure 8B-D have been modified from26. Please click here to view a larger version of this figure.
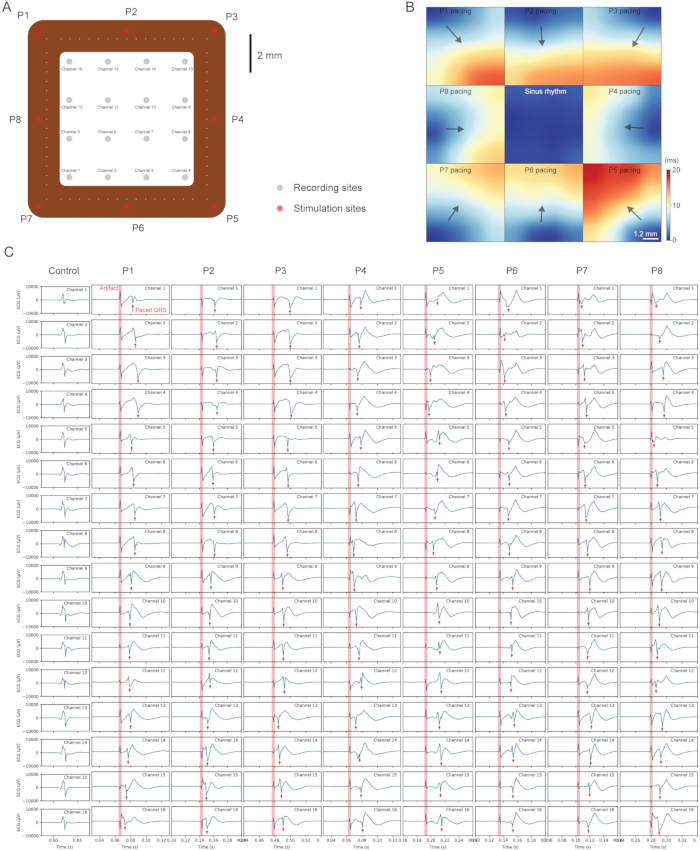
Figure 9: Multisite pacing and mapping in bidirectional interfaces. (A) Positions of pacing and recording sites. (B) Isochrone map shows electrical signal activation delay after photostimulation of eight different locations on an open-window-structured monolithic Si device. (C) The exemplary control and paced 16-channel ECG traces at different pacing locations. By stimulating various locations, spatial activation induced temporal delays in the QRS evolution detected at tissues at different recording sites. These can be depicted as an activation delay map, enabling the examination of conduction pathways on the heart surface. This figure has been modified from26. Please click here to view a larger version of this figure.
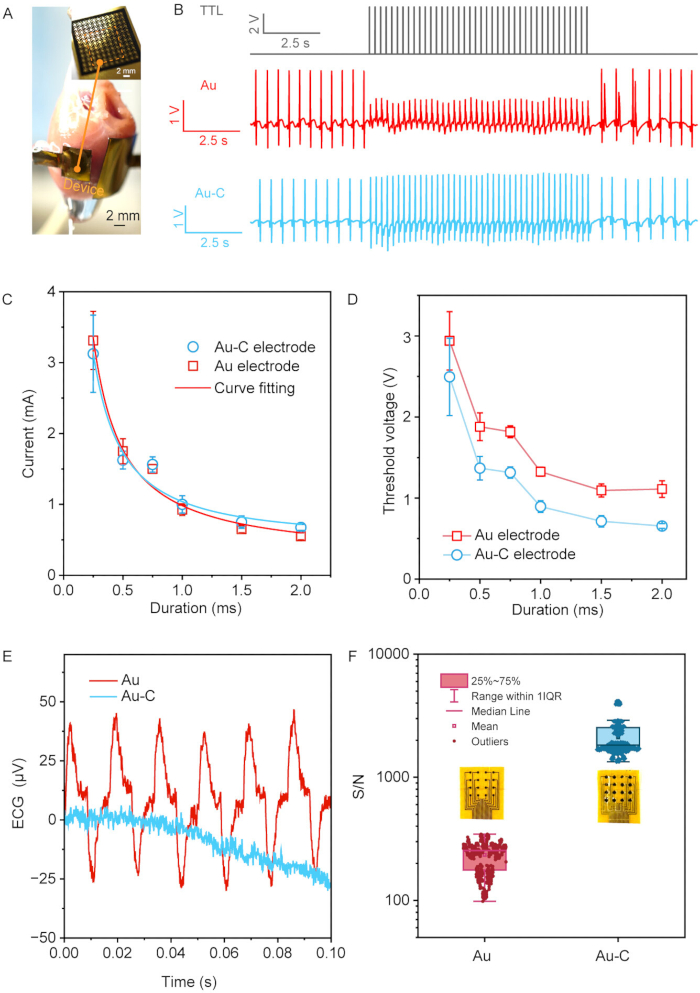
Figure 10. Nanoporous carbon-based bioelectronics for cardiac stimulation and recording. (A) Optical image of a porous carbon membrane-grafted Au (Au-C) electrode for heart stimulation. The inset image shows the enlarged view of a serpentine-structured microcapacitors on the Au electrode. (B) ECG response of isolated rat heart to biphasic, square current waveform stimulation at a frequency of 4 Hz. Under the same current density of 4.0 mA/cm2, the heart showed different ECG responses under stimulation from Au or Au-C electrodes. (C) The duration-strength curves of Au and Au-C stimulation electrodes and their curve fitting are present at a stimulation frequency of 4 Hz. (D) The threshold voltage applied to the electrodes for effective stimulation at different durations for Au and Au-C electrodes. (E) Baseline curves of ECG signals recorded with the Au electrode and the Au-C electrode devices. (F) The signal-to-noise (S/N) ratio is calculated from the recorded ECG curves. The inset figures show the optical images of the Au and the Au-C electrode array used for ECG recording (electrode size: 1 mm; step 7.5). This figure has been modified from27. Please click here to view a larger version of this figure.
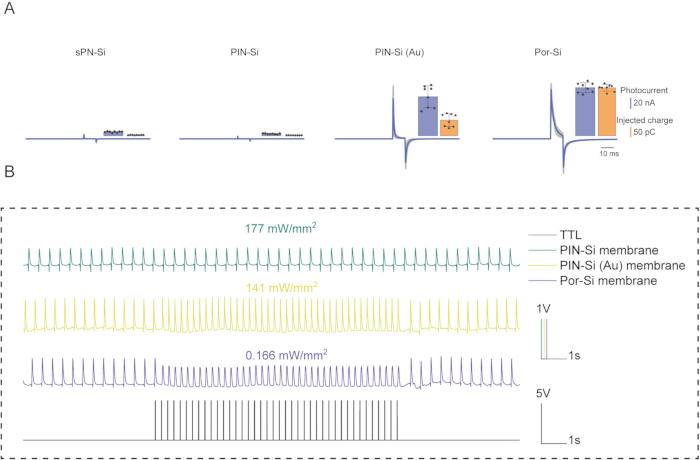
Figure 11: Photocurrents comparison for different Si devices and pacing threshold evaluation. (A) Comparison of photocurrent magnitudes across four Si-based devices. Blue traces represent the averaged photocurrents from N = 8 independent devices, and the overlaid grey traces illustrate individual device measurements. The accompanying bar graph shows peak photocurrent values (in blue) and integrated charge injections (in orange). Bar graphs are expressed as mean ± s.d. Scale bar, 10 ms. (B) Ex vivo heart pacing was performed using the three different devices. Pacing was conducted with a 240 b.p.m. rate and 10 ms pulse width. This figure has been modified from26. Please click here to view a larger version of this figure.
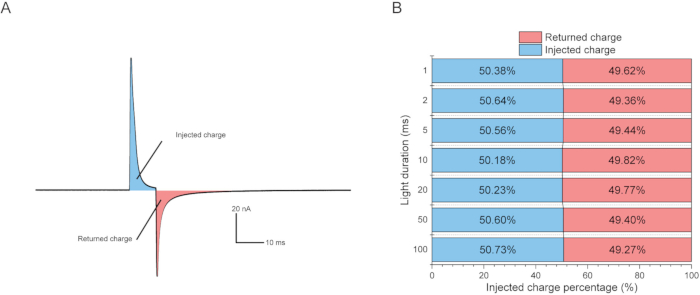
Figure 12: Characterization of charge-balance by integrating the injected and returned charge. (A) Illustration of the charge and discharge process in the characteristic photocurrent trace. (B) Calculation of total charges involved in charge injection and charge returning. The results showed overall a good charge balance under different stimulation durations. This figure has been modified from26. Please click here to view a larger version of this figure.
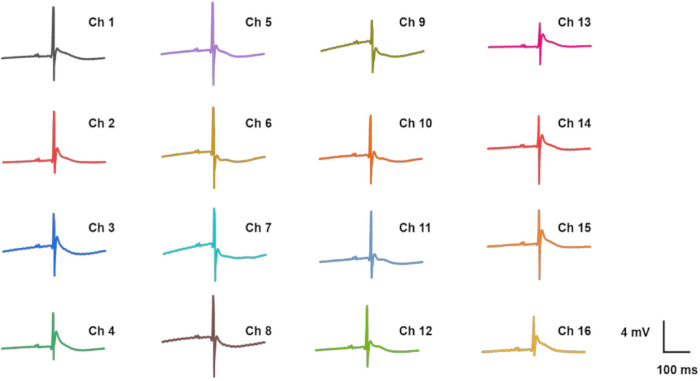
Figure 13: The representative electrical signals collected by each electrode in the 16-channel MEA. The electrical signals in 16 channels (Ch) show the electrocardiogram (ECG) information of the ex vivo beating heart. The figure has been modified from28. Please click here to view a larger version of this figure.
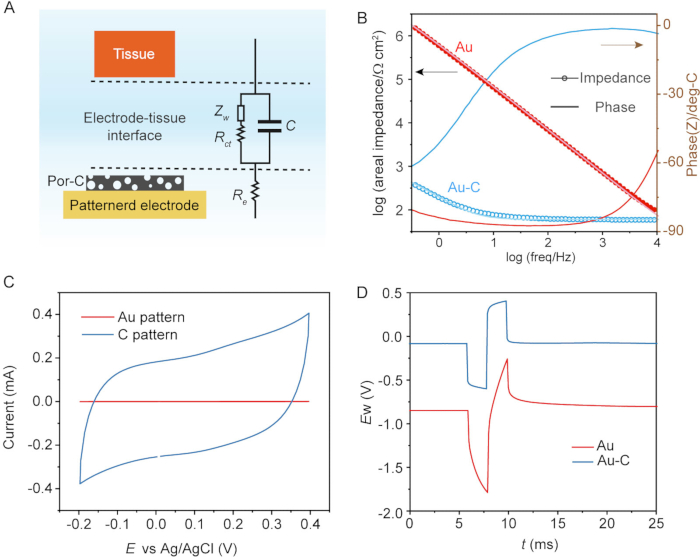
Figure 14. Electrochemical properties of nanoporous carbon-based bioelectronics. (A) The electrochemical interface between excitable tissues and patterned carbon interfaces. (B) Impedance and phase spectra of Au and Au-C electrodes with fitted curves according to the circuit displayed in A. (C) CV measurement of Au and C patterns with the same geometry, with a voltage range from -0.2 to 0.4 V vs a standard Ag/AgCl electrode. (D) Voltage changes of Au and Au-C electrode during a biphasic galvanostatic stimulation cycle. This figure has been modified from27. Please click here to view a larger version of this figure.
| Compound | Recommended variety | Conc. [mM] | MW | Per 1 L | Per 2 L |
| NaCl | Sigma (S9625) | 126 | 58.4 | 7.36 | 14.7 |
| KCl | Sigma (P4504) | 5.4 | 74.6 | 0.4 | 0.8 |
| Glucose | Sigma (G7021) | 10 | 180 | 1.8 | 3.6 |
| HEPES | Sigma (H4034) | 10 | 238 | 2.383 | 4.766 |
| MgCl2.7H2O | Sigma (M9272) | 1 | 203 | 1 mL | 2 mL |
| Stock 1 M | Stock 1 M | ||||
| CaCl2.2H2O | Sigma (C3881) | 2 | 147 | 1 mL | 2 mL |
| Stock 2 M | Stock 2 M | ||||
| NaH2PO4 | Sigma (S0751) | 0.39 | 120 | 1 mL | 2 mL |
| Stock 0.39 M | Stock 0.39 M |
Table 1: HEPES Tyrode's Solution Components.
Discussion
This protocol introduced the ex vivo rat heart platform (Figure 1A) and the I/R model to offer quick and convenient organ-level electrophysiology studies to accompany the fast-growing research efforts and demands in bioelectronics38. It detailed the fabrication and validation of three device systems, namely nanoporous silicon, flexible multielectrode arrays, and nanoporous carbon (Figures 1B-D), as the benchmark for bidirectional electrophysiological interrogations. Nanoporous silicon enables low-intensity, capacitive, and high spatiotemporal pacing, flexible multielectrode arrays enable multichannel recording and mapping of epicardial activities, and nanoporous carbon leads to low-voltage stimulation and high SNR recording when combined with MEAs27.
Optical pacing has been previously demonstrated using optogenetics, a method that requires genetic modification to express light-sensitive ion channels in target tissues33. While effective, optogenetics introduces significant complexity due to the need for viral vectors or transgenic approaches, raising safety, ethical, and regulatory concerns, particularly for clinical applications. In contrast, semiconductor-based, nongenetic biostimulation offers a simpler and more translationally viable alternative39,40,40,42. Materials like silicon and other organic semiconductors enable direct optoelectronic modulation of tissues without genetic alteration, leveraging capacitive photocurrents for biosafe and charge-balanced stimulation. This approach achieves comparable or even superior performance to optogenetics in terms of pacing intensity, operating well below laser safety thresholds to minimize tissue damage31,32 (Figure 8). The nongenetic nature of semiconductor-based biostimulation eliminates the barriers associated with genetic modification, paving the way for broader adoption in clinical settings and diverse applications in tissue engineering and bioelectronic medicine. However, the devices need to be carefully designed to integrate with the tissue, where biocompatibility needs to be carefully considered, as well as the place of interfacing for efficient stimulation and recording (Figure 8A-B). In addition, the presence of material on the tissue surface may impede the possibility of real-time imaging, unless a device can be engineered to be transparent to the excitation-emission window of certain imaging agents.
Nanoporous silicon stands out among semiconductor photostimulators as it does not require an artificial return electrode, unlike previously reported materials26. This unique property arises from its ability to form spatially resolved cathode and anode regions based on the light spot size and location. The illuminated surface serves as the cathodic injection site, while the surrounding peripheral regions facilitate anodic current return. This mechanism enables multisite stimulation on monolithic, pixel-less membranes, allowing for precise and localized stimulation. Notably, localized light stimulation, rather than global illumination, is critical for creating efficient bipolar stimulation profiles. Additionally, the device size significantly impacts performance; larger devices generate higher currents under the same stimulation conditions, further enhancing their functional versatility.
The failure of optical pacing can result from various factors, even in healthy biological models, primarily related to device integrity and biointerface coupling. First, thorough photocurrent characterization is critical before heart stimulation. Lower-than-expected photocurrents may arise from material degradation43 oxide passivation after prolonged storage, over-etching during the stain-etching process, device fractures during handling or transferring, or incorrect device orientation during interfacing. To mitigate mechanical damage, PDMS was used as a soft substrate for accommodating the nanoporous silicon membranes, providing protection against potential damage from direct handling with tweezers. Second, establishing a seamless interface with the epicardium, which is perfused with biofluids in this setup, is essential. A thick biofluid layer can impede proper attachment and compromise pacing efficacy. To enhance biointerface coupling, bioadhesives42,43 or suturing can be employed to stabilize the connection and ensure reliable stimulation. Notably, the nanoporous silicon used in our study is biodegradable, supporting temporary pacing applications but degrading in performance within 1-2 days under physiological conditions. For longer-term stability, surface passivation44 or the use of more durable semiconductor materials should be considered.
During ex vivo pacing, the gradual LVP increase (Figure 8E) at higher frequencies (e.g., 4 Hz) likely results from enhanced myocardial contractility, calcium accumulation, and the Frank-Starling mechanism45. Elevated pacing rates improve intracellular calcium cycling and ventricular filling dynamics, increasing preload and contraction strength46. While this may raise myocardial oxygen demand and arrhythmia risk, these effects can be mitigated by sufficient pre-oxygenation, close ECG monitoring, and controlled pacing parameters. In our experiments, no significant adverse effects were observed.
In multielectrode recording, specifying the electrode locations on the heart and their relative positions to the pacing electrode is crucial for meaningful analysis. It is essential to eliminate crosstalk between electrodes to ensure the capture of distinct waveforms and temporally resolved patterns. Flexible electrode arrays typically establish a good interface with the epicardium; however, adhesion can be further enhanced using ionically conductive adhesive coatings, such as thin hydrogel layers28,43 to improve stability and signal quality.
Nanostructured graphene/carbon materials, with large surface areas for charge storage and injection, can improve bioelectronic device performance by reducing impedance at electrode-saline junctions and increasing charge injection capabilities35. Current methods for patterning graphene materials onto flexible electrodes (e.g., Au) include electrodeposition, spin coating, and screen printing47. However, these methods are typically associated with complex fabrication processes, limited patterning capabilities, and reduced performance due to the dead volume of binders. A laser synthesis method was utilized to generate nanostructured carbon patterns onto cellulose substrate and then transfer them onto other soft films to create a compliant biointerface, which presents a facile and effective way for bioelectronics fabrication. The combination of patterned carbon coatings with small geometric sizes down to the single-cell level, which would increase the localized electrical field, and highly porous structures of carbon membrane to decrease resistance at the electrode-tissue interface, will synergistically achieve efficient biological stimulation and recording in the future48.
While it is a convenient disease model, the Langendorff ex vivo I/R model lacks systemic interactions, isolating the heart from neurohormonal and immune responses, and relies on artificial perfusion with buffers, which can alter physiological conditions such as oxygen delivery and endothelial function. Its limited viability confines studies to acute events. Nonetheless, the model offers a highly controlled environment with precise parameter adjustments and good reproducibility. It also enables real-time cardiac function measurement, making it a valuable tool for exploring novel therapeutic strategies for ischemic heart disease. For instance, electroceutical devices could be envisioned to precondition the heart, training it to endure severe reactive oxygen species (ROS) environments, or to mitigate ROS levels for enhanced recovery. The efficacy of such treatments could be evaluated through metrics like heartbeat patterns, ECG waveforms, and conduction velocity. Furthermore, a multisite stimulation platform could provide spatial information about myocardial infarction, enabling a more detailed assessment of the affected regions. This approach could also demonstrate improved stimulation thresholds, correlated with the severity of the infarction, offering a comprehensive framework for therapeutic evaluation and optimization.
While the protocol highlighted the use of the three devices in bidirectional ex vivo heart models, their applicability extends far beyond cardiac tissues. These devices can be readily adapted for use with other electrically excitable tissues or organs, such as neural tissues, skeletal muscles, and gastrointestinal systems, where precise electrical modulation is critical, making them versatile tools for both research and translational applications in bioelectronic medicine.
Disclosures
P.L. and B. T. filed a patent on the nanoporous silicon device fabrication and application. P.L., C. Y. and B. T. filed a patent on the nanoporous carbon device fabrication and application. P. L. and B.T. filed a patent on the flexible microelectron array fabrication and application.
Acknowledgements
This study was financially supported by the National Institute of Health through grant 1R56EB034289-01 and 1R01EB036091-01, and the US Army Research Office through grant W911NF-24-1-0053. P. L. is grateful for the support bestowed by the Grier Prize in Biophysical Sciences Innovation.
Materials
| Name | Company | Catalog Number | Comments |
|---|---|---|---|
| 16 Channel Headstage | Intan Technologies | C3334 | |
| 2,3,5-Triphenyltetrazolium chloride | Sigma Aldrich | T8877-5G | triphenyltetrazolium chloride |
| 2-Propanol (IPA) | Fischer Scientific | A451-4 | |
| 635 nm Laser, 500 mW | Laserglow | NA | |
| Acetone | Fischer Scientific | A18-4 | |
| Angstrom Evovac e-beam evaporator | Angstrom | NA | |
| AZ 300MIF Developer | Microchemicals | 18441123163 | Developer |
| AZ nlof 2020 | Microchemicals | 1A002020 | |
| AZ NMP | Microchemicals | NA | Photoresist remover |
| AZ40XT-11D | Microchemicals | 1000300 | Photoresist |
| Buffered HF | Thermo Scientific | AA44627K2 | |
| CaCl2.2H2O | Sigma Aldrich | (C3881) | |
| CO2 laser | Universal Laser Systems | VLS 4.60 | |
| Conductive silver paint | PELCO | 16062 | Conductive adhesion between electrode and connecting Cu wire |
| Copper wire encapsulated 0.1 mm | Amazon | https://www.amazon.com/Enameled-Temperature-Resistance-Transformers-Inductors/dp/ B09TNM51S5/ref=asc_df_B09 TNM51S5?mcid=155de761ea4 c389ea86d45ba61a83e8d&tag =hyprod-20&linkCode=df0&hvadid =693675076770&hvpos=&hvnetw =g&hvrand=664358781094905 4431&hvpone=&hvptwo=&hvqmt =&hvdev=c&hvdvcmdl=&hvlocint =&hvlocphy=9021716&hvtargid= pla-1878323158943&psc=1 | |
| Digidata 1550 digitizer | Molecular Devices | NA | |
| Glucose | Sigma Aldrich | G7021 | |
| HBSS, no calcium, no magnesium, no phenol red | Thermo Scientific | 14175095 | |
| Heidelberg MLA150 direct writer | Heidelberg | NA | |
| heparin (1000 IU/kg) | Sagent Pharmaceuticals | 1009655 | |
| HEPES | Sigma Aldrich | (H4034) | |
| Hexane | Sigma Aldrich | 52750-10ML | Solvent |
| HF | Fisher Scientific | A513-500 | Tracemetal grade |
| HMDS Vapor Prime Oven | Yield Engineering Systems | NA | |
| HNO3 | Fisher Scientific | A509P500 | Tracemetal grade |
| Hot laminator | Office Depot | L410-A | Multilayer encapsulation |
| Intan RHD systems | Intan Technologies | C3100 | |
| iWorx ECG | iWorx | IA-400D | |
| iWorx LVD probe | iWorx | BP-100 | |
| iWorx preamplifier | iWorx | C-ISO-256 | |
| KCl | Sigma Aldrich | (P4504) | |
| Latex Balloon (size 4) | Radnoti | 170404 | |
| MgCl2.7H2O | Sigma Aldrich | (M9272) | |
| NaCl | Sigma Aldrich | (S9625) | |
| Nafion 117 containing solution | Sigma Aldrich | 31175-20-9 | Fixing reagent for nanoporous carbon pattern |
| NaH2PO4 | Sigma Aldrich | (S0751) | |
| NaOH | Sigma Aldrich | 221465 | |
| PDMS | Fisher Scientific | NC9285739 | |
| Plasma-Therm inductively coupled plasma fluoride etcher | Plasma-Therm | NA | |
| PMMA (495 A6) | Microchemicals | M130006 | |
| poly (pyromellitic dianhydride-co-4,4'-oxydianiline) | Sigma Aldrich | 575801 | PI precursor |
| Poly(ethylene-co-vinyl acetate) | Sigma Aldrich | 437247-250G | Polymer for infiltration |
| Poly(vinyl alcohol) | Sigma Aldrich | 341584-25G | |
| Polyethylene terephthalate (PET) | Amazon | KS-6304-21-11 | Type D Clear PET Sheet .0005" Thick x 27" Width x 10 Ft Length 1 pc |
| Potentiostat | BioLogic | SP-200 | Electrical stimulation |
| resist oven | Despatch | LCC1-15-5 | |
| Scanning electron microscopy | Carl Zeiss | Merlin | Instrument for morphology characterization |
| silicon wafer | NOVA Electronic Materials | HS39626 | |
| Silicone adhesive | WPI | KWIK-SIL-S | Encapsulation |
| Sodium Borate | Sigma Aldrich | SX0355 | |
| SOI wafer | Ultrasil | 3-10541 | Type-Orient:P/B(100) DT:7+/-1um DR:<.005 Ohmcm HT:300+/-10um HR:1-30 Ohmcm Box:1um+/-5% UD-13998/UH-13962 |
| SU-8 2002 | Microchemicals | SU-8 2000 Series | |
| SU-8 developer | Microchemicals | SU-8 2000 Series | |
| Wet tissue adhesive | 3M | 1469SB | |
| Whatman qualitative filter paper, Grade 1 | Sigma Aldrich | WHA1001150 | Substrate for carbon patterning |
References
- Sunwoo, S. H., et al. Soft bioelectronics for the management of cardiovascular diseases. Nat Rev Bioeng. 2 (1), 8-24 (2024).
- Choi, H., et al. Adhesive bioelectronics for sutureless epicardial interfacing. Nat Elect. 6 (10), 779-789 (2023).
- Choi, Y. S., et al. Fully implantable and bioresorbable cardiac pacemakers without leads or batteries. Nat Biotech. 39 (10), 1228-1238 (2021).
- Cingolani, E., Goldhaber, J. I., Marbán, E. Next-generation pacemakers: from small devices to biological pacemakers. Nat Rev Cardiol. 15 (3), 139-150 (2018).
- Sala, L., Ward-van Oostwaard, D., Tertoolen, L. G. J., Mummery, C. L., Bellin, M. Electrophysiological Analysis of human Pluripotent Stem Cell-derived Cardiomyocytes (hPSC-CMs) Using Multi-electrode Arrays (MEAs). J Vis Exp. (123), e55587(2017).
- Fiegle, D. J., Volk, T., Seidel, T. Isolation of Human Ventricular Cardiomyocytes from Vibratome-Cut Myocardial Slices. J Vis Exp. (159), e61167(2020).
- Alam, P., Maliken, B. D., Ivey, M. J., Jones, S. M., Kanisicak, O. Isolation, Transfection, and Long-Term Culture of Adult Mouse and Rat Cardiomyocytes. J Vis Exp. (164), e61073(2020).
- Nippert, F., Schreckenberg, R., Schlüter, K. D. Isolation and Cultivation of Adult Rat Cardiomyocytes. J Vis Exp. (128), e56634(2017).
- Trayanova, N. A. Whole-Heart Modeling: Applications to Cardiac Electrophysiology and Electromechanics. Circ Res. 108 (1), 113-128 (2011).
- Yin, R. T., et al. Open thoracic surgical implantation of cardiac pacemakers in rats. Nat Protoc. 18 (2), 374-395 (2023).
- Wu, K., et al. Modifications of the Langendorff Method for Simultaneous Isolation of Atrial and Ventricular Myocytes from Adult Mice. J Vis Exp. (171), e62514(2021).
- Pendexter, C. A., et al. Modified Langendorff Perfusion for Extended Perfusion Times of Rodent Cardiac Grafts. J Vis Exp. (208), e66815(2024).
- Kałużna, E., Nadel, A., Zimna, A., Rozwadowska, N., Kolanowski, T. Modeling the human heart ex vivo-current possibilities and strive for future applications. J Tissue Eng Regenerat Med. 16 (10), 853-874 (2022).
- Jiang, Y. W., et al. Topological supramolecular network enabled high-conductivity, stretchable organic bioelectronics. Science. 375 (6587), 1411-1417 (2022).
- Driscoll, N., et al. MXene-infused bioelectronic interfaces for multiscale electrophysiology and stimulation. Sci Transl Med. 13 (612), eabf8629(2021).
- Gablech, I., Głowacki, E. D. State-of-the-Art Electronic Materials for Thin Films in Bioelectronics. Adv Elect Mater. 9 (8), 2300258(2023).
- Cho, Y. H., Park, Y., Kim, S., Park, J. 3D Electrodes for Bioelectronics. Adv Mater. 33 (47), 2005805(2021).
- Chen, Z., et al. bioresorbable, transparent microelectrode arrays for multimodal spatiotemporal mapping and modulation of cardiac physiology. Sci Adv. 9 (27), eadi0757(2023).
- Jiang, Y. W., et al. Rational design of silicon structures for optically controlled multiscale biointerfaces. Nat Biomed Eng. 2 (7), 508-521 (2018).
- Prominski, A., et al. Porosity-based heterojunctions enable leadless optoelectronic modulation of tissues. Nat Mater. 21 (6), 647-655 (2022).
- Huang, Y. X., et al. Bioresorbable thin-film silicon diodes for the optoelectronic excitation and inhibition of neural activities. Nat Biomed Eng. 7 (4), 486-498 (2023).
- Balamur, R., et al. Capacitive and Efficient Near-Infrared Stimulation of Neurons via an Ultrathin AgBiS2 Nanocrystal Layer. ACS Appl Mater Inter. 16 (23), 29610-29620 (2024).
- Karatum, O., Kaleli, H. N., Eren, G. O., Sahin, A., Nizamoglu, S. Electrical Stimulation of Neurons with Quantum Dots via Near-Infrared Light. ACS Nano. 16 (5), 8233-8243 (2022).
- Han, M., et al. Photovoltaic neurointerface based on aluminum antimonide nanocrystals. Comm Mater. 2 (1), (2021).
- Ejneby, M. S., et al. Chronic electrical stimulation of peripheral nerves via deep-red light transduced by an implanted organic photocapacitor. Nat Biomed Eng. 6 (6), 741-753 (2022).
- Li, P., et al. Monolithic silicon for high spatiotemporal translational photostimulation. Nature. 626 (8001), 990-998 (2024).
- Yang, C., et al. A bioinspired permeable junction approach for sustainable device microfabrication. Nat Sustain. 7 (9), 1190-1203 (2024).
- Shi, J., et al. Monolithic-to-focal evolving biointerfaces in tissue regeneration and bioelectronics. Nat Chem Eng. 1 (1), 73-86 (2024).
- Shi, J., et al. Active biointegrated living electronics for managing inflammation. Science. 384 (6699), 1023-1030 (2024).
- Zhang, L., et al. Marangoni Effect-Driven Motion of Miniature Robots and Generation of Electricity on Water. Langmuir. 33 (44), 12609-12615 (2017).
- Cogan, S. F. Neural Stimulation and Recording Electrodes. Ann Rev Biomed Eng. 10 (1), 275-309 (2008).
- Nussinovitch, U., Gepstein, L. Optogenetics for in vivo cardiac pacing and resynchronization therapies. Nat Biotechnol. 33 (7), 750-754 (2015).
- Hsueh, B., et al. Cardiogenic control of affective behavioural state. Nature. 615 (7951), 292-299 (2023).
- Tian, B. Z., et al. Macroporous nanowire nanoelectronic scaffolds for synthetic tissues. Nat Mater. 11 (11), 986-994 (2012).
- Fang, Y., et al. Micelle-enabled self-assembly of porous and monolithic carbon membranes for bioelectronic interfaces. Nat Nanotechnol. 16 (2), 206-213 (2021).
- Kay, G. N., Shepard, R. B. Stimulation and Excitation of Cardiac Tissues. Clin Cardiac Pacing Defibrillat Resynchronizat Ther. , 61-113 (2017).
- Zhang, J., et al. Gold-modified nanoporous silicon for photoelectrochemical regulation of intracellular condensates. Nat Nanotechnol. , (2025).
- Li, P., Kim, S., Tian, B. Beyond 25 years of biomedical innovation in nano-bioelectronics. Device. 2 (7), 100401(2024).
- Yang, C., Cheng, Z., Li, P., Tian, B. Exploring Present and Future Directions in Nano-Enhanced Optoelectronic Neuromodulation. Acc Chem Res. 57 (9), 1398-1410 (2024).
- Prominski, A., Li, P., Miao, B. A., Tian, B. Nanoenabled Bioelectrical Modulation. Acc Mater Res. 2 (10), 895-906 (2021).
- Li, P., Kim, S., Tian, B. Nanoenabled Trainable Systems: From Biointerfaces to Biomimetics. ACS Nano. 16 (12), 19651-19664 (2022).
- Majmudar, A., Kim, S., Li, P., Tian, B. Perspectives on non-genetic optoelectronic modulation biointerfaces for advancing healthcare. Med-X. 2 (1), 18(2024).
- Hwang, S. W., et al. A Physically Transient Form of Silicon Electronics. Science. 337 (6102), 1640-1644 (2012).
- Yu, Y., et al. Enhanced photoelectrochemical efficiency and stability using a conformal TiO2 film on a black silicon photoanode. Nat Ener. 2 (6), 17045(2017).
- Kosta, S., Dauby, P. C. Frank-Starling mechanism, fluid responsiveness, and length-dependent activation: Unravelling the multiscale behaviors with an in silico analysis. PLoS Computat Bio. 17 (10), e1009469(2021).
- Silverman, D. N., et al. Heart Rate-Induced Myocardial Ca2+ Retention and Left Ventricular Volume Loss in Patients With Heart Failure With Preserved Ejection Fraction. J Am Heart Assoc. 9 (17), e017215(2020).
- Zeng, M., et al. Printing thermoelectric inks toward next-generation energy and thermal devices. Chem Soc Rev. 51 (2), 485-512 (2022).
- Rastogi, S. K., et al. Remote nongenetic optical modulation of neuronal activity using fuzzy graphene. Proc Natl Acad Sci. 117 (24), 13339-13349 (2020).
Reprints and Permissions
