The protocol presented here aims to guide the users on the computer-based processing of cytochrome c oxidase subunit I (COI) gene sequences generated from beetles, such that the species clustering hypothesis called molecular operational taxonomic units (MOTUs) can be generated from DNA.
A subscription to JoVE is required to view this content. Sign in or start your free trial.
Method Article
A Concoction Pipeline for Generating Molecular Operational Taxonomic Units (MOTUs) Among Riparian and Aquatic Beetles
In This Article
Summary
Abstract
Biodiversity decline is transpiring at rates unimaginable, yet biodiversity monitoring is hampered by a plethora of factors, including the incomplete inventory of baseline diversity and the dwindling population of skilled taxonomists. Bridging this impediment in species inventory of "dark taxa", or hyperdiverse groups often understudied in taxonomy, is particularly crucial in the tropics facing insurmountable environmental pressures. While morphology-based alpha-taxonomy remains the gold standard in species identification, DNA-based methods have been showing tremendous potential in accelerating species delineation and discovery. Here, we describe a concoction pipeline for generating molecular operational taxonomic units (MOTUs) involving six molecular species delimitation approaches implemented on two highly inconspicuous beetle genera, namely Byrrhinus Motschulsky, 1858 of family Limnichidae and Anacaena Thomson, 1859 of family Hydrophilidae, from the Philippines. As this protocol focuses on processing DNA barcodes and given that these genetic data can be obtained either by sequencing or by downloading from online databases, the starting point for the protocol described here are the DNA sequences. Given the COI barcodes, the pipeline utilizes a combination of three threshold-based molecular species delimitation approaches, namely TaxonDNA, K2P, and ASAP, which use sequence alignment as input data. Additionally, the pipeline proceeds with three coalescent-based approaches, namely PTP-ML, PTP-BI, and mPTP, which require a tree file as input data. Some approaches entail the use of web servers, while others utilize local software. With the selection of algorithmic methods presented, MOTUs can be identified, whether by consensus or by majority. Remarkably, this pipeline delineated almost conspicuous beetle species from the Philippines, even those documented from the same or adjacent localities.
Introduction
With the unprecedented rates of global species decline across varied taxa1,2,3,4, the impetus to create a comprehensive biodiversity inventory, which includes previously undiscovered and undescribed species, becomes a race against time2,5. For one, biodiversity conservation only makes sense in light of proper taxonomic knowledge6,7. Thus, the identification of biodiversity at the species level is necessary, given that closely related yet different species may have unique fundamental niches8.
In beetle systematics, alpha-taxonomy or traditional taxonomy is the gold standard in species identification similar to most, if not all, animal groups9. This approach relies on morphological characters to classify organisms at higher taxonomy and to provide identification at the species-level10,11. In many instances, family12 or even genus-level identification13 can be done using external morphological features alone, such as body form and specialized adaptations. Meanwhile, species-level identification in beetles is usually done via the comparison of the structural details of the aedeagus or the male genitalia14,15,16.
Despite the wide acceptance of this morphology-based alpha-taxonomy, this approach to species discovery is hampered by numerous 'taxonomic impediments'6,17,18, especially among invertebrates19. In beetle systematics, species identification and/or discovery using alpha-taxonomy faces the challenges of having a limited number of skilled taxonomists20,21, of brief and barely informative earlier descriptions22, and of logistical problems related to access to literature and type specimens23.
This is even exacerbated when the taxon in question is cryptic or highly inconspicuous. Cryptic species refers to the set of species of the same genus, or even different genera, which cannot be easily delineated by comparative morphology, given subtle interspecific phenetic differences24. Some cryptic taxa, regarded as 'dark taxa'25,26,27, additionally suffer from being hyperdiverse yet heavily understudied. Unfortunately, this is not uncommon in riparian and aquatic beetles8,28. Failure to address species delineation among cryptic dark taxa threatens biodiversity as a one-size-fits-all conservation measure is given to organisms of potentially different niches and ecological requirements8,29.
Given these challenges, 'integrative taxonomy'23, or the approach of coupling alpha-taxonomy with another line of evidence, has gained traction as a means to erect new species in the last two decades30,31,32. One such line of evidence used in integrative taxonomic studies on beetles33,34,35,36,37,38,39 and other insect orders40,41,42,43,44,45 is DNA sequence. In particular, the mitochondrial cytochrome c oxidase subunit I (COI) gene is being used to barcode a diverse set of animals due to its moderately conservative nature46,47,48. While its 658bp-long 5′-end (COI-5′), also known as the 'barcoding fragment' or 'Folmer fragment', has been proposed as the 'diagnostic' sequence49, the 723 bp-long COI-3′ is also being used owing to a robust set of primers for the 3′-end50,51,52.
Whereas DNA barcoding using COI was conceived for species-level identification, it is limited by an a priori sequence repository53, such as GenBank54 and BOLD55, molecular species delimitation approaches set species limits using only the provided DNA sequences with no pre-requisite repository56. There are two classes of molecular species delimitation approaches based on the input file. First, using sequence alignment as the input, threshold-based approaches use cut-off values to determine divergence between and within species48,57,58. As distance-based methods, these approaches rely on an observed maximum intraspecific distance of 3% for insects, which is being referred to as the 'barcoding gap'51,59. Some of the threshold-based approaches are SpeciesIdentifier implemented in TaxonDNA60, genetic distance via Kimura 2-parameter (K2P)61, and Assemble Species by Automatic Partitioning (ASAP)62.
Second, using the tree as the input file, coalescent-based approaches identify species boundaries and sort independent lineages by determining change in lineage branching rate63,64,66. Often relying on phylogenetic species concept67, coalescent-based approaches include Poisson tree processes (PTP)68 and their variation, multi-rate PTP69. In any case, the clusters formed by the molecular species delimitation approaches are collectively referred to as molecular operational taxonomic units (MOTUs).
Here, we present methods for a concoction pipeline for generating MOTUs involving three threshold-based approaches and three coalescent-based approaches (Figure 1). The pipeline is tested on two datasets, namely (1) COI-3′ sequences of the riparian Byrrhinus Motschulsky, 1858 beetles, which is composed of two published species35 previously erected using integrative taxonomy and additional sequences from undescribed species, and (2) COI-5′ sequences of Anacaena Thomson, 1859 beetles, which is composed of sequences from two published species70 previously erected using alpha-taxonomy and additional sequences from undescribed species.
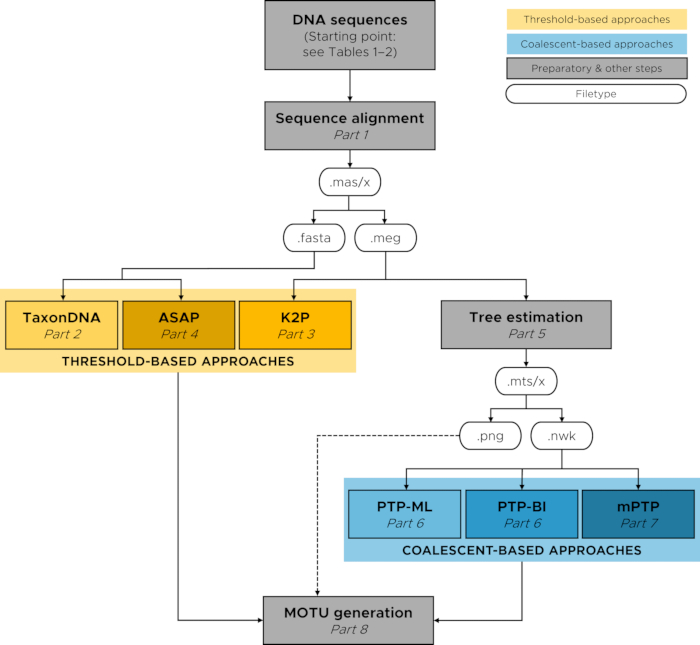
Figure 1: Flowchart of the concoction pipeline for generating MOTUs. Please click here to view a larger version of this figure.
Access restricted. Please log in or start a trial to view this content.
Protocol
The starting materials for this concoction pipeline are DNA sequences, which can either be downloaded from online repositories (e.g., BOLD, GenBank) or generated from Sanger sequencing71. Table 1 and Table 2 list the accession numbers for the datasets whose representative results are presented in this paper.
1. Preparatory step for threshold-based approaches: Sequence alignment
- Load sequences in MEGA X72.
NOTE: MEGA X can be downloaded from https://www.megasoftware.net/- Click on Align to open a dropdown menu. Click on Edit/Build Alignment and select Create a new alignment. Click on OK to confirm this selection. Select DNA as the datatype for alignment.
- Mouse over the Edit tab, and select Insert Sequence from File. Navigate to the directory with the sequences and select them to be loaded into MEGA.
- Align sequences by clicking on Alignment, and then Align by ClustalW73. Continue with default settings and click on OK.
- Manually edit the sequences by trimming both ends and by cleaning any insertions or deletions.
- To delete insertions, click on the inserted bases and/or positions, and press Delete on the keyboard.
- To correct deletions, click on the position supposed to have been deleted as denoted by "-". Delete the "-" and type the intended base.
- Find the earliest position where all sequences have a character. Click on the blank box on the row header of the position to the left of the determined position, and drag until the excess positions for all sequences until the starting end are selected. Press Delete to trim.
- Repeat step 1.3.3 by looking for the last position where all sequences have a character. Click on the blank box on the header row of the position to the right of the determined position, drag until the excess positions for all sequences until the terminal end are selected. Press Delete.
NOTE: Figure 2A shows a good alignment of DNA sequences. The final dataset is a matrix of sequences of equal length; thereby, sequence length is not a factor that affects the outcomes of the study. The reference sequences serve as a basis for the final length of the alignment matrix.
- Translate the sequence to check for stop codons, given that COI is a protein-coding sequence.
- Select all sequences, then click on the Translated Protein Sequences tab.
- When prompted, verify the genetic code as Invertebrate Mitochondrial. If the genetic code is different, click No, and a menu will appear allowing one to tick the box for Invertebrate Mitochondrial genetic code.
- If stop codons, as denoted by asterisks in the alignment body, are present for an entire column, click on DNA Sequences and delete the first position for all sequences.
- Repeat the previous step if stop codons are still present in any sequence.
- If stop codons are still present, restore the previously deleted positions. Select all sequences, then mouse over the Data tab and click on Reverse.
- Repeat step 1.4.1. If stop codons are still present, repeat steps 1.4.3 and 1.4.4.
NOTE: Figure 2B shows a good alignment of codons.
- Click on DNA Sequences, and save the sequence alignment to .mas/x. Export the sequence into other pertinent file types, such as .meg file and .fasta file.
NOTE: Certain molecular species delimitation approaches work better without the outgroup. Thus, a possible consideration is generating a copy of the alignment file without the outgroup.
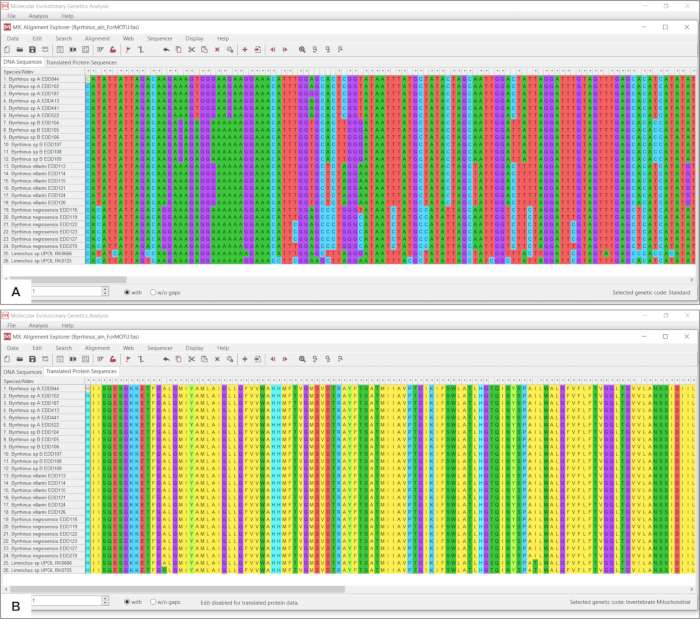
Figure 2: Sequence alignment in MEGA X. (A) Manually cleaned final DNA sequence alignment and (B) translated protein sequence alignment of the Byrrhinus dataset showing no insertions, deletions, and gaps. Please click here to view a larger version of this figure.
2. Delimitation by Taxon DNA module in Species Identifier 1.8
NOTE: Species Identifier can be downloaded from https://taxondna.sourceforge.net/
- Open TaxonDNA. Click on Import, then click on FASTA. Upload the alignment in .fasta format.
- Click on Modules, and click on Cluster. Set the threshold to 3%. Then, check on Generate information about individual cluster (Figure 3).
- Click on Make clusters now!. Save the results by taking a screenshot.
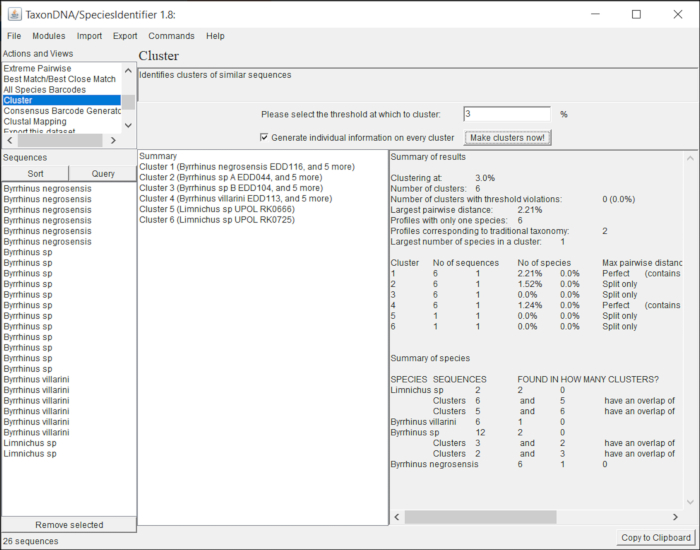
Figure 3: TaxonDNA in Species Identifier 1.8 window showing the 3% user-identified threshold for delimitation. Please click here to view a larger version of this figure.
3. Delimitation by Kimura 2-parameter (K2P) in MEGA X
- In MEGA, open the .meg file by clicking on File, then Open A File/Session. Click on Distance, then click on Compute Pairwise Distances. Confirm the .meg file for delimitation.
- Mouse over the yellow box beside Model/Method, then click the arrow that appears on the right of the box.
- Select Kimura 2-parameter model from the dropdown menu. Click on Ok to run the program. Open the data output window (Figure 4).
- Click on File, then Export/Print Distances.
- Open the dropdown menu beside Output Format and select XL: Microsoft Excel workbook. For Decimal Places, choose 4.
- Save the resulting spreadsheet in Microsoft Excel. Use Conditional Formatting to highlight those with a distance of less than 0.03 (or 3%).
NOTE: Unlike the other approaches discussed in this article, K2P does not immediately provide the clustering because it is dependent on the user-identified threshold. This pipeline is working on the assumption of the threshold being 3%, which means that any pair of sequences whose genetic distance is less than 3% belongs to the same molecular cluster.
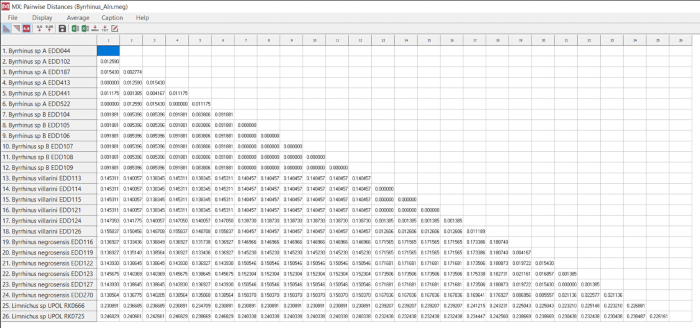
Figure 4: Resulting window in MEGA X showing the outcomes of Kimura-2-parameter. Please click here to view a larger version of this figure.
4. Delimitation by Assemble Species by Automatic Partitioning (ASAP)
- Go to the ASAP web server: https://bioinfo.mnhn.fr/abi/public/asap/asapweb.html
- Upload the alignment by clicking on the orange box labeled Choose a file… and selecting the .fasta file. Alternatively, drag the .fasta file to the orange box. Scroll down, and click on Go.
- To download the clustering, click on list for the row with the lowest ASAP-score and highest p-val rank (Figure 5).
NOTE: The result output is a .txt file, which presents subsets of the molecular clusters.
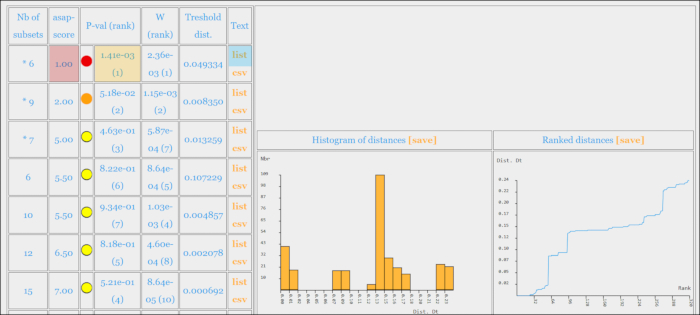
Figure 5: Resulting window in ASAP showing the possible delimitations. The first outcome (blue box) is accepted because of the lowest ASAP-score (red box) and highest P-val rank (yellow box). Please click here to view a larger version of this figure.
5. Preparatory step for coalescent-based approaches: Tree estimation
- Open the .meg file by clicking on Data, then Open A File/Session. Test the best-fit substitution model.
- Click on Models, then find Best DNA/Protein Models (ML). Confirm the .meg file for analysis.
- Click on Ok on the Analysis Preferences menu (Figure 6A). Take note of the best model using the lowest BIC and AICc value (Figure 6B).
NOTE: This is usually the first in the list of models in the resulting window. Refer to the complete names of abbreviated model names at the bottom part of the resulting window.
- Generate the tree.
- Click on Phylogeny and then Construct/Test Maximum Likelihood Tree.
- Use the best-fit nucleotide substitution model. Do this by clicking on the yellow box beside Model/Method. Select the model from the dropdown menu.
- If the best fit nucleotide substitution model has '+G' or '+I' or both, click on the box beside Rates among Sites and select the parameters (G, I, G + I) from the dropdown menu (Figure 6C).
- Under Phylogeny Test, click on the box beside Test of Phylogeny and select Bootstrap method from the dropdown menu. Click on the box beside "No. of Bootstrap Replications" and type 1000 (Figure 6C).Click on Ok to run the analysis.
- Once a window opens containing the resulting tree (Figure 6D), save the tree session as .mts/x. Save the output as .nwk file. Save also the tree as .png picture file.
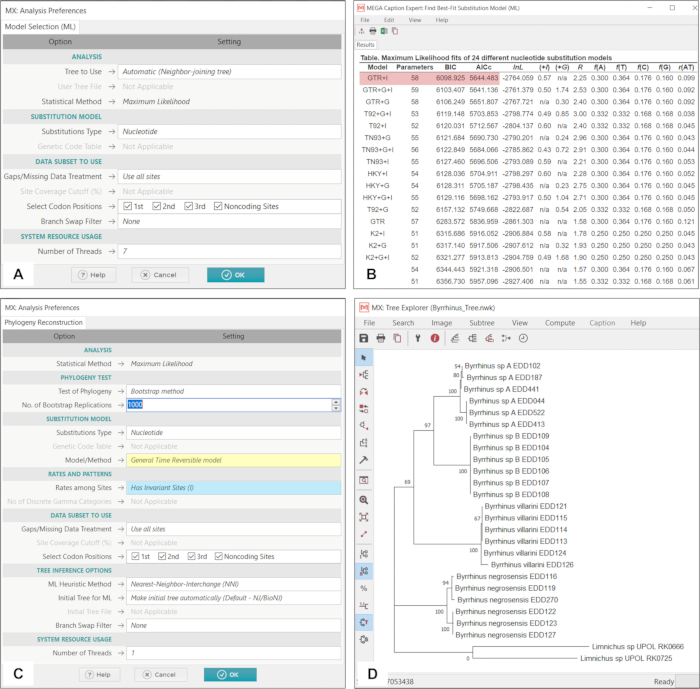
Figure 6: Tree estimation in MEGA X as a preparatory step for coalescent-based approaches. (A) Setting to determine the best-fit nucleotide substitution model. (B) For the Byrrhinus dataset, the best-fit model is GTR + I due to the lowest BIC and AICc values (red box). (C) In running the maximum likelihood tree, GTR (yellow box) + I (blue box) were set as parameters. (D) The resulting raw ML tree to be used in the subsequent analyses. Please click here to view a larger version of this figure.
6. Delimitation by Poisson Tree Processes (PTP)
NOTE: The steps below will yield the outcomes of PTP-ML and PTP-BI.
- Go to the PTP web server: https://species.h-its.org/ptp/
- Upload a newick file by clicking on Choose file. Under My tree is, select Rooted (Figure 7A).
- Input the parameters for the analysis. Under No. MCMC generations, input 100000. Under Thinning, input 100. Under Burn-in, input 0.1. Under Seed, input 123.
- Input the outgroup by typing the name of the tips in the box under Outgroup taxa names (if any). Instructions for formatting input are to the right of the input box.
- Input email address in the corresponding field, and click Submit. In the PTP species delimitation results window, click on here to open the result window.
- Under the Maximum likelihood solution, download the results of PTP-ML by clicking on Download delimitation results (Figure 7B).
- Under the Bayesian-supported solution, download the results of PTP-BI by clicking on Download delimitation results.
NOTE: The results would indicate groups of sequences in partitions. These will be labeled as numbered species followed by a support value, wherein 1.000 is ideal.
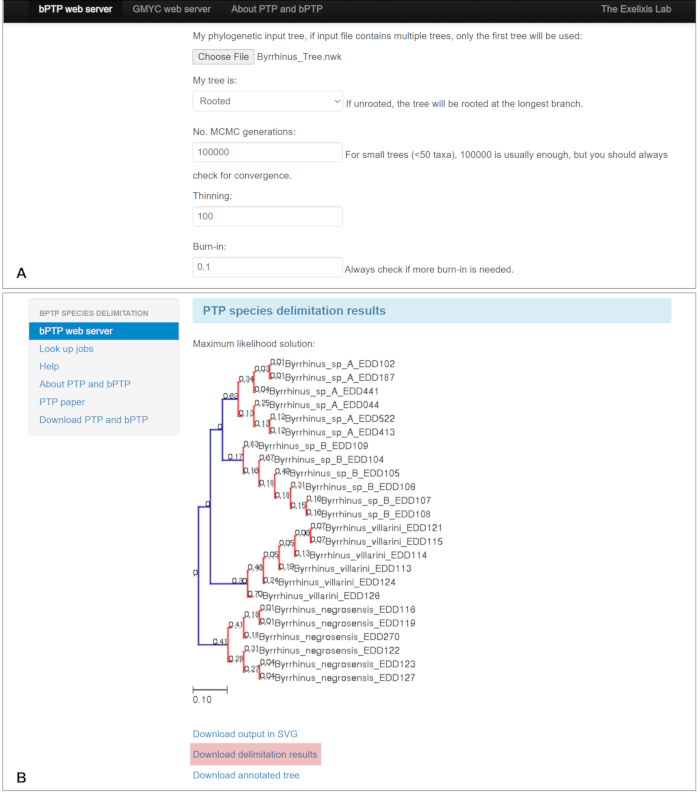
Figure 7: Molecular species delimitation by Poisson tree processes. (A) Windows showing the input parameters. (B) Resulting window in PTP web server, with link containing delimitation results (red box). Please click here to view a larger version of this figure.
7. Delimitation by Multi-rate Poisson Tree Processes (mPTP)
- Go to the mPTP web server: https://mptp.h-its.org/#/tree
- Upload the newick file by dragging it onto the gray rectangle or clicking on the rectangle. Once the data loads on the same page, click on Proceed to outgroup selection (Figure 8A).
- On the Outgroup specification page, select the outgroup by clicking on the box beside the taxa labels of outgroup specimens. Click on the Crop Outgroup option at the bottom of the sequence. Click on Model selection.
- Click on MPTP, then click on Visualization Options. On the Visualization options page, accept the default settings.
NOTE: Alternatively, the total image size may be adjusted by inputting a value (in px) under SVG width. Font and spacing of text can be adjusted by inputting desired sizes (in px) under SVG font size, Space between tips, Left Margin, Right Margin, Top Margin, and Bottom margin. - Click on Contact details. Input the email address for future reference of results (Optional).
- Click on Overview. Make sure to review the number of taxa input and the outgroups selected.
- Click on Submit. Right-click the files under Downloadable Files (Figure 8B), and select Save as… to save the results.
NOTE: The output text file will indicate the total number of delimited species at the beginning of the results. It will then present which sequences fall under each of the clusters. These clusters and corresponding sequences are arranged similarly to the generated tree in the .svg file. The mPTP SVG file will display the clustering of the sequences. Clusters are presented by groups of sequences connected by red branches along the tree. Each isolated set of red branches indicates a singular MOTU.
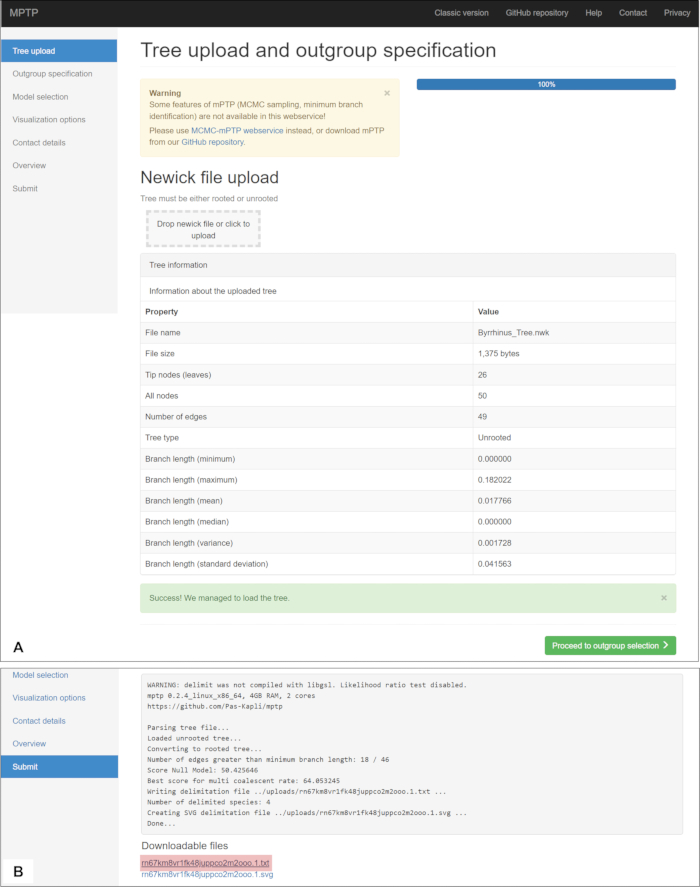
Figure 8: Molecular species delimitation by multi-rate Poisson tree processes. (A) Windows showing the mPTP-read information regarding the uploaded tree. (B) Resulting window in mPTP web server, with link containing delimitation results (red box). Please click here to view a larger version of this figure.
8. MOTU generation
- Open the tree using a photo editor program or using PowerPoint.
- Create a bar to represent the results of each molecular species delimitation approach (see Figure 9 and Figure 10 for samples). Ensure that any single bar aligns with the sequences it includes in its molecular cluster.
- Determine the MOTU by one of these two approaches74
- If all the approaches generate identical results for a given molecular cluster, erect the molecular cluster as a MOTU by consensus.
- If most approaches generate identical results for a given molecular cluster, erect the molecular cluster as a MOTU by majority.
Access restricted. Please log in or start a trial to view this content.
Results
This article implemented a molecular species delimitation concoction pipeline, which includes TaxonDNA, K2P, ASAP, two variations of PTP, and mPTP, to aquatic and riparian beetles. The outcome of each of the six approaches is referred to as 'molecular clusters', while the summary is referred to as 'molecular operational taxonomic units' or MOTUs75.
The concoction pipeline was tested on two datasets. The first dataset (Table 1, Figur...
Access restricted. Please log in or start a trial to view this content.
Discussion
While DNA sequences, especially COI49, may be compared against reference sequences22,53,78 in online public repositories54,55,79,80 for a bioidentification system46, such an approach is limited by the available deposited sequences. On the contrary, the us...
Access restricted. Please log in or start a trial to view this content.
Disclosures
We have nothing to disclose.
Acknowledgements
We thank the Bureau of Fisheries and Aquatic Resources (BFAR) and the concerned local government units for granting us prior informed consent to perform biodiversity sampling. We thank Dr Hendrik Freitag for guidance on taxonomic work. We also thank the reviewers and editors for their helpful, constructive comments. Lastly, we express our utmost gratitude to the University Research Council Big Project Grant (URC 2022-09) and the Open Access Publication Grant of the Ateneo de Manila University, the SC Johnson Student Research and Development Fund for Environmental Leadership of the Ateneo Research Institute of Science and Engineering, and the LinnéSys: Systematics Research Fund of the Linnean Society of London and the Systematics Association for funding this study.
Access restricted. Please log in or start a trial to view this content.
Materials
| Name | Company | Catalog Number | Comments |
|---|---|---|---|
| ASAP | Spart explorer | https://bioinfo.mnhn.fr/abi/public/asap/asapweb.html | |
| Computer | Any processing unit | ||
| MEGA X | MEGA Software | https://www.megasoftware.net/ | |
| mPTP web server | https://mptp.h-its.org/#/tree | ||
| PTP web server | Heidelberg Institute for Theoretical Studies (HITS) | https://species.h-its.org/ptp/ | |
| Species Identifier | https://taxondna.sourceforge.net/ |
References
- Ceballos, G., Ehrlich, P. R. Mammal population losses and the extinction crisis. Science. 296 (5569), 904-907 (2002).
- Dirzo, R., et al. Defaunation in the Anthropocene. Science. 345 (6195), 401-406 (2014).
- Cardoso, P., et al. Scientists' warning to humanity on insect extinctions. Biol Conserv. 242, 108426(2020).
- Wagner, D. L., Grames, E. M., Forister, M. L., Berenbaum, M. R., Stopak, D. Insect decline in the Anthropocene: Death by a thousand cuts. Proc Natl Acad Sci U S A. 118 (2), 1-10 (2021).
- Steffen, W., Crutzen, P. J., McNeill, J. R. Welcome to the Anthropocene. Ambio. 36 (8), 614-621 (2007).
- de Carvalho, M. R., et al. Taxonomic impediment or impediment to taxonomy? A commentary on systematics and the cybertaxonomic-automation paradigm. Evol Biol. 34 (3-4), 140-143 (2007).
- Satler, J. D., Carstens, B. C., Hedin, M. Multilocus species delimitation in a complex of morphologically conserved trapdoor spiders (Mygalomorphae, Antrodiaetidae, Aliatypus). Syst Biol. 62 (6), 805-823 (2013).
- Arribas, P., Andújar, C., Sánchez-Fernández, D., Abellán, P., Millán, A. Integrative taxonomy and conservation of cryptic beetles in the Mediterranean region (Hydrophilidae). Zool Scr. 42 (2), 182-200 (2013).
- Baker, K., et al. Carpooling with ecologists, geographers and taxonomists: Perceptions from conducting environmental research in tropical regions. Biodivers Conserv. 28 (4), 975-981 (2019).
- Tan, D. S. H., Ang, Y., Lim, G. S., Bin Ismail, M. R., Meier, R. From "cryptic species" to integrative taxonomy: An iterative process involving DNA sequences, morphology, and behaviour leads to the resurrection of Sepsis pyrrhosoma (Sepsidae: Diptera). Zool Scr. 39 (1), 51-61 (2010).
- Tan, M. K., Storozhenko, S. Y., Hwang, W. S., Meier, R. Integrative taxonomy reveals two sympatric species of the genus Eucriotettix Hebard, 1930 (Orthoptera: Tetrigidae). Zootaxa. 4268 (3), 377-394 (2017).
- Yule, C. M. Freshwater invertebrates. Freshwater Invertebrates of the Malaysian Region. , 23-31 (2004).
- Komarek, A., Jäch, M. A., Ji, L. Hydrophilidae: I. Check list and key to Palearctic and Oriental genera of aquatic Hydrophilidae (Coleoptera). Water Beetles of China. 3, 383-395 (2003).
- Rudoy, A., Ribera, I. The macroevolution of size and complexity in insect male genitalia. PeerJ. 4, e1882(2016).
- Rudoy, A., Beutel, R. G., Ribera, I. Evolution of the male genitalia in the genus Limnebius Leach, 1815 (Coleoptera, Hydraenidae). Zool J Linn Soc. 178, 97-127 (2016).
- Shapiro, A. The lock-and-key hypothesis: Evolutionary and biosystematic interpretation of insect genitalia. Annu Rev Entomol. 34 (1), 231-245 (1989).
- Scotland, R., Hughes, C., Bailey, D., Wortley, A. The big machine and the much-maligned taxonomist. Syst Biodivers. 1 (2), 139-143 (2003).
- Vinarski, M. V. Roots of the taxonomic impediment: Is the "integrativeness" a remedy. Integr Zool. 15 (1), 2-15 (2020).
- Cardoso, P., Erwin, T. L., Borges, P. A. V., New, T. R. The seven impediments in invertebrate conservation and how to overcome them. Biol Conserv. 144 (11), 2647-2655 (2011).
- Engel, M. S., et al. The taxonomic impediment: A shortage of taxonomists, not the lack of technical approaches. Zool J Linn Soc. XX, 1-7 (2021).
- Tancoigne, E., Dubois, A. Cladistics taxonomy: No decline, but inertia. Cladistics. , 1-4 (2013).
- Riedel, A., Sagata, K., Suhardjono, Y. R., Tänzler, R., Balke, M. Integrative taxonomy on the fast track: Towards more sustainability in biodiversity research. Front Zool. 10 (15), 1-9 (2013).
- Dayrat, B. Towards integrative taxonomy. Biol J Linn Soc. 85 (3), 407-415 (2005).
- Bickford, D., et al. Cryptic species as a window on diversity and conservation. Trends Ecol Evol. 22 (3), 148-155 (2007).
- Page, R. D. M. DNA barcoding and taxonomy: Dark taxa and dark texts. Philos Trans R Soc Lond B Biol Sci. 371 (1702), 20150334(2016).
- Morinière, J., et al. A DNA barcode library for 5,200 German flies and midges (Insecta: Diptera) and its implications for metabarcoding-based biomonitoring. Mol Ecol Resour. 19 (4), 900-928 (2019).
- Hartop, E., Srivathsan, A., Ronquist, F., Meier, R. Towards large-scale integrative taxonomy (LIT): Resolving the data conundrum for dark taxa. Syst Biol. 71 (6), 1404-1422 (2022).
- Fossen, E. I., Ekrem, T., Nilsson, A. N., Bergsten, J. Species delimitation in northern European water scavenger beetles of the genus Hydrobius (Coleoptera, Hydrophilidae). ZooKeys. 564, 71-120 (2016).
- Bálint, M., et al. Cryptic biodiversity loss linked to global climate change. Nat Clim Change. 1 (6), 313-318 (2011).
- Padial, J. M., De La Riva, I. A response to recent proposals for integrative taxonomy. Biol J Linn Soc. 101 (3), 747-756 (2010).
- Andújar, C., Arribas, P., Ruiz, C., Serrano, J., Gómez-Zurita, J. Integration of conflict into integrative taxonomy: Fitting hybridization in species delimitation of Mesocarabus (Coleoptera: Carabidae). Mol Ecol. 23 (17), 4344-4361 (2014).
- Schlick-Steiner, B. C., et al. Integrative taxonomy: A multisource approach to exploring biodiversity. Annu Rev Entomol. 55 (1), 421-438 (2010).
- Stüben, P. E., Astrin, J. J. Integrative taxonomy, phylogeny, and new species of the weevil genus Onyxacalles Stüben (Coleoptera: Curculionidae: Cryptorhynchinae). Psyche (Lond). 2012, 1-22 (2012).
- Hawlitschek, O., et al. Pleistocene climate change promoted rapid diversification of aquatic invertebrates in Southeast Australia. BMC Evol Biol. 12 (142), 1-15 (2012).
- Delocado, E. D., Freitag, H. Two new species of Byrrhinus Motschulsky, 1858 (Coleoptera, Limnichidae, Limnichinae) from Negros, Philippines. ZooKeys. 1070, 51-72 (2021).
- De Vera, G. C. M., Sia, J. I. L., Freitag, H., Delocado, E. D. The first new species of Leptelmis Sharp, 1888 (Coleoptera, Elmidae) from the Philippines in the last 50 years. Tijdschr Entomol. 166 (2-3), 175-186 (2023).
- Seno, C. B. N., Delocado, E. D., Freitag, H. Three new species of Ancyronyx Erichson, 1847 (Coleoptera, Elmidae) from Mindanao, Philippines. Tijdschr Entomol. 72, 61-80 (2022).
- López-López, A., Hudson, P., Galián, J. Islands in the desert: Species delimitation and evolutionary history of Pseudotetracha tiger beetles (Coleoptera: Cicindelidae: Megacephalini) from Australian salt lakes. Mol Phylogenet Evol. 101, 279-285 (2016).
- Ibarra, J. W. B., Bantiding, F. J. A., Delocado, E. D. First Georissidae (Coleoptera) from the Philippines with description of two new species of Georissus Latreille, 1809. Tijdschr Entomol. , 45-58 (2025).
- Boonsoong, B., Sartori, M. Review and integrative taxonomy of the genus Prosopistoma Latreille, 1833 (Ephemeroptera, Prosopistomatidae) in Thailand, with description of a new species. ZooKeys. 825, 123-144 (2019).
- Wang, Y., Nansen, C., Zhang, Y. Integrative insect taxonomy based on morphology, mitochondrial DNA, and hyperspectral reflectance profiling. Zool J Linn Soc. 177 (2), 378-394 (2016).
- Schutze, M. K., et al. One and the same: Integrative taxonomic evidence that Bactrocera invadens (Diptera: Tephritidae) is the same species as the Oriental fruit fly Bactrocera dorsalis. Syst Entomol. 40 (2), 472-486 (2015).
- Schär, S., et al. Integrative biodiversity inventory of ants from a Sicilian archipelago reveals high diversity on young volcanic islands (Hymenoptera: Formicidae). Org Divers Evol. 20, 405-416 (2020).
- Ševčík, J., et al. Integrative taxonomy of Central European Planetella (Diptera: Cecidomyiidae) indicates high species diversity, intraspecific variation and low host specificity. Acta Entomol Musei Natl Pragae. 63 (2), 413-450 (2023).
- Mengual, X., Ståhls, G., Vujić, A., Marcos-García, M. Á Integrative taxonomy of Iberian Merodon species (Diptera, Syrphidae). Zootaxa. 1377, 1-26 (2006).
- Hebert, P. D. N., et al. Biological identifications through DNA barcodes. Proc R Soc B Biol Sci. 270 (1512), 313-321 (2003).
- Hebert, P. D. N., et al. Ten species in one: DNA barcoding reveals cryptic species in the neotropical skipper butterfly Astraptes fulgerator. Proc Natl Acad Sci U S A. 101 (41), 14812-14817 (2004).
- Hebert, P. D. N., Gregory, T. R. The promise of DNA barcoding for taxonomy. Syst Biol. 54 (5), 852-859 (2005).
- Hebert, P. D. N., Ratnasingham, S., DeWaard, J. R. Barcoding animal life: Cytochrome c oxidase subunit 1 divergences among closely related species. Proc R Soc Lond B. 270 (Suppl), S96-S99 (2003).
- Simon, C., et al. Evolution, weighting, and phylogenetic utility of mitochondrial gene sequences and a compilation of conserved polymerase chain reaction primers. Ann Entomol Soc Am. 87 (6), 651-701 (1994).
- Hendrich, L., et al. Mitochondrial Cox1 sequence data reliably uncover patterns of insect diversity but suffer from high lineage-idiosyncratic error rates. PLoS ONE. 5 (12), e14448(2010).
- Balke, M., et al. Suggestions for a molecular biodiversity assessment of Southeast Asian freshwater invertebrates: Lessons from the megadiverse beetles (Coleoptera). J Limnol. 72 (Suppl 2), 61-68 (2013).
- Virgilio, M., et al. Comparative performances of DNA barcoding across insect orders. BMC Bioinformatics. 11, 206(2010).
- Benson, D. A., et al. GenBank. Nucleic Acids Res. 41 (D1), 36-42 (2013).
- Ratnasingham, S., Hebert, P. D. N. BOLD: The barcode of life data system. Mol Ecol Notes. 7, 355-364 (2007).
- Pons, J., et al. Sequence-based species delimitation for the DNA taxonomy of undescribed insects. Syst Biol. 55 (4), 595-609 (2006).
- Puillandre, N., et al. automatic barcode gap discovery for primary species delimitation. Mol Ecol. 21 (8), 1864-1877 (2012).
- Fontaneto, D., Flot, J. F., Tang, C. Q. Guidelines for DNA taxonomy, with a focus on the meiofauna. Mar Biodivers. 45 (3), 433-451 (2015).
- Balke, M., et al. New Guinea highland origin of a widespread arthropod supertramp. Proc R Soc B Biol Sci. 276 (1666), 2359-2367 (2009).
- Meier, R., et al. DNA barcoding and taxonomy in Diptera: A tale of high intraspecific variability and low identification success. Syst Biol. 55 (5), 715-728 (2006).
- Kimura, M. A simple method for estimating evolutionary rates of base substitutions through comparative studies of nucleotide sequences. J Mol Evol. 16 (2), 111-120 (1980).
- Puillandre, N., Brouillet, S., Achaz, G. ASAP: Assemble species by automatic partitioning. Mol Ecol Resour. 21 (2), 609-620 (2021).
- Wiens, J. J., Penkrot, T. A. Delimiting species using DNA and morphological variation and discordant species limits in spiny lizards (Sceloporus). Syst Biol. 51 (1), 69-91 (2002).
- Fujisawa, T., Barraclough, T. G. Delimiting species using single-locus data and the generalized mixed Yule coalescent approach: A revised method and evaluation on simulated data sets. Syst Biol. 62 (5), 707-724 (2013).
- Yang, Z., Rannala, B. Unguided species delimitation using DNA sequence data from multiple loci. Mol Biol Evol. 31 (12), 3125-3135 (2014).
- Leaché, A. D., Fujita, M. K. Bayesian species delimitation in West African forest geckos (Hemidactylus fasciatus). Proc R Soc B Biol Sci. 277 (1697), 3071-3077 (2010).
- Luo, A., et al. Comparison of methods for molecular species delimitation across a range of speciation scenarios. Syst Biol. 67 (5), 830-846 (2018).
- Zhang, J., et al. A general species delimitation method with applications to phylogenetic placements. Bioinformatics. 29 (22), 2869-2876 (2013).
- Kapli, P., et al. Multi-rate Poisson tree processes for single-locus species delimitation under maximum likelihood and Markov chain Monte Carlo. Bioinformatics. 33 (11), 1630-1638 (2017).
- Sanchez, E. G. S., Delocado, E. D., Freitag, H. Two new species of Anacaena Thomson, 1859 (Coleoptera, Hydrophilidae) from the Philippines. ZooKeys. 1112, 11-25 (2022).
- Sanger, F., Coulson, A. R. A rapid method for determining sequences in DNA by primed synthesis with DNA polymerase. J Mol Biol. 94 (3), 441-448 (1975).
- Kumar, S., et al. MEGA X: Molecular evolutionary genetics analysis across computing platforms. Mol Biol Evol. 35 (6), 1547-1549 (2018).
- Thompson, J. D., Higgins, D. G., Gibson, T. J. CLUSTAL W: Improving the sensitivity of progressive multiple sequence alignment through sequence weighting, position-specific gap penalties and weight matrix choice. Nucleic Acids Res. 22, 4673-4680 (1994).
- Pentinsaari, M., Vos, R., Mutanen, M. Algorithmic single-locus species delimitation: Effects of sampling effort, variation and nonmonophyly in four methods and 1870 species of beetles. Mol Ecol Resour. 17 (3), 393-404 (2017).
- Galimberti, A., et al. Integrated operational taxonomic units (IOTUs) in echolocating bats: A bridge between molecular and traditional taxonomy. PLoS ONE. 7 (6), e40122(2012).
- Kundrata, R., Jäch, M. A., Bocak, L. Molecular phylogeny of the Byrrhoidea-Buprestoidea complex (Coleoptera, Elateriformia). Zool Scr. 46 (2), 150-164 (2017).
- Komarek, A., Freitag, H. Taxonomic revision of Agraphydrus Règimbart, 1903 V. Philippine species and their first DNA barcodes. Koleopt Rundsch. 90, 201-242 (2020).
- Tautz, D., et al. A plea for DNA taxonomy. Trends Ecol Evol. 18 (2), 70-74 (2003).
- Altschul, S. F., et al. Basic local alignment search tool. J Mol Biol. 215 (3), 403-410 (1990).
- Porter, T., Hajibabaei, M. Over 2.5 million COI sequences in GenBank and growing. bioRxiv. , 353904(2018).
- Gómez, R. A., Reddell, J., Will, K., Moore, W. Up high and down low: Molecular systematics and insight into the diversification of the ground beetle genus Rhadine LeConte. Mol Phylogenet Evol. 98, 161-175 (2016).
- Kodada, J., et al. Ancyronyx clisteri, a new spider riffle beetle species from Borneo, redescription of A. sarawacensis Jäch including a description of the larva and new distribution data for A. procerus Jäch using DNA barcodes (Coleoptera, Elmidae). ZooKeys. 912, 25-64 (2020).
- Hajibabaei, M., Janzen, D. H., Burns, J. M., Hallwachs, W., Hebert, P. D. N. DNA barcodes distinguish species of tropical Lepidoptera. Proc Natl Acad Sci U S A. 103 (4), 968-971 (2006).
- Yeo, D., Srivathsan, A., Meier, R. Longer is not always better: Optimizing barcode length for large-scale species discovery and identification. Syst Biol. 69 (5), 999-1015 (2020).
- Sabordo, M. R., Delocado, E., Freitag, H. Two new species of the genus Ancyronyx Erichson, 1847 from the island of Negros, Philippines (Insecta, Coleoptera, Elmidae). Tijdschr Entomol. 163 (1), 13-30 (2020).
- Astrin, J. J., et al. Exploring diversity in cryptorhynchine weevils (Coleoptera) using distance-, character- and tree-based species delineation. Mol Phylogenet Evol. 63 (1), 1-14 (2012).
- Pritchard, J. K., Stephens, M., Donnelly, P. Inference of population structure using multilocus genotype data. Genetics. 155, 945-959 (2000).
- Huelsenbeck, J. P., Andolfatto, P., Huelsenbeck, E. T. Structurama: Bayesian inference of population structure. Evol Bioinform. 7, 55-59 (2011).
- Hausdorf, B., Hennig, C. Species delimitation using dominant and codominant multilocus markers. Syst Biol. 59 (5), 491-503 (2010).
- Fujita, M. K., et al. Coalescent-based species delimitation in an integrative taxonomy. Trends Ecol Evol. 27 (9), 480-488 (2012).
- Monaghan, M. T., et al. Accelerated species inventory on Madagascar using coalescent-based models of species delineation. Syst Biol. 58 (3), 298-311 (2009).
- Yang, Z., Rannala, B. Bayesian species delimitation using multilocus sequence data. Proc Natl Acad Sci U S A. 107 (20), 9264-9269 (2010).
- Ence, D. D., Carstens, B. C. SpedeSTEM: A rapid and accurate method for species delimitation. Mol Ecol Resour. 11 (3), 473-480 (2011).
- de Queiroz, K. Species concepts and species delimitation. Syst Biol. 56 (6), 879-886 (2007).
- Blair, C., Bryson, R. W. Cryptic diversity and discordance in single-locus species delimitation methods within horned lizards (Phrynosomatidae: Phrynosoma). Mol Ecol Resour. 17 (6), 1168-1182 (2017).
- Dellicour, S., Flot, J. F. Delimiting species-poor data sets using single molecular markers: A study of barcode gaps, haplowebs and GMYC. Syst Biol. 64 (6), 900-908 (2015).
- Dellicour, S., Flot, J. F. The hitchhiker's guide to single-locus species delimitation. Mol Ecol Resour. 18 (6), 1234-1246 (2018).
- Liu, L., et al. Estimating phylogenetic trees from genome-scale data. Ann N Y Acad Sci. 1360 (1), 36-53 (2015).
- Lim, G. S., Balke, M., Meier, R. Determining species boundaries in a world full of rarity: Singletons, species delimitation methods. Syst Biol. 61 (1), 165-169 (2012).
- Zhou, Z., et al. molecular species delimitation based on COI-5P barcode sequences revealed high cryptic/undescribed diversity for Chinese katydids (Orthoptera: Tettigoniidae). BMC Evol Biol. 19 (1), (2019).
- Toussaint, E. F. A., et al. Comparative molecular species delimitation in the charismatic Nawab butterflies (Nymphalidae, Charaxinae, Polyura). Mol Phylogenet Evol. 91, 194-209 (2015).
- Carstens, B. C., Dewey, T. A. Species delimitation using a combined coalescent and information-theoretic approach: An example from North American Myotis bats. Syst Biol. 59 (4), 400-414 (2010).
- Esselstyn, J. A., et al. Single-locus species delimitation: A test of the mixed Yule-coalescent model, with an empirical application to Philippine round-leaf bats. Proc R Soc Lond B. 279 (1743), 3678-3686 (2012).
- Stech, M., et al. Molecular species delimitation in the Racomitrium canescens complex (Grimmiaceae) and implications for DNA barcoding of species complexes in mosses. PLoS One. 8 (1), e53134(2013).
- Kekkonen, M., Hebert, P. D. N. DNA barcode-based delineation of putative species: Efficient start for taxonomic workflows. Mol Ecol Resour. 14 (4), 706-715 (2014).
- Meier, R., et al. "Dark taxonomy": A new protocol for overcoming the taxonomic impediments for dark taxa and broadening the taxon base for biodiversity assessment. Cladistics. 41, 223-238 (2025).
- Ebach, M. C., Holdrege, C. DNA barcoding is no substitute for taxonomy. Nature. 434, 697(2005).
- Ebach, M. C., Holdrege, C. More taxonomy, not DNA barcoding. BioScience. 55 (10), 822-823 (2005).
- Mora, C., et al. How many species are there on Earth and in the ocean. PLoS Biol. 9 (8), e1001127(2011).
- Stork, N. E. How many species of insects and other terrestrial arthropods are there on Earth. Annu Rev Entomol. 63, 31-45 (2018).
- Scheffers, B. R., et al. What we know and don't know about Earth's missing biodiversity. Trends Ecol Evol. 27 (9), 501-510 (2012).
- Carbayo, F., Marques, A. C. The cost of describing the entire animal kingdom. Trends Ecol Evol. 26 (4), 153-154 (2011).
- Walsh, J. C., et al. Trends and biases in the listing and recovery planning for threatened species: An Australian case study. Oryx. 47 (1), 134-143 (2013).
- Carrizo, S. F., et al. Freshwater megafauna: Flagships for freshwater biodiversity under threat. BioScience. 67 (10), 919-927 (2017).
Access restricted. Please log in or start a trial to view this content.
Reprints and Permissions
