This study used functional near-infrared spectroscopy (fNIRS) to measure prefrontal cortex activity during a 23 min block-design yoga asana sequence with 27 adults. Resting-state connectivity was recorded before and after practice. Findings highlight fNIRS's effectiveness in movement-based research and provide neurological insights into the effects of yoga asanas.
A subscription to JoVE is required to view this content. Sign in or start your free trial.
Method Article
Resting-State Connectivity and Neuroimaging of Prefrontal Cortex Activity During a Block-Design Yoga Asana Practice Using fNIRS
In This Article
Summary
Abstract
This study aimed to use functional near-infrared spectroscopy (fNIRS) mobile neuroimaging technology to examine changes in prefrontal cortex (PFC) activity before, during, and after yoga asana (physical yoga postures). A total of 27 healthy adults participated in a 23 min yoga asana session using a block design. Before and after the sequence, participants completed two 6 min, task-independent resting states. PFC activity was continuously recorded using the fNIRS instrument, positioned on the frontal area of the skull. The session included a control posture alternating with three active postures. Each active posture was held for 30 s, followed by a 25-30 s control posture interval, and repeated eight times. This block design resulted in 25 control posture intervals and 24 repetitions of each active posture. Analysis included preprocessing of raw fNIRS data to calculate concentrations of oxyhemoglobin (HbO) and deoxyhemoglobin (HbR), motion artifact correction, and statistical evaluation using ANOVA with Bonferroni corrections. Connectivity analyses examined interhemispheric and intrahemispheric correlations in the prefrontal cortex. In conclusion, this study demonstrates the utility of fNIRS in real-world, movement-based contexts and provides neurological insights into the effects of yoga asana.
Introduction
Yoga is an ancient Indian practice that integrates physical postures (asana), breathing exercises (pranayama), meditation, and ethical principles to promote holistic physical and mental well-being. In recent years, yoga has become increasingly recognized as a complementary intervention for mental health conditions, supported by a growing body of scientific research. Numerous studies have shown that regular yoga practice can significantly reduce symptoms of anxiety, depression, and stress, while enhancing mood, emotional regulation, and overall psychological resilience1,2,3. Meta-analyses and randomized controlled trials have further substantiated yoga's efficacy as an adjunct therapy for depression and post-traumatic stress disorder, with evidence also suggesting improved quality of life and cognitive function4,5,6,7,8.
Despite this promising evidence base, the neural mechanisms underlying movement-based yoga practices, particularly the physical postures (asana), remain poorly understood9,10. This gap in knowledge has hindered efforts to integrate yoga into neurocognitive models of intervention. The goal of the present study is to investigate brain activity associated with yoga asana practice in real time, thereby contributing to a mechanistic understanding of how movement-based contemplative practices impact cortical function.
To accomplish this, we employed functional near-infrared spectroscopy (fNIRS), a non-invasive, portable neuroimaging technique that measures hemodynamic responses in the cerebral cortex11. The rationale for using fNIRS is rooted in its ability to monitor brain activity during naturalistic, upright movement -- an approach not possible with conventional imaging methods such as fMRI or PET, which require participants to remain motionless in artificial environments12. Compared to these alternatives, fNIRS offers several advantages: it is silent, motion-tolerant, and allows for the study of ecologically valid tasks in real-world environments13. Consequently, it has been widely used in studies of motor learning, cognitive workload, infant development, gait and balance, and mindfulness practices, producing reliable insights into prefrontal cortex activity during both static and dynamic conditions14,15,16,17,18. Its application in naturalistic settings, particularly during movement, has opened new avenues for studying embodied cognition and the neural substrates of integrative health interventions.
However, few studies have applied this technique to yoga asana specifically, and even fewer have done so across the full temporal arc of a session -- from pre- to during to post-practice -- with a population-representative sample. To address this, the current study employed a block-design protocol using fNIRS to examine cortical activity and resting-state connectivity before, during, and after a structured yoga asana sequence. The study was conducted in a naturalistic setting and included 27 native Spanish-speaking participants from Mexico, thereby addressing a significant gap in the literature concerning the effects of yoga in Latin-Spanish-speaking populations. Participants ranged in age from 18 to 65 and included both male and female individuals with a wide range of yoga experience, from complete beginners to practitioners with up to 15 years of regular practice. All participants reported no severe psychological or physiological conditions that would prevent them from completing the 23 min yoga session. Individuals with severe psychiatric disorders or mobility-limiting physical conditions were excluded. While participants were not screened for specific medical pathologies such as hypertension or diabetes, it was clearly explained prior to the session that they could stop at any time should they feel unwell or uncomfortable. It was agreed in advance that any incomplete sessions would be excluded from analysis.
Of the original 30 participants, no one withdrew due to discomfort during the yoga practice. However, three were excluded from the final analysis due to excessive signal noise likely caused by hardware interference or technical software malfunction. By including a demographically diverse and representative sample and allowing for real-time, motion-tolerant imaging, this study enhances both the ecological validity and generalizability of findings. Researchers and clinicians seeking to investigate the neural dynamics of movement-based contemplative practices may find this method especially relevant for applications in cognitive neuroscience, rehabilitation science, and integrative mental health research.
Access restricted. Please log in or start a trial to view this content.
Protocol
Experimental procedures were performed in accordance with the Declaration of Helsinki, reviewed and approved by the Coordinación para la Innovación y la Aplicación de la Ciencia y la Tecnología (CIACYT), Universidad Autónoma de San Luis Potosí Ethics Committee Institutional Review Board [CIACYT-CEI-003]. All participants provided signed informed consent.
1. Participant recruitment and demographics
- Recruit participants through word-of-mouth and social media platforms, including Facebook and Instagram. Inform potential participants about the study objectives, requirements, and their right to withdraw at any time without penalty.
- Collect self-reported demographic information, including age, weight, height, biological sex, education, and yoga experience with in-person interviews (Table 1). Assign each participant a unique numbered code for anonymity and record their information in an encrypted spreadsheet file.
- Include participants aged 18-65 with varying levels of yoga asana experience. Exclude individuals with neurological or psychiatric conditions or those unable to perform yoga poses due to physical limitations. This study included participants aged 18 to 65 with varying levels of yoga asana experience, while excluding individuals with known neurological or psychiatric conditions, as well as those with physical limitations that would prevent them from safely performing the yoga postures. Currently, the protocol does not include variations for excluded participants, though exploring such adaptations represents a valuable direction for future research.
- Ensure all procedures comply with institutional ethical guidelines and are in accordance with the Declaration of Helsinki. All participants provide signed informed consent. Inform participants that they will receive no financial compensation and that they can terminate the experiment at any time.
2. Experimental procedure
- Use the portable fNIRS device for data collection. The device operates with dual wavelengths of 760 nm and 850 nm, providing continuous-wave near-infrared light for the assessment of changes in oxygenated (HbO) and deoxygenated (HbR) hemoglobin concentrations. The system supports up to 27 channels and records at a sampling rate of 50 Hz, allowing for reliable detection of cortical activation during naturalistic tasks.
- Prepare the fNIRS setup by positioning light sources (S) and detectors (D) into the cap holders according to the bilateral prefrontal cortex (PFC) layout provided by the manufacturer (see Figure 1). Ensure a source-detector (S-D) separation of 3.0 cm to optimize cortical signal detection.
- In addition, include two short-separation channels (1.0 cm) to account for and regress out superficial hemodynamic signals, such as scalp blood flow, which can confound cortical measurements. The use of short-separation channels is a validated method to improve signal specificity by isolating cortical hemodynamic responses from extracerebral contamination19.
- Select four yoga asanas for this study that are foundational postures commonly practiced across all styles of Hatha Yoga. They form the core of the widely known Surya Namaskar (Sun Salutation) sequence, which is globally recognized and practiced annually on June 21st during the International Day of Yoga20. These poses were intentionally chosen not only for their accessibility and standardization across yoga traditions, but also to allow for specific investigation into the effects of inversions (postures where the head is below the heart) and back extensions on brain activity-two physical forms often recommended in therapeutic yoga protocols for depression and mood disorders21,22.
- Design the presentation during the experiment in PowerPoint format, which is also a visual and auditory guide for participants. Ensure each slide displays the photo and name of one posture, written in the participant's native language (Spanish) with the original Sanskrit name in parentheses: Posture A (Tadasana), Posture B (Uttanasana), Posture C (Adho Mukha Svanasana), and Posture D (Urdhva Mukha Svanasana).
- Cycle the presentation through images of postures B, C, and D automatically every 30 s in randomized order, while the experimenter simultaneously called out the name of the posture aloud to reinforce the cue.
- Randomly organize the active asanas, ensuring that the baseline posture is interspersed between each one. This arrangement provides a balanced sequence while maintaining a variable inter-stimulus interval to reduce potential practice and habituation effects.
- For data management and consistency, standardize all visual materials-including images and fonts-in size and style across participants. Size images of the yoga postures appropriately with high resolution, and clear labels in both their native Spanish names and their traditional Sanskrit.
- Ensure that each participant can read and see the presentation prompt clearly before beginning. The active asanas and baseline asanas to be performed are described below:
Tadasana - Mountain Pose (Baseline Posture): A standing upright, neutral posture.
Uttanasana - Forward Bend (Active Posture): A forward fold from the hips with the head below the heart.
Adho Mukha Svanasana - Downward-Facing Dog (Active Posture): An inverted V position, with hands and feet on the ground and hips elevated.
Urdhva Mukha Svanasana - Upward-Facing Dog (Active Posture): Chest lifted in a back extension with the gaze moved upward. - Prepare the experimental area by setting up a yoga mat, a wall-mounted yoga rope system (see Table of Materials), and a presentation screen positioned in front of the participant-close enough for clear visibility of the postures, yet far enough to avoid obstructing movement. The setup is illustrated in Figure 2. Confirm visibility and readability of the screen before beginning the session.
- Calibrate the fNIRS system by ensuring all components-including the cap, optodes, and recording software-are fully charged, functional, and compatible with the data acquisition system. To calibrate, accurately position the optodes on the participant's scalp according to the international 10-20 system, ensuring consistent anatomical targeting of prefrontal regions. Adjust the cap and optode holders to accommodate individual head shapes and hair density, minimizing light attenuation and motion artifacts. Use the system's signal quality interface (e.g. signal-to-noise ratio, and scalp coupling index) to verify that each channel meets recommended thresholds.
NOTE: This process is essential to ensure reliable and reproducible hemodynamic measurements and to minimize data loss or misinterpretation due to poor sensor contact or signal dropout 16,23,24,25. - With the participant seated in a chair, ensure their feet are flat on the ground, hands resting gently in their lap, and their back lightly supported by the chair. Confirm verbally that the participant is seated comfortably before proceeding.
- Use a 3-D digitizer, an optical tracking device designed to capture the spatial location of optodes on the scalp, to record the cap placement. This process generates Montreal Neurological Institute (MNI) coordinates, use these to identify and standardize the anatomical brain regions underlying each measurement channel.
NOTE: Accurate digitization ensures consistency across participants and enables precise mapping of fNIRS data onto cortical structures for group-level analysis. - Secure the optode cap using the chin strap and manually adjust each optode by gently parting the hair with a bamboo stick to ensure direct scalp contact (Figure 3A). Figure 3B shows hair obstructing the optode, while Figure 3C illustrates successful removal of the obstruction using a bamboo stick. Use the DAQ value module in the acquisition software to assess signal quality. Always confirm participant comfort by asking if there is any pain or discomfort and adjust the optode positions as needed to optimize signal clarity without compromising comfort.
NOTE: Based on empirical observations during the measurement process, this step can take up to 30 min, depending on the participant's hair type. Individuals with thick, dark, or curly hair often require additional time and adjustments to ensure proper optode-scalp contact. In these cases, securing the fNIRS cap with a surgical bandage was found to be effective in maintaining stable optode placement. Participants who arrived with gel in their hair presented further challenges, as the product interfered with optode adherence. Through trial and error, we observed that creating a tight ponytail or using hairpins to hold the hair in place was more effective than relying on any type of hair fixative. These adjustments significantly improved signal quality and data reliability.
3. Resting state, yoga asana block design, and measurement practice
NOTE: As illustrated in Figure 4, each of the dynamic postures (B, C, D) was held for 30 s and interleaved with Posture A as a baseline condition, held for 25-30 s. This baseline served as a physiological reference point to isolate and compare brain activity specific to the other poses. To minimize fatigue and ensure the study focused on form rather than exertion, participants were supported in each posture using Kurunta ropes, a method from therapeutic Iyengar Yoga that allows holding postures without strain. Additionally, resting-state measurements were recorded for 6 min both before and after the asana sequence, during which participants were seated with eyes closed to capture pre- and post-practice brain connectivity.
- Connect the fNIRS cap to the software using Bluetooth to monitor real-time signal acquisition during both pre- and post-resting states, as well as throughout the yoga asana practice.
- With the fNIRS cap held securely in place while participants sit in a chair, perform the pre-asana resting state measurement. Instruct participants to relax with their feet on the ground, their hands on their laps, and to sit still with their eyes closed for 6 min. Collect fNIRS data at 25 Hz.
- To ensure minimal movement and make sure that the measurements are of the resting state and not a sleep state, inform participants not to raise their eyebrows or scratch their faces during the resting state. Also, ask them to avoid falling asleep and double-check if this occurred by asking them if they fell asleep after completing the resting state.
- After completing the first resting state, remove the chair and have participants stand and make sure that there is still a clear signal. Instruct participants to follow and perform the pre-programmed presentation with the paradigm instructions as it progresses automatically.
- Provide verbal guidance to the participants during the presentation and manually record the predetermined posture markers-labeled A, B, C, and D-as each slide transitions. These markers correspond to specific phases of the yoga sequence and were used to segment the fNIRS data for analysis: A indicates the baseline posture (Tadasana), while B, C, and D represent the subsequent active postures (Uttanasana, Adho Mukha Svanasana, and Urdhva Mukha Svanasana, respectively), as outlined in Figure 4. The markers were recorded manually using the event annotation feature in the acquisition software (OxySoft, Artinis Medical Systems) at the moment each posture slide was presented and the participant transitioned into the posture. This manual event marking has been widely used and validated in fNIRS studies to facilitate stimulus-locked analysis of hemodynamic responses 23,24,25.
- Post measurement, review that the correct markers were used during the measurement process by matching the manually marked timestamps with the automatic presentation time stamps to ensure accurate data labeling.
- Make sure that the fNIRS cap is still held securely in place and the signal is still clear, have participants sit in a chair to perform the post-asana resting state measurement. Instruct participants to relax with their feet on the ground, their hands on their laps and to sit still with their eyes closed for 6 min. Collect fNIRS data at 25 Hz.
- It can take 2-5 min post-asana to make sure that the fNIRS setup is correctly calibrated without signal interference before performing the post-asana resting state. Provide the same instruction to participants as in the pre-resting state measurement to ensure minimal movement and make sure that the measurements are of resting state and not a sleep state.
4. fNIRS data analysis of hemodynamic response function during yoga asana
NOTE: Functional near-infrared spectroscopy (fNIRS) measures changes in cortical hemodynamics through two primary parameters: oxygenated hemoglobin (HbO) and deoxygenated hemoglobin (HbR). These biomarkers are vascular correlates of neural activity mediated by the principle of neurovascular coupling. Increased neuronal activation results in an increased oxygen consumption rate, overcompensated by an elevated regional cerebral blood flow, typically resulting in a concurrent increase in HbO and a decrease in HbR. In this study, both parameters were recorded using a multi-channel fNIRS system to quantify hemodynamic responses during yoga asana practice. Measuring mean HbO values provides a robust and reliable indicator of activation, particularly during movement-based tasks, as it is less sensitive to noise and modeling assumptions than model-derived beta coefficients 26. However, while HbO is often prioritized due to its higher signal-to-noise ratio, incorporating HbR is critical for enhancing the physiological interpretation of the data. HbR signals complement HbO by offering insight into the brain's metabolic response and oxygen extraction dynamics27. Simultaneous analysis of both HbO and HbR helps to avoid oversimplification and strengthens the validity of the observed neural patterns 28.
- To evaluate the hemodynamic response function (HRF) during yoga asana, start by converting raw functional near-infrared spectroscopy (fNIRS) data into optical density (O.D.) and process it using the HOMER 3 toolbox (RRID:SCR_009586). Use the modified Beer-Lambert law (MBLL) to calculate changes in HbO and HbR concentrations, per equation 29.
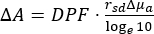
MBLL accounts for the scattering properties of biological tissue and relates changes in light absorption (ΔA) to changes in chromophore concentration (Δμa), allowing for the quantification of hemoglobin dynamics from measured light intensity. rsd denotes the source-detector distance and DPF is the differential pathlength factor. This linear approximation enables the estimation of relative concentration changes in oxygenated and deoxygenated hemoglobin. Include short-channel regression to minimize the influence of superficial vascular activity and better isolate cortical signals. - Analyze the data in MATLAB. Calculate block averages for each participant, channel, and condition to maintain consistency. Begin quality control by excluding readings with significant optical density fluctuations, low signal-to-noise ratios (SNR), or large source-detector distances. Use the hmrR_PruneChannels function and set parameters such as a valid range of 1 x 10⁻⁷ to 1 x 10⁷, an SNR threshold of 2, and a source-detector distance of 0.45 mm to 45 mm.
- Detect motion artifacts for each channel with the hmrR_MotionArtifactByChannel function. Flag segments if the signal amplitude exceeds 0.5 (AMPthresh) or if the standard deviation increases by more than a factor of 15 (SDthresh) within a 1 s time window (tMotion). Exclude flagged segments, each lasting 1 s (tMask).
- Apply a General Linear Model (GLM) with a time window spanning from 2 s before to 23 s after the stimulus onset. The GLM is a statistical method used to explain variation in a set of observed data by modeling it as a combination of one or more known variables (predictors) and an error term. It estimates how much each predictor contributes to the observed outcome, allowing researchers to isolate the effects of interest while accounting for noise. In this context, use the GLM to apply short-span (SS) regressors to long-span (LS) channels to reduce systemic physiological noise, and more accurately isolate brain activity for hemodynamic response function (HRF) estimation19,30,31,32,33,34.
- Solve the GLM using ordinary least squares. To further address motion artifacts, apply regularized embedded Canonical Correlation Analysis (TCCA) with participants' resting-state data (30-210 s) as a regressor35. After this, estimate HRFs for each channel, condition, and participant, ensuring reliable neural response estimates with an improved signal-to-noise ratio.
- Use Origin to perform a one-way repeated measures ANOVA. Assess differences in mean HbO values across long channels by comparing the baseline posture A (Tadasana), a neutral standing pose that promotes alignment and stability, to posture B (Uttanasana), a standing forward fold in which the head is positioned below the heart, classifying it as an inversion; posture C (Adho Mukha Svanasana), commonly known as Downward-Facing Dog, a semi-inverted pose that elongates the spine and activates the upper body; and posture D (Urdhva Mukha Svanasana), or Upward-Facing Dog, a back extension that opens the chest and strengthens the posterior chain.
- Assess differences between postures B, C, and D. Check for normal data distribution using the Shapiro-Wilk test. Perform post-hoc pairwise comparisons with Bonferroni corrections for multiple tests, using a p-value threshold of <0.05 for significance.Calculate effect sizes for significant differences in HbO response using Cohen's d36,37.
5. fNIRS data analysis of resting-state functional connectivity
- To analyze resting-state functional connectivity (rsFC), evaluate connectivity within each hemisphere (intrahemispheric) and between hemispheres (interhemispheric) for each participant. Base this on the statistical dependency between time series, reflecting the co-activation of brain regions.
NOTE: Measuring rsFC provides insight into the brain's intrinsic functional organization in the absence of external stimuli and is increasingly recognized as a valuable tool for identifying subtle neural alterations and biomarkers of function or dysfunction. Previous research has demonstrated that rsFC patterns have been proposed as predictive biomarkers of antidepressant treatment response in patients with major depressive disorder38 underscoring the utility of resting-state analysis in capturing trait-like neural signatures. By assessing both intra- and interhemispheric connectivity, this approach enables a more comprehensive understanding of the brain's functional integration and lateralization, particularly in the context of interventions like yoga, which may modulate these resting-state networks38,39. - Select a 6 min resting-state period for the analysis, as this falls within the commonly accepted range of 5-10 min, with sufficient rsFC typically achieved after 5 min26,27,28,35. Take advantage of reduced noise levels during resting-state measurements compared to active asanas to assess HbO, HbR, and HbT concentrations34,40,41.
- Start by identifying and correcting motion artifacts in the data. Once corrected, apply a bandpass filter (0.009-0.08 Hz) to the time series to isolate the functional connectivity frequency range, then convert the filtered signals into hemoglobin concentrations using the modified Bouguer-Beer-Lambert law for further analysis40,42,43. Focus on time points free from motion artifacts (using the MotionArtifactByChannel function) to preserve the integrity of inter-hemispheric connectivity44.
- To account for spontaneous fluctuations common across all channels, apply short separation channel (SSC) signal regression. Begin by calculating the average time course across all SSCs, then regress the SSC signal from the measured fNIRS time series using the Tikhonov regularization method42.
- Use the resulting residual time series to construct connectivity matrices by computing Pearson correlations between all pairs of channels.
- For intrahemispheric connectivity, calculate the average correlation coefficients between channels within the left hemisphere and within the right hemisphere separately. For interhemispheric connectivity, compute the average correlations between each channel and its contralateral counterpart39.
- When performing statistical analysis, transform Pearson's r values into Fisher z-scores before conducting Wilcoxon-Mann-Whitney tests. Correct for multiple comparisons using the false discovery rate (FDR) method.
NOTE: The code and data that were used in this study are openly available in Zenodo45 at https://zenodo.org/records/11098997 with DOI: 10.5281/zenodo.11098996.
Access restricted. Please log in or start a trial to view this content.
Results
The preliminary analysis of active channels revealed significant differences between control posture A and the postures B and C (Figure 5A-B). A one-way repeated measures ANOVA was then performed to evaluate statistical differences in the mean HbO values of the estimated hemodynamic response function (HRF) across channels using the software package Origin(Pro), Version 2018. The assumption of normality was assessed using the Shapiro-Wilk test.
Access restricted. Please log in or start a trial to view this content.
Discussion
This study utilized fNIRS to assess PFC activity during a structured yoga asana practice, emphasizing key methodological considerations and advancements in real-world neuroimaging. Critical protocol elements included precise fNIRS optode placement, with optimal source-detector spacing (3.0 cm) and proper optode-scalp coupling to ensure accurate signal acquisition. A randomized block design, alternating between active postures (B, C, D) and a baseline posture (A) with support from yoga ropes, minimized participant fatigue...
Access restricted. Please log in or start a trial to view this content.
Disclosures
M. Goodrick is the owner of Karmuka Yoga, a yoga studio. The rest of the authors have no conflicts of interest to declare.
Acknowledgements
The authors sincerely thank CONAHCYT for their financial support, which included a scholarship for the lead author and funding for the acquisition of the fNIRS equipment. The authors also express their heartfelt appreciation to the volunteers, whose participation was crucial to the success of this research. M. Goodrick acknowledges support from CONAHCYT through scholarship No. CVU 1241565. E. Guevara acknowledges support from the CONAHCYT Frontier Science project 20884.
Access restricted. Please log in or start a trial to view this content.
Materials
| Name | Company | Catalog Number | Comments |
|---|---|---|---|
| 3-D Digitizer | Artinis Medical | DGT-456 | Used for cap placement and region mapping |
| Brite MKII fNIRS Device | Artinis Medical | BR-MK2 | Portable fNIRS instrument for PFC data |
| Harmony yoga mat 3/16” (5mm) thick 68" (173cm) | Jade | HAR368 | Stable surface for practicing asana |
| HOMER 3 Software | Boston University Neurophotonics Center (Open Source) | Homer v1.54 | For fNIRS data preprocessing |
| Origin(Pro) Software | OriginLab | ORG-2023 | Statistical analysis of data |
| Oxysoft Software | Artinis Medical | OXY-001 | Real-time signal acquisition |
| Piola Cotton 12mm Ropes | Tarpsupplies | N/A | Part of the wall-mounted yoga rope system |
| PowerPoint Presentation Setup | Microsoft | N/A | For instructional visuals |
| Stainless Steel Hook | Homheal | liuxi-050 | Part of the wall-mounted yoga rope system |
| Wall-mounted yoga rope system | Custom made | N/A | Aid for yoga postures |
References
- Cramer, H., et al. Yoga for anxiety: A systematic review and meta-analysis of randomized controlled trials. Depress Anxiety. 35 (9), 830-843 (2018).
- Pascoe, M. C., et al. Psychobiological Mechanisms Underlying the Mental Health Benefits of Yoga-Based Interventions: a Narrative Review. Compr Psychoneuroendocrinol. 6, 100037(2021).
- Nugent, N. R., et al. Benefits of Yoga on IL-6: Findings from a Randomized Controlled Trial of Yoga for Depression. Behav Med. 47 (1), 21-30 (2021).
- Dutta, A., et al. A Comprehensive Review of Yoga Research in 2020. J Integr Complement Med. 28 (2), 114-123 (2022).
- Wang, F., Szabo, A. Effects of yoga on stress among healthy adults: A systematic review. Altern Ther Health Med. 26 (4), AT6214(2020).
- Zaccari, B., et al. Yoga for veterans with PTSD: Cognitive functioning, mental health, and salivary cortisol. Psychol Trauma. 12 (8), 913-917 (2020).
- Cartwright, T., Mason, H., Porter, A., Pilkington, K. Yoga practice in the UK: A cross-sectional survey of motivation, health benefits and behaviours. BMJ Open. 10, e031848(2020).
- Streeter, C. C., et al. Thalamic Gamma Aminobutyric Acid Level Changes in Major Depressive Disorder after a 12-Week Iyengar Yoga and Coherent Breathing Intervention. J Altern Complement Med. 26 (3), 190-197 (2020).
- Gothe, N. P., McAuley, E. Yoga and Cognition: A Meta-Analysis of Chronic and Acute Effects. Psychosom Med. 77 (7), 784-797 (2015).
- Sullivan, M. B., et al. Yoga therapy and polyvagal theory: The convergence of traditional wisdom and contemporary neuroscience for self-regulation and resilience. Front Hum Neurosci. 12, 67(2018).
- Boas, D. A., Elwell, C. E., Ferrari, M., Taga, G. Twenty years of functional near-infrared spectroscopy: introduction for the special issue. Neuroimage. 85 Pt 1, 1-5 (2014).
- Pinti, P., et al. The present and future use of functional near-infrared spectroscopy (fNIRS) for cognitive neuroscience. Ann N Y Acad Sci. 1464, 5-29 (2020).
- Brigadoi, S., et al. Motion artifacts in functional near-infrared spectroscopy: A comparison of motion correction techniques applied to real cognitive data. Neuroimage. 85 Pt 1, 181-191 (2014).
- Zhang, Y., Zhu, C. Assessing Brain Networks by Resting-State Dynamic Functional Connectivity: An fNIRS-EEG Study. Front Neurosci. 13, 1430(2020).
- Tsow, F., Kumar, A., Hosseini, S. H., Bowden, A. A low-cost, wearable, do-it-yourself functional near-infrared spectroscopy (DIY-fNIRS) headband. HardwareX. 10, e00204(2021).
- Tak, S., Ye, J. C. Statistical analysis of fNIRS data: A comprehensive review. NeuroImage. 85 Pt 1, 72-91 (2014).
- Mateus, V., Osório, A., Miguel, H. O., Cruz, S., Sampaio, A. Maternal sensitivity and infant neural response to touch: an fNIRS study. Soc Cogn Affect Neurosci. 16 (12), 1256-1263 (2021).
- Gao, C., et al. Characteristics of frontal activity relevant to cognitive function in bipolar depression: an fNIRS study. Biomed Opt Express. 13 (3), 1551-1563 (2022).
- Gagnon, L., Yücel, M. A., Boas, D. A., Cooper, R. J. Further improvement in reducing superficial contamination in NIRS using double short separation measurements. Neuroimage. 85 Pt 1, 127-135 (2014).
- Manjunath, N. The transformative impact of the International Day of Yoga. Int J Yoga. 16 (1), 1-4 (2023).
- Iyengar, B. K. S. The Light on Yoga. , Schocken. (1979).
- Timothy, B., McCall, M. D. Yoga as Medicine. Vol 1, Bantam. (2007).
- Takizawa, R., et al. Neuroimaging-aided differential diagnosis of the depressive state. Neuroimage. 85 Pt 1, 498-507 (2014).
- Herold, F., et al. Functional near-infrared spectroscopy in movement science: a systematic review on cortical activity in postural and walking tasks. Neurophotonics. 4 (4), 041403(2017).
- Scholkmann, F., Boss, J., Wolf, M. An Efficient Algorithm for Automatic Peak Detection in Noisy Periodic and Quasi-Periodic Signals. Algorithms. 5 (4), 588-603 (2012).
- Huppert, T., Barker, J., Schmidt, B., Walls, S., Ghuman, A. Comparison of group-level, source localized activity for simultaneous functional near-infrared spectroscopy-magnetoencephalography and simultaneous fNIRS-fMRI during parametric median nerve stimulation. Neurophotonics. 4 (1), 015001(2017).
- Dravida, S., Noah, J. A., Zhang, X., Hirsch, J. Comparison of oxyhemoglobin and deoxyhemoglobin signal reliability with and without global mean removal for digit manipulation motor tasks. Neurophotonics. 5 (1), 011006(2017).
- Cui, X., Bray, S., Bryant, D. M., Glover, G. H., Reiss, A. L. A quantitative comparison of NIRS and fMRI across multiple cognitive tasks. Neuroimage. 54 (4), 2808-2821 (2011).
- Stute, K., et al. The fNIRS glossary project: a consensus-based resource for functional near-infrared spectroscopy terminology. Neurophotonics. 12 (2), 027801(2025).
- Abdalmalak, A., et al. Effects of Systemic Physiology on Mapping Resting-State Networks Using Functional Near-Infrared Spectroscopy. Front Neurosci. 16, 803297(2022).
- Gagnon, L., et al. Improved recovery of the hemodynamic response in diffuse optical imaging using short optode separations and state-space modeling. Neuroimage. 56 (3), 1362-1371 (2011).
- Gagnon, L., et al. Short separation channel location impacts the performance of short channel regression in NIRS. Neuroimage. 59 (3), 2518-2528 (2012).
- Saager, R. B., Berger, A. J. Direct characterization and removal of interfering absorption trends in two-layer turbid media. J Opt Soc Am A Opt Image Sci Vis. 22 (9), 1874-1882 (2005).
- Santosa, H., Zhai, X., Fishburn, F., Sparto, P. J., Huppert, T. J. Quantitative comparison of correction techniques for removing systemic physiological signal in functional near-infrared spectroscopy studies. Neurophotonics. 7 (3), 035009(2020).
- von Lühmann, A., Li, X., Müller, K. R., Boas, D. A., Yücel, M. A. Improved physiological noise regression in fNIRS: A multimodal extension of the General Linear Model using temporally embedded Canonical Correlation Analysis. Neuroimage. 208, 116472(2020).
- Cohen, J. Statistical power analysis for the behavioural sciences. , Lawrence Earlbaum Associates. Hillside, NJ, USA. (1988).
- Morris, S. B., DeShon, R. P. Combining effect size estimates in meta-analysis with repeated measures and independent-groups designs. Psychol Methods. 7 (1), 105-125 (2002).
- Martens, M. A. G., Filippini, N., Harmer, C. J., Godlewska, B. R. Resting state functional connectivity patterns as biomarkers of treatment response to escitalopram in patients with major depressive disorder. Psychopharmacology (Berl). 239 (11), 3447-3460 (2022).
- De Bruyn, N., et al. Functional network connectivity is altered in patients with upper limb somatosensory impairments in the acute phase post stroke: A cross-sectional study. PLoS One. 13 (10), e0205693(2018).
- Huppert, T. J., Diamond, S. G., Franceschini, M. A., Boas, D. A. HomER: A review of time-series analysis methods for near-infrared spectroscopy of the brain. Appl Opt. 48 (10), D280-D298 (2009).
- Huppert, T. J., Hoge, R. D., Diamond, S. G., Franceschini, M. A., Boas, D. A. A temporal comparison of BOLD, ASL, and NIRS hemodynamic responses to motor stimuli in adult humans. Neuroimage. 29 (2), 368-382 (2006).
- Mesquita, R. C., Franceschini, M. A., Boas, D. A. Resting state functional connectivity of the whole head with near-infrared spectroscopy. Biomed Opt Express. 1 (1), 324-336 (2010).
- Zhang, T., et al. Altered complexity in resting-state fNIRS signal in autism: A multiscale entropy approach. Physiol Meas. 42 (8), (2021).
- Selb, J., et al. Effect of motion artifacts and their correction on near-infrared spectroscopy oscillation data: a study in healthy subjects and stroke patients. J Biomed Opt. 20 (5), 56011(2015).
- Goodrick, M., Guevara, E. ZENODO: Yoga Asana Increases Pre-Frontal Cortex Activity and Reduces Resting State Functional Connectivity. Complement Med Res. , 1-10 (2024).
- Yücel, M. A., et al. Best practices for fNIRS publications. Neurophotonics. 8 (1), 012101(2021).
- Singh, B., et al. Effectiveness of physical activity interventions for improving depression, anxiety and distress: An overview of systematic reviews. Br J Sports Med. 57 (18), 1203-1209 (2023).
Access restricted. Please log in or start a trial to view this content.
Reprints and Permissions
