This video protocol illustrates how to perform scanning transmission electron microscopy tomography of virological specimens. For optimal outcomes, samples are prepared by high-pressure freezing and subsequent freeze substitution.
Method Article
Scanning Transmission Electron Microscopy Tomography in Virology: 3D Imaging of High-pressure Frozen, Freeze-substituted Samples
* These authors contributed equally
In This Article
Summary
Abstract
Electron microscopy (EM) and especially three-dimensional (3D) EM techniques have become established methods in structural virology. Investigation of virus-induced alteration of the cellular ultrastructure, such as Zika virus (ZIKV)-induced replication factories or coronavirus replication organelles, demands 3D imaging. Transmission electron microscopy (TEM) tomography is a widely used method, despite its limitation to samples with a thickness of up to 200 nm. Focused ion beam-scanning electron microscopy (SEM)-tomography can produce 3D data of larger volumes with isotropic, albeit typically lower resolution. Alternative techniques, such as block face-scanning electron microscopy (BF-SEM), SEM array tomography, or TEM imaging of serial sections are used for imaging of larger volumes. However, compared to the previously mentioned techniques, these techniques come at the cost of much lower resolution along the Z-axis of the sample. A technique that provides 3D information of samples up to 1 µm thickness with isotropic resolution of a few nanometers is scanning transmission electron microscopy (STEM) tomography.
Here, we present a protocol for the preparation of high-pressure frozen, freeze-substituted, and resin-embedded virological specimens and their analysis using STEM tomography. This protocol benefits from the advantages of room temperature imaging while preserving the biological ultrastructure in a near-native state. We show two representative examples for questions that can be answered using STEM tomography. First, we apply the protocol for studying virion morphogenesis of a recombinant vesicular stomatitis virus (VSV). The STEM tomograms offer information on recombinant VSV budding that is otherwise not accessible by 2D imaging. Second, we show correlative light and electron microscopy (CLEM) using Foerster resonance energy transfer (FRET) imaging and STEM tomography (FRET-3D-CLEM) of EF-C peptide nanofibrils. This recently published combination gives new insights into the uptake and disassembly of infection-enhancing peptide nanofibrils, especially profiting from the large volume that is accessible by STEM tomography.
Introduction
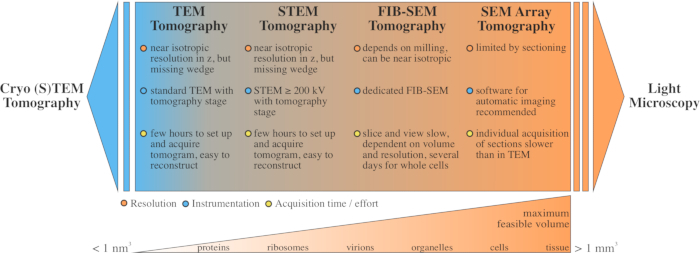
Figure 1: Comparison of different 3D microscopy techniques, considering resolution, instrumentation, acquisition time, and effort. The techniques´ maximum feasible volume is between the technically demanding cryo-TEM tomography that offers molecular resolution, and light microscopy, where resolution is limited by the diffraction limit of light. Abbreviations: TEM = transmission electron microscopy; STEM = scanning TEM; SEM = scanning electron microscopy; FIB = focused ion beam. Please click here to view a larger version of this figure.
Virus-related structures and systems span a scale from the sub-angstrom regime (e.g., small molecules for virotherapy, isolated viral proteins) to several meters (e.g., entire infected organisms). Viral particles are in the range of 20-1,000 nm and mainly investigated in their biological context, such as host cells and viral producer cell lines, which are in the µm range. Visualization of specific virus-related structures is thus dependent on choosing a technique that provides a sufficient field of view and suitable resolution. The study of virus-infected cells and tissue pieces relies on microscopy techniques (Figure 1). While overview images of cells and tissues can be acquired using classical light microscopy, intracellular structures involved in virus replication are often studied using electron microscopy (EM). Although nowadays mostly used in basic virological research, EM is also used in diagnostics1,2 and has also found its way into biopharmaceutical applications3.
Often, 2D EM approaches like classical transmission electron microscopy (TEM) cannot sufficiently answer a given biological question. In virology, this is especially the case when studying virus-host-cell interactions such as virion attachment and entry, the formation of viral factories, or virion morphogenesis4,5,6,7,8,9. Therefore, EM tomography is used to analyze the 3D ultrastructure of biological samples. In principle, there are two ways of acquiring a tomogram of a certain sample: 1) stepwise imaging of serial slices that are later combined into a 3D image stack, or 2) acquisition of projections from different viewing angles of the sample followed by computational reconstruction of the information into a virtual image stack.
The techniques of the first type include imaging of serial sections by TEM or SEM (SEM array tomography), serial block face SEM, and focused ion beam (FIB)-SEM tomography. SEM and TEM imaging of serial sections lack the resolution in z, which is limited by section thickness, but provides a large field of view and relies on equipment that is readily available in most EM labs4. FIB-SEM tomography can yield isotropic resolution, but device and maintenance costs can be challenging, and imaging of whole cells at isotropic resolution is time-consuming9,10.
The second type of tomography relies exclusively on the transmission of the electron beam through a sample. This can be done using two different imaging modalities: TEM or scanning transmission electron microscopy (STEM). While TEM tomography is more widespread and easier to implement, the section thickness is limited to ~200 nm. Therefore, structures larger than the section thickness, such as mitochondria, vesicles, or virions, cannot be imaged within a single tomogram. STEM tomography offers the possibility to image samples up to 1 µm thickness11,12. However, it requires a STEM with high acceleration voltage (≥200 kV) and a setup that supports high tilt angles as well as a small semi-convergence angle13. Although STEM imaging is a common technique in material science, it remains a rare technique in biologic EM laboratories.
Here, we present an application-driven approach to use STEM tomography for virological specimens. Due to the high complexity and labor-intensive nature of EM tomography, high-quality sample preparation is crucial. While cryogenic TEM (tomography) undoubtedly is the gold standard for investigations on a molecular level, room-temperature imaging of high-pressure frozen, freeze-substituted cells provides a solid preservation and clarity of cellular ultrastructure7,14. Briefly, adherent cells are grown on a sapphire disk and infected or otherwise treated as desired. The cells are then immobilized by freezing them under high pressure at very high cooling rates, resulting in vitrification of the water within. Subsequently, the water is replaced by a solvent while the samples are contrasted and slowly brought back to room temperature. The samples are then gradually embedded in resin.
There are many protocols for high-pressure freezing and freeze-substitution, which differ in the machinery, carrier system, and composition of the specimen. Detailed protocols for high-pressure freezing have been published, including one by Walther et al.15, and a video protocol by Steyer et al.16, which focuses on tissue preparation for FIB-SEM using microwave-assisted contrast enhancement. For virological research, Read et al.17 and Romero-Brey18 published detailed protocols for the preparation of virus-infected cells by high-pressure freezing with sapphire disks and subsequent analysis using electron tomography. Ultrathin sectioning has also been previously described15,17. Refer to the cited literature for more details regarding these approaches.
Here, we present a workflow that is an adapted and updated version of the previously published protocols15,17 paired for the first time with a detailed video guide. The protocol provides a workflow for sample preparation using high-pressure freezing, freeze substitution, and embedding in epoxy resin. Sections of 800 nm-1,000 nm thickness are cut using an ultramicrotome. A tilt series is acquired with a 200 kV STEM, using the software EM tools. This protocol is optimized for adherent cells and provides a comprehensive workflow while allowing modifications for other specimen types, such as tissue or suspension cells. For STEM tomography under cryogenic conditions, refer to the work of Michael Elbaum's group19,20.
Protocol
1. Cell culture
- Preparation of sapphire disks
- Clean the sapphire disks by washing 3x in 100% ethanol for 20 min. Remove remaining ethanol by pulling the disks over a dry filter paper. Leave the disks in a 37 °C drying chamber for at least 30 min, or until they are completely dry.
NOTE: In this protocol, sapphire disks with a diameter of 3 mm and thickness of 0.16 mm are used. For other systems, a workflow optimized for tissue or suspension cells, refer to Walther et al.15. Some "tips and tricks" for cultured cells and other systems are provided by McDonald et al.21. - Carbon-coat the sapphire disks by placing approximately 50 sapphire disks flat on a clean watch glass and coating them with a 10-15 nm-thick carbon layer by using a carbon coating device. Bake the disks overnight at 120 °C to stabilize the carbon layer.
NOTE: For correlative EM approaches, introduce a coordinate system: place a finder grid on top of the sapphire disks before carbon coating, so that the grid is visible as a negative on the disk21. - To be able to identify the carbon-coated side of the sapphire disk later on, use a sharp tool (e.g., the tip of a tweezer) to scratch a mark in the carbon that can only be read correctly from one side.
NOTE: We recommend the number "2" or similar (Figure 2A,B). Skip this step for sapphire disks with a coated coordinate system. - Store the sapphire disks in a 37 °C drying chamber until further use.
NOTE: It is not advised to re-use sapphire disks as this increases the likelihood of their breaking during high-pressure freezing.
- Clean the sapphire disks by washing 3x in 100% ethanol for 20 min. Remove remaining ethanol by pulling the disks over a dry filter paper. Leave the disks in a 37 °C drying chamber for at least 30 min, or until they are completely dry.
- Cell culture
- Shortly before placement in cell culture, glow-discharge the carbon-coated side of the disks with a glow-discharging device to make them hydrophilic (e.g., 0.26 mbar with a current of 20 mA for 40 s). Then, sterilize the disks by exposing them to UV light for 15 min.
NOTE: Exposure to UV light for more than 30 min may damage the carbon coating. - Use sterile tweezers to place the disks at the bottom of a culture dish containing media, ensuring that the disks do not float. Carefully seed the cells on top. In case the sapphire disks float in the cell culture media, glow-discharge for a longer time when repeating the experiment.
NOTE: It is crucial that the "2" is correctly oriented, meaning that the carbon-coated side faces up. A cell monolayer on the disks with a final confluency of ~80% is desired. Cell growth on the sapphire disks may differ from that in the surrounding culture dish. Check the distribution and quality of cells on the disks with an inverted light microscope before continuing with the protocol. Distribution of cells can be improved by gently rocking the plate while seeding the cells.
For suspension cells, cover carbon-coated sapphire disks with poly-L-lysine or use capillaries, as described in15. Do not expose poly-L-lysine-covered disks to UV light, as this can damage the poly-L-lysine coating. - Perform any desired treatment of the cells (e.g., infection, drug treatment) while keeping the sapphire disks in place. Handle the disks carefully to avoid detachment of cells or scratching the carbon coat. Incubate the cells accordingly. Carry out chemical prefixation with, for example, 2.5% glutaraldehyde, 1% saccharose in 0.1 M phosphate buffer (pH 7.3), or 4% paraformaldehyde, according to local regulations, before transporting the samples to the high-pressure freezer1,7,22.
NOTE: Before infected samples leave biosafety level laboratories, comply with all local biosafety regulations applicable to the model system.
- Shortly before placement in cell culture, glow-discharge the carbon-coated side of the disks with a glow-discharging device to make them hydrophilic (e.g., 0.26 mbar with a current of 20 mA for 40 s). Then, sterilize the disks by exposing them to UV light for 15 min.
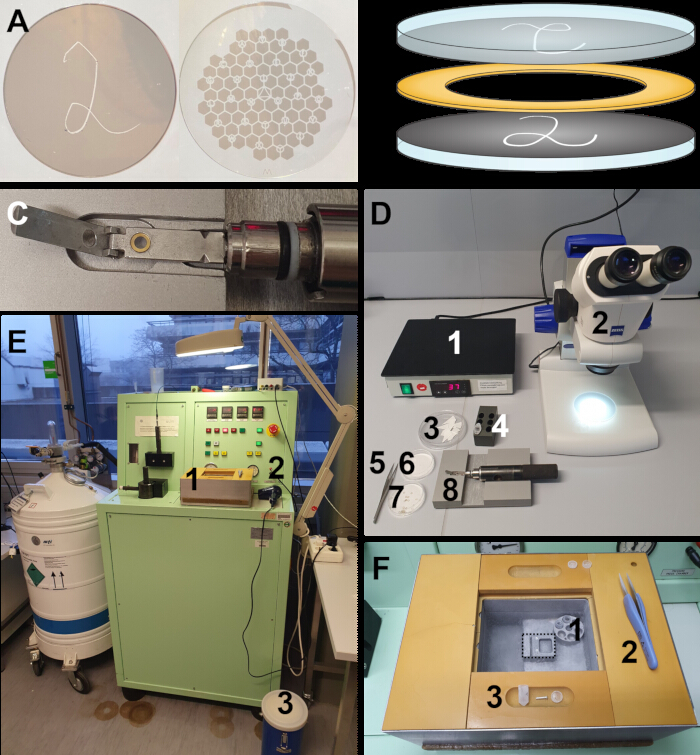
Figure 2: High-pressure freezing. (A) Sapphire disks showing carbon coat with "2" (left) or a coordinate system for correlative light and electron microscopy (right). (B) Schematic depiction of an SD-gold spacer-SD sandwich as it is prepared for high-pressure freezing. The cells grown on the disks face each other and are thereby protected in the tight cavity. (C) Holder for high-pressure freezing that contains an SD sandwich. (D) Materials and devices for loading the HPF holder: (1) Heating plate, (2) Stereo microscope, (3) Filter paper, (4) Reaction tube containing 1-hexadecene, (5) Tweezers, (6) Uncoated SDs, (7) Petri dish with gold spacers, (8) HPF holder. (E) Setup of the HPF system: (1) LN-box for transferring frozen samples (see also F), (2) Hair dryer to speed up the warming up of the HPF holder after freezing, (3) Nitrogen dewar to refill the LN box. (F) LN-box for holding frozen samples after high-pressure freezing with a central trough (dotted outline) in which the HPF holder can be opened, and SDs can be safely handled. Materials needed directly after high-pressure freezing: (1) Holder for up to six sample containers, (2) Insulated tweezers, (3) Sample containers with lid. The containers contain small holes and small weights (e.g., a screw) so that they immerse in liquid nitrogen. Abbreviations: SD = sapphire disk; HPF = high-pressure freezer; LN = liquid nitrogen. Please click here to view a larger version of this figure.
2. Sample preparation for electron microscopy
- High-pressure freezing
NOTE: This protocol describes high-pressure freezing with the referenced high-pressure freezer (HPF, Table of Materials). The steps described should not differ much for other machines, as they serve the same purpose.- Follow the manufacturer's instructions to set up the high-pressure freezer. Ensure an adequate liquid nitrogen supply (Figure 2E), switch on the machine, and perform a test run.
- Set up a workspace to load the disks into the HPF holder (Figure 2D). Have the following items ready: a heating plate (1), a stereo microscope (2), filter paper pieces (3), reaction tube with hexadecene as filler (4), tweezers (5), empty/uncoated sapphire disks for freezing an odd number of SDs with cells (6), gold spacers (7), and the HPF holder (8, detail in Figure 2C).
- Prepare a workspace for handling frozen samples (Figure 2E,F). Before starting high-pressure freezing, prepare the following equipments:
- Get the LN-box ready and filled with liquid nitrogen (Figure 2E,F) in preparation for handling and transferring the frozen sapphire disks from the HPF holder to storage capsules.
- Get a small dewar (3 in Figure 2E) ready and fill it with liquid nitrogen: be prepared to refill the LN-box with liquid nitrogen several times during the freezing process.
- Keep insulated tweezers (2 in Figure 2F) ready.
- Prepare sample containers that will hold the sapphire disks after high-pressure freezing (storage capsules, 3 in Figure 2F). Make sure that they have a lid and several holes for liquid nitrogen to pour in and small weights (e.g., small screws or similar) to ensure that they do not float. Label the containers before use and precool them in the LN-box.
NOTE: We use BEEM capsules as storage capsules.
- Keep the samples in an incubator close to the high-pressure freezer if the cells have not been prefixed, or if not possible, on a heated plate (1 in Figure 2D), to maintain physiological conditions (37°C, 5% CO2) as long as possible.
- Ensure a sufficient number of cells on the sapphire disks and good cell quality before starting high-pressure freezing. To do so, inspect the disks using an inverted light microscope.
- Perform high-pressure freezing.
- Take one sapphire disk from the culture dish with tweezers and place it in the HPF holder (Figure 2C) with the carbon-coated side facing upwards ("2" is readable). Before that, remove excess media by dipping the disk quickly on filter paper but take care to not let the cells fall dry.
- Dip a gold spacer into hexadecene and carefully put it on top of the sapphire disk. Take a second sapphire disk and position it on top of the gold spacer with the carbon-coated side facing downwards, forming a sapphire disk - gold spacer - sapphire disk sandwich with the cells pointing towards each other. Make sure that there is no air trapped in the sandwich cavity.
- Close the HPF holder. Perform this step carefully but quickly to minimize stress on the sample, particularly for living cells that have not been prefixed.
NOTE: For specimens containing cancerogenic, mutagenic, or reprotoxic (CMR) substances, like chemical fixatives, load the HPF holder under a fume hood to minimize exposure. - Start the freezing process. Quickly insert the HPF holder into the high-pressure freezer, lock it according to the manufacturer´s instructions, and initiate the freezing process.
- Remove the vitrified samples from the HPF holder. Quickly transfer the tip of the HPF holder that carries the now frozen sapphire disks to the precooled LN-box. Remove the disks carefully from the HPF holder into the central trough in the LN-box (dashed line in Figure 2F). After that, warm up the HPF holder and remove any residual ethanol or hexadecene before starting to assemble the next sandwich.
NOTE: From now on, ensure that everything touching the disks is precooled in liquid nitrogen. Perform the transfer steps quickly in a nitrogen atmosphere and store the disks in liquid nitrogen to avoid thawing of the specimen. Practice the transfer of the holder from the HPF to the LN-box in advance to ensure a smooth and quick transition. The warming process of the holder can be sped up after freezing by using a hair dryer (2 in Figure 2E). - After removing the sapphire disks from the holder, put them into the labeled containers either for transfer to the freeze-substitution device or for liquid nitrogen storage until further processing. If the sapphire disks are tightly stacked together after HPF, use a scalpel to separate the sapphire disks prior to freeze substitution.
NOTE: Take care not to break the disks and avoid shearing forces. Plan enough time for this step.
- Freeze-substitution
- Set up the freeze-substitution device following the manufacturer's instructions. Fill the liquid nitrogen dewar and start the program to precool the sample chamber to -90 °C. Ensure there is enough liquid nitrogen for the entire substitution process.
NOTE: Involved chemicals are hazardous. Perform all steps under a fume hood and comply with local environmental, health and safety (EHS) guidelines. - Prepare the freeze-substitution solution containing 0.1% (w/v) uranyl acetate, 0.2% (w/v) osmium tetroxide (OsO4), and 5% (v/v) water in acetone. To prepare a volume of 6 mL (sufficient to fill 24 cryovials, which equals the maximum capacity of the substitution device used here), follow these steps:
- Weigh out 6 mg of uranyl acetate into a glass vessel with a tight lid.
- Add 300 µL of 4% (w/v) osmium tetroxide in water.
- Close the vessel and sonicate for 5 min to dissolve the uranyl acetate.
- Add 5.7 mL of acetone, mix, and evenly divide the solution in cryovials compatible with the freeze-substitution device.
- Place the closed cryovials containing the freeze-substitution solution into the precooled freeze-substitution device at -90 °C and wait until the solution is also cooled down to -90 °C (for approximately 20 min).
- Fill the LN-box with liquid nitrogen. For transferring the sapphire disks into the freeze-substitution device, precool tweezers, a scalpel, and pliers (or big tweezers) in liquid nitrogen.
- Use the precooled big tweezers to transfer the storage capsules with the high-pressure frozen samples from the storage tank into the LN-box.
NOTE: Work quickly to prevent any thawing of the samples. When processing samples directly after high-pressure freezing, this step can be skipped. - Transfer the high-pressure frozen samples into the freeze-substitution device. Separate the sapphire disks one by one while keeping them in liquid nitrogen. Quickly transfer each disk individually into a cryovial with freeze-substitution solution, ensuring that the disk is fully immersed. Close the cryovial and immediately place it back into the freeze-substitution device.
NOTE: During transfer, keep the cryovial in the liquid nitrogen atmosphere to prevent the substitution solution from warming up but not in liquid nitrogen to prevent it from freezing. Hold the vial with fingers close to the lid to avoid warming of the substitution solution. Handle the substitution solution with care, as it contains toxic substances. - Once all disks are transferred into the substitution device, start the freeze substitution process. Set the device to gradually raise the temperature during 16 h from -90 °C to 0 °C, with a 1 h incubation step at 0 °C, followed by a gradual increase to 20 °C over 1 h.
- As soon as the samples reach 20 °C, directly continue with washing the samples for 3 x 30 min with 100% acetone.
NOTE: Do not let the cells on the disks fall dry. Perform all subsequent steps under a fume hood. Collect all waste in a suitable container and dispose of it according to local EHS regulations.
- Set up the freeze-substitution device following the manufacturer's instructions. Fill the liquid nitrogen dewar and start the program to precool the sample chamber to -90 °C. Ensure there is enough liquid nitrogen for the entire substitution process.
- Embedding
- Freshly prepare epoxy resin according to the manufacturer's instructions.
NOTE: Perform all steps with epoxy resin under a fume hood. We recommend preparing fresh resin for each embedding procedure due to lower viscosity and thus better sample infiltration. - To pre-embed the samples, incubate the samples in a solution containing 1/3 epoxy resin and 2/3 acetone for 1 h. Replace the solution with 2/3 epoxy resin and 1/3 acetone and incubate for 3 h. Exchange the solution with 100% epoxy resin and let it incubate overnight with the vial lid open to allow remaining acetone to evaporate.
- On the next day, transfer the sapphire disks to new, labeled reaction tubes filled with freshly prepared epoxy resin. Position the disks horizontally, supported by the wall of the reaction tube, and ensure that the side with the cells faces upwards in the reaction tube (the "2" is readable under a stereo microscope). Place the reaction tubes with the lid open in an oven at 60 °C and let the epoxy resin polymerize for at least 48 h.
NOTE: If a sapphire disk fragment needs to be embedded, embed it with the help of a polymerized tip of a resin block of a previous experiment: Place the tip in the reaction tube, fill in the tube with fresh resin, and put the broken disk on top of the polymerized tip.
Any single-use consumables contaminated with epoxy resin should be placed in an oven at 60 °C to let the resin fully polymerize before disposal. Tweezers and other items can be wiped with ethanol beforehand. - Immerse the tip of a closed reaction tube in liquid nitrogen for approximately 10 s. Subsequently, remove the resin block from the reaction tube by hitting the reaction tube on the table. The sapphire disk easily separates from the carbon coat that stays on top of the embedded cells.
NOTE: Make sure that your embedding medium tolerates the temperature changes induced by liquid nitrogen treatment.
- Freshly prepare epoxy resin according to the manufacturer's instructions.
- Preparation of STEM tomography sections
- Prepare sections that are much thicker than ultrathin sections for TEM imaging, usually between 800 nm and 1 µm.
NOTE: Preparation of sections for STEM tomography slightly differs from conventional ultramicrotomy. For a detailed protocol describing the preparation of STEM tomography sections, refer to Walther et al.15 and Villinger et al.10.
Before continuing with the preparation of STEM tomography sections, make sure that the quality of the cells is good. For this, perform ultrathin sectioning (~70 nm) and TEM analysis (Figure 3D,E). - Collect the sections on parallel-bar copper grids, so that no grid bars block the electron beam when tilting the sample to high angles. For better section attachment, treat the grids with 0.01% poly-L-lysine: prepare a small aliquot of 0.01% poly-L-lysine from a 0.1% stock solution, dip the grids in the aliquot, carefully dry them by dragging the rim of the grid over a filter paper. Glow-discharge the grids and use them to collect the sections.
- Treat sections with colloidal gold as fiducial markers for tilt series alignment (see section 3).
- Apply a carbon coat to the sections to stabilize them and make them more conductive.
- Prepare sections that are much thicker than ultrathin sections for TEM imaging, usually between 800 nm and 1 µm.
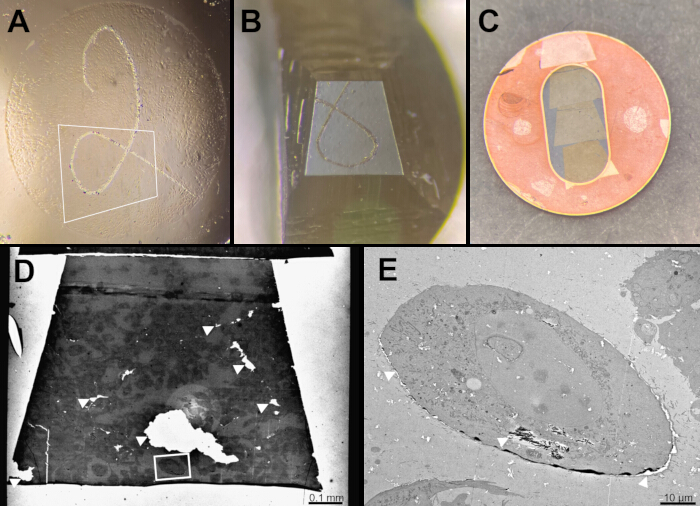
Figure 3: Quality control by TEM-different appearances of cells after embedding, trimming, and ultrathin sectioning. (A) Epoxy resin-embedded cells after the SD was removed. The carbon layer with the scratched '2' remains on the resin-embedded cells and is clearly visible. The almost transparent cells are evenly distributed across the block face. (B) Trimmed block face before microtomy. Part of the scratched 2 is still visible on the surface of the resin block. (C) 70 nm-thin sectionsmounted on a TEM grid. (D) TEM overview of one entire ultrathin section. Note the holes in the section (white arrowheads) that result from incomplete resin infiltration and are a common artifact. (E) Magnified view of a selected cell marked with a white rectangle in (D). Similar to (D), incomplete embedding is visible at the plasma membrane (white arrowheads); however, the rest of the cell shows good preservation and embedding. Scale bars = 100 µm (D), 10 µm (E). Abbreviations: SD = sapphire disk; TEM = transmission electron microscopy. Please click here to view a larger version of this figure.
3. Imaging
- STEM tilt series acquisition
- Set up the microscope according to the manufacturer's guidelines. Ensure proper beam alignment.
- Carefully fill the liquid nitrogen dewar at the microscope.
- Select the correct tomography holder in the microscope operation software.
- Insert the grid into the holder. Pay attention that the bars of the grid are oriented perpendicular to the tilt axis to prevent the bars from blocking the electron beam at high tilt angles.
- Insert the holder into the microscope.
- Align the beam by performing the following steps:
- Load the alignment file provided by the manufacturer. Open the beam valve and work in TEM mode for now. Set a magnification of approximately 20,000x and set standard focus by pressing STD Focus.
- Search for a hole in the sample. This is easier in low magnification mode (press LowMag).
- Make sure no aperture is inserted. Set the spot size to 1 and Alpha to 3. Minimize the beam on the viewing screen by turning the brightness button counterclockwise and center it with the beam shift buttons.
- Correct gun alignment: In the alignment panel of the microscope operation software, select Gun and the anode wobbler. Adjust symmetry of the beam with the DEF/STIG buttons. Confirm that the movement of the beam on the fluorescent screen is homogeneous. Move the brightest spot to the middle of the screen with the SHIFT buttons; unselect all when done.
- Correct condenser stigmators: In the same alignment panel, select CLA and the HT wobbler. Adjust with DEF/STIG buttons to achieve a homogeneous movement.
- Set the condenser lens aperture: Maximize the beam on the fluorescent screen by turning the brightness button clockwise. Insert the smallest condenser lens aperture and make sure it is aligned in the beam correctly by alternating the brightness. If the beam moves asymmetrically on the viewing screen, manually adjust the aperture using the manual aperture drives. If the aperture appears distorted on the fluorescent screen, correct the condenser stigmators CLA again with DEF/STIG (previous step 3.1.6.5).
- Switch to STEM mode (select ASID).
NOTE: You can interrupt the lens relaxation dialogue after 5-10 s. - Move the stage to a thin, contrast-rich region of the sample. Press STD Focus and remove all apertures. Change to 25,000 magnification with spot size 1.5 nm, set the camera length in between 80 and 120 cm, and select spot mode.
- Change the z-value of the goniometer until the ronchigram is visible on the viewing screen. Change the camera length if the ronchigram is faint. If it is not round, use the COND Stig button to adjust it.
- Insert the smallest condenser lens aperture. Use the manual aperture drives to center the aperture around the ronchigram.
- Insert the appropriate detector. Based on the research question, use the brightfield detector and/or the darkfield detector. Activate scan mode and acquire a first test image of the sample.
- Select a magnification larger than the one desired for the tomogram (higher than 800,000x). Correct focus and astigmatism: do this near but not directly at the region of interest (ROI) to prevent beam damage to critical sample areas.
NOTE: The gold fiducial markers can make this step easier. - Set the eucentric height to ensure that the ROI remains centered over the entire tilt range (i.e. -72 ° to 72 °). Select a feature near the ROI, bring it to the center, focus, correct astigmatism, and tilt the stage stepwise to - 72 °. Adjust the z-position of the holder to keep the feature centered and adjust contrast and brightness if necessary. If necessary, repeat this by tilting stepwise to +72 °.
- Choose the field of view by navigating back to the ROI, focus, and acquire an overview image (Figure 4). Set the desired magnification for tilt series acquisition.
- Set up automatic tilt series acquisition of images from -72° to +72° and image every 1.5°.
- To counteract mechanical effects that occur when switching the direction of the stage tilt, begin the tilt series with a larger angle than the one to start imaging with. If imaging from -72° to 72°, start by tilting the stage from 0° to -74° and then start image acquisition on the way to +72°, acquiring the first image at -72°.
- Start automatic tilt series acquisition. Make sure to enable dynamic focus in the acquisition software.
NOTE: If the tilt series acquisition is terminated prematurely, correct the eucentric height. Especially at higher magnification, this can cause issues with automated tilt series acquisition due to migration of the ROI out of the field of view.
A commonly used software for STEM and TEM tomography is SerialEM. Kirchweger et al.20 have published a video protocol for Cryo-STEM tomography using SerialEM, which can be easily adapted for room temperature STEM tomography.

Figure 4: Tilt series acquisition. (A) 200 kV STEM. (B) STEM overview of a high-pressure frozen, freeze-substituted cell embedded in epoxy resin. The tilt series shown in (C-E) was acquired at the position marked with the white rectangle. (C-E) Selected images of a tilt series acquired from -72° to +72°. Gold fiducials on both sides of the section are used for computational tomogram reconstruction. Clustered fiducials like the ones marked with the white ellipses cannot be used for reconstruction of the tomogram but are well recognizable at high tilt angles. Those or similar structures outside the region of interest are useful for setting the eucentric height. Scale bar = 1 µm (B). Abbreviation: STEM = scanning transmission electron microscopy. Please click here to view a larger version of this figure.
4. Tomogram reconstruction and segmentation
- Perform tomogram reconstruction (e.g., with Etomo software of the IMOD software package23).
- Perform the first alignment of the tilt series and reconstruct the tomogram using weighted back projection.
NOTE: A detailed protocol can be found on the IMOD website: IMOD Tomography Guide (https://bio3d.colorado.edu/imod/doc/tomoguide.html). For processing of images acquired with the dark field detector, refer to previously published work11,13.
- Perform the first alignment of the tilt series and reconstruct the tomogram using weighted back projection.
- Segment cellular structures (e.g., with software like 3DMOD from the IMOD package or AI-based solutions).
Results
STEM tomography offers the possibility to image thicker sections than TEM tomography with isotropic resolution in the nanometer range and-as compared to FIB-SEM tomography-provides a relatively time-efficient imaging workflow. In virology, this is especially useful since it allows for imaging of a large number of ultrastructural features for statistical analysis in 3D, or when searching for rare events. Here, we show two representative results that demonstrate how STEM tomography can be used with regard to these two aspects.
Visualization of budding recombinant VSV virions
There is a broad variety of viruses that form particles of different shapes and sizes. To analyze the shape of virions in a virus suspension, often a simple method like negative stain TEM is sufficient. Characterizing the morphology of virions in the cellular context is more difficult. This holds especially true for viruses that form particles with anisotropic morphology, like rhabdoviridae. VSV is a rhabdovirus that forms bullet-shaped virions of ~180 nm in length. In suspension cells, the virions are randomly oriented, making it difficult to always discern the bullet shape in 2D images (Figure 5A-C). To properly define the bullet shape of all recombinant VSV virions in a sample, a 3D method with isotropic resolution is needed-one that can also provide volumetric information over a sufficiently large sample area. A STEM tomogram can include many complete virions in a single dataset (Figure 5D,E). Thereby, it is possible to image a high number of virions for statistical analysis, even if only one tomogram per cell is acquired. In comparison, a TEM tomogram of a 200 nm-thick section would only capture a few complete recombinant VSV virions (as marked in Figure 5E).
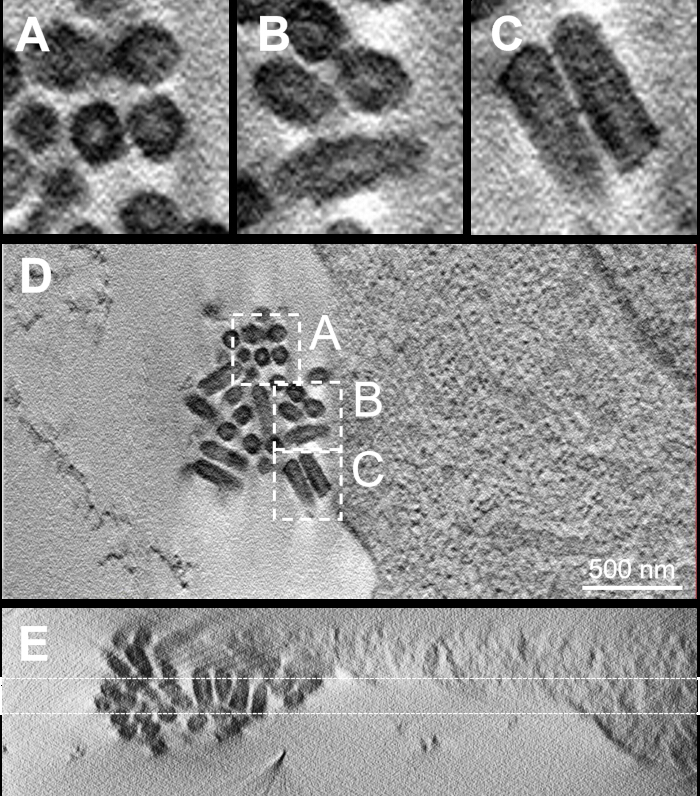
Figure 5: STEM tomography of recombinant VSV budding sites. (A-C) Details from a virtual section of a STEM tomogram obtained from an 800 nm thick section show that the bullet shape is not always visible due to (A,B) different orientations of the virions. (C) Only virions that are oriented parallel to the viewing plane present as well-defined bullets. (D) Budding sites of recombinant VSV resemble large clusters of virions with no preferred orientation. (E) The side view of the tomogram demonstrates the ability to capture many complete recombinant VSV virions in one section using STEM tomography. The virtual image stack has a thickness of approximately 600 nm at this position. The dashed lines represent the approximate thickness of a section for TEM tomography (200 nm), where only a few complete bullet-shaped virions would be included. Scale bar = 500 nm (D). Abbreviations: STEM = scanning transmission electron microscopy; VSV = vesicular stomatitis virus. Please click here to view a larger version of this figure.
Degradation of EF-C peptide nanofibrils
In the context of gene therapy, transduction-enhancing peptide nanofibrils have become a topic of interest. In a recently published study24, correlative imaging using Foerster Resonance Energy Transfer (FRET) imaging and STEM tomography (FRET-3D-CLEM) was used to investigate the uptake and disassembly of EF-C peptide nanofibrils. High FRET efficiencies, corresponding to FRET pairs that are close to each other, emit red fluorescence corresponding to assembled fibrils. Low FRET efficiencies, corresponding to FRET pairs that are far from each other, emit green fluorescence, representing disassembled fibrils. Both signals appear in cells when they are in the process of taking up and degrading EF-C peptide nanofibrils. Areas where high and low FRET efficiencies are found appear in yellow (Figure 6A).
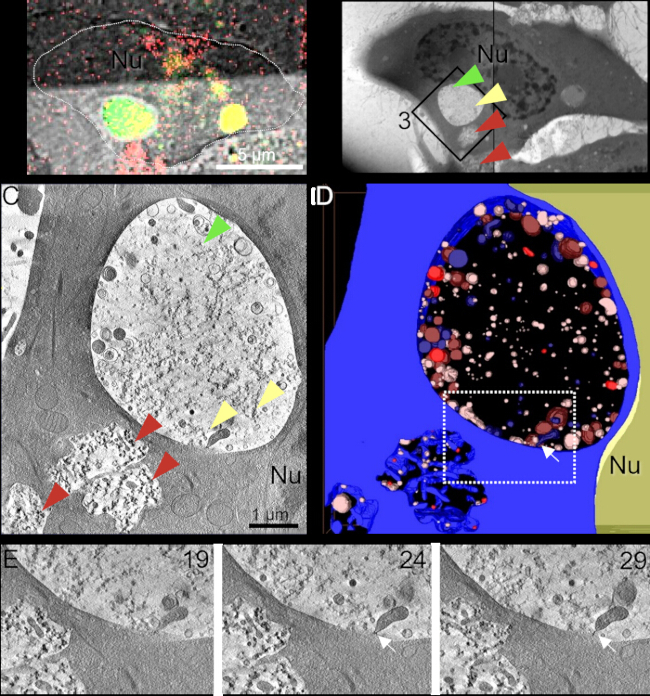
Figure 6: Imaging of EF-C peptide nanofibril degradation by correlative FRET imaging and STEM tomography (FRET-3D-CLEM). (A) Confocal microscopy of a cell incubated with EF-C nanofibrils that were labeled with a FRET pair. Green signals correspond to putatively disassembled fibrils. Red corresponds to putatively intact fibrils. Yellow corresponds to areas where a mixture of the red and the green signal is detected. Nu nucleus. (B) STEM overview of an 800 nm-thick section from the same cell. (C) The position of the tomogram is indicated. The image is a composite of two images acquired on different sections, because the cell was partially blocked by the bar grid on one of the sections. The nucleus is labeled with Nu in A, B, and C. (C) Virtual section from the tomogram. Red arrowheads mark regions overlapping with red fluorescence signals. STEM tomography confirms the presence of intact fibrils. The green arrowhead points to a region with disassembled fibrils. (D) Segmentation of the tomogram. An endocytosed filopodium is pinching off the vesicle membrane (white arrow). The large volume that can be investigated with a STEM tomogram (here approximately: 7 µm x 7 µm x 550 nm) makes it easier to observe such a rare event. (E) Virtual sections 19, 24, and 29 of the tomogram. At a pixel size of 6.8 nm, the sections are each 27.2 nm apart. The figure is reproduced from the data published by Rauch-Wirth et al.24 . Scale bars = 5 µm (A), 1 µm (C). Abbreviations: STEM = scanning transmission electron microscopy; FRET = Foerster resonance energy transfer. Please click here to view a larger version of this figure.
Visualization was performed by this correlative approach to confirm that EF-C fibrils are taken up by the cell and subsequently degraded. Light microscopy lets us choose cells for electron microscopy that provide red and green signals, to compare the ultrastructural appearance correlating with the different fluorescence signals. STEM tomograms from the same cell show that the red signal can either originate from fibrils that are still outside the cell or are seemingly freshly internalized by macropinocytosis (Figure 6C). Furthermore, CLEM verified that the green signal indeed originated from degraded fibrils (Figure 6B,C which can be found in lysosomes (Figure 6C, largest vesicle). Due to the large volume accessible by STEM tomography and the 3D visualization of the structures, it is easier to correlate the signal from light microscopy with ultrastructural features and interpret them. Furthermore, rare events, such as pinching-off filopodia inside the lysosome (Figure 6D,E, white arrow) can be detected with this approach.
Discussion
STEM tomography offers a resolution comparable to TEM tomography combined with the ability to investigate volumes with up to 1 µm thickness. We therefore consider it ideal for imaging virus-induced changes of intracellular structures, like membrane remodeling4,6,25, budding of virions7, or endocytosis5. Depending on the research question, other VolumeEM techniques might be considered. For a technique that provides a larger field of view with a comparable resolution, we recommend FIB-SEM tomography. FIB-SEM tomography will be slower than STEM tomography when imaging a comparable volume with similar resolution, since the imaging time increases when the resolution increases. Often, this is then countermeasured by imaging smaller fields of view. Furthermore, a z-resolution of 6.8 nm (Figure 6) would be technically challenging with ion beam milling. Therefore, FIB-SEM is optimal for imaging larger structures like whole cells and tissue9,10,26,27, albeit usually with (isotropic) pixel sizes of several tens of nanometers. Furthermore, FIB-SEM tomograms show no "missing wedge" effects, which is typical for tomograms reconstructed from a tilt series. Moreover, with the development of plasma FIB machines, alternatives that provide faster and still precise milling are currently being introduced to the field.
If a high resolution in z is not crucial, TEM or SEM imaging of serial sections can be an alternative that allows for the investigation of a very large field of view in a short time28,29, however, usually with anisotropic resolution. In TEM tomography, different tomograms from serial thick sections can be combined30,31. The same is possible in STEM tomography; however, given the thickness of the sections that can be investigated, there is less need to combine a number of tomograms. In virology, TEM tomography is often used to characterize virus-induced membrane remodeling32,33,34,35. While TEM tomography itself provides valuable insights in the replication cycle of viruses, most use-cases would benefit from the capability of STEM tomography to image thicker volumes. This especially holds true for virions with an anisotropic morphology, like rhabdoviridae, where TEM tomography can only capture a few complete virions in one tomogram35 or for imaging several enveloping virions in a replication compartment with a size of the cytoplasmic viral assembly complex (cVAC) of the human cytomegalovirus (HCMV)4.
STEM tomography under cryogenic conditions offers further functional insights19 and a video protocol is available20. Our protocol differs in the sample preparation workflow, which, instead of preserving the sample in the native state, provides near-native ultrastructural preservation. While STEM tomography of high-pressure frozen, freeze-substituted samples cannot achieve the ultrastructural preservation and atomic resolution seen in cryogenic EM, it benefits from the advantages of simpler equipment, more stable specimens, and a higher throughput.
The following steps are critical for the success of the method:
First, a clear goal of the imaging experiment. Due to the labor-intensive nature of the technique, a well-planned experiment with a clear goal for imaging is needed. Detailed knowledge of the model system -- cell line and virus -- should be generated beforehand by using other methods that are less difficult to perform. Therefore, we encourage optimizing infectivity rates in light microscopy-based pre-experiments and adjusting experimental conditions to suit the biological system. Optimization parameters include the number of cells, multiplicity of infection (MOI), and time points based on the virus and the event to be imaged. This will ensure a high proportion of evaluable cells in the sample.
Second, high-quality sample preparation. We emphasize the importance of quality sample preparation. At the present time, we consider vitrification by high-pressure freezing as the gold standard for thick specimens like cells. Freeze substitution, embedding, and subsequent imaging at room temperature is a robust way of acquiring high-quality results when combined with STEM tomography. Therefore, establishing a stable routine for sample preparation is crucial. For this, we would like to highlight the literature about high-pressure freezing14,21. If a less toxic freeze-substitution solution is to be used, we recommend using potassium permanganate as a substitute for osmium tetroxide, as described by Schauflinger et al.36.
Finally, a smooth-running workflow for tilt series acquisition, including a well-aligned microscope, should be established in accordance with the user instructions of the STEM and will differ from microscope to microscope. Establishing a smooth workflow also depends on the scan generator and the image acquisition software.
Disclosures
JGW, RH, EP, JSR, and MD are employees of Boehringer Ingelheim Pharma GmbH & Co.KG, a pharmaceutical company with an interest in developing and producing virus-based products. This had no influence on the design of the paper; therefore, we report no conflicts of interest.
Acknowledgements
This publication is part of the Global Development Technology Strategy and was supported by the Global Technology Management at Boehringer Ingelheim Development CMC Biologicals. We thank Renate Kunz and Jana Apolloni for excellent technical assistance and helpful discussion concerning sample preparation. We thank Reinhard Weih for excellent assistance with technical issues and concerning device maintenance. We thank Torsten Friedrich for helpful discussion and for aiding in the setup of the microscope. The work of Clarissa Read, Julia LaRoche, and Jan Münch has received funding by a Cooperative Research Centre Grant of the German Research Foundation (SFB1279).
Materials
| Name | Company | Catalog Number | Comments |
|---|---|---|---|
| 1-Hexadecene | Merck KGaA | 8220640500 | |
| 200 copper grid with parallel bars | Plano GmbH | G2014C | |
| 37 °C drying chamber | Binder GmbH | 9010-0323 | |
| Acetone | VWR international GmbH | 20066330 | |
| DDSA | Electron Microscopy Sciences | 13710 | |
| Diamond knife | Diatome Ltd | https://www.diatomeknives.com/ultra-35 | |
| DMP-30 | Electron Microscopy Sciences | 13600 | |
| Embed-812 Resin | Electron Microscopy Sciences | 14900 | |
| EM tools | TVIPS GmbH | TVIPS Software: EM-Tools; https://www.tvips.com/imaging-software/em-tools/ | |
| Ethanol 100% | Merck KGaA | 1.00983.2511 | |
| Filter paper | VWR international GmbH | 516-0812 | |
| Flaschen mit Schnappdeckelglas 11 mL | VWR international GmbH | 548-0625 | |
| Formvar | Electron Microscopy Sciences | 15830-25 | |
| Freeze substitution unit Leica EM AFS2 | Leica Microsystems GmbH | https://www.leica-microsystems.com/products/sample-preparation-for-electron-microscopy/p/leica-em-afs2/ | |
| Glod Sol 25 nm | AURION Immuno Gold Reagents & Accessories | 425.011 | |
| Gold pinehole ø 2000 μm | Science Services GmbH | GA2000-Au | |
| Graiticules Buchstaben-Netzchen Kupfer | Plano GmbH | NH6C | |
| Heating plate | MEDAX GmbH & Co. KG | 12501 | |
| High vacuum vaporization system BAF 300 | BAL-TEC AG | ||
| High-pressure freezer Wohlwend HPF Compact 01 | Engineering Office M. Wohlwend GmbH | https://www.wohlwend-hpf.ch/index.html | |
| Liquid nitrogen tank | H.Erben GmbH | 94500 | |
| Nitrogen (fluid) | VWR international GmbH | - | |
| NMA | Electron Microscopy Sciences | 19000 | |
| Osmium tetroxide | ChemPur Feinchemikalien und Forschungsbedarf GmbH | 006051 | |
| Oven 120 °C | Binder GmbH | 9010-0194 | |
| PELCO easi-Glow | Ted Pella, Inc. | 91000 | |
| Poly-L-Lysin 0.1% w/v aq. Solution | Ted Pella, Inc. | 18026 | |
| Safe-Lock Tubes 0.5 mL | Eppendorf SE | 0030 121.023 | |
| Sample containers (Beem capsules) | Plano GmbH | G360-1 | |
| Sapphire disc dia. 3 x 0.16 mm | Engineering Office M. Wohlwend GmbH | 500 | |
| Ultramicrotome Leica EM UC7 | Leica Microsystems GmbH | https://www.leica-microsystems.com/de/produkte/em-probenvorbereitung/p/leica-em-uc7/ | |
| Uranyl acetate | Riedel de Haën AG | 31697 | |
| UV light chamber | Dinies | ELG100S |
References
- Laue, M. Chapter 1 electron microscopy of viruses. Methods Cell Biol. 96, 1-20 (2010).
- Goldsmith, C. S., et al. Cell culture and electron microscopy for identifying viruses in diseases of unknown cause. Emerg Infect Dis. 19 (6), 864-869 (2013).
- Guo, F. Application of electron microscopy in virus diagnosis and advanced therapeutic approaches. J Histotechnol. 47 (1), 1-4 (2024).
- Schauflinger, M., Villinger, C., Mertens, T., Walther, P., von Einem, J. Analysis of human cytomegalovirus secondary envelopment by advanced electron microscopy. Cell Microbiol. 15 (2), 305-314 (2013).
- Abdellatif, M. E. A., Sinzger, C., Walther, P. Investigating HCMV entry into host cells by STEM tomography. J Struct Biol. 204 (3), 406-419 (2018).
- Wieland, J., Frey, S., Rupp, U., Essbauer, S., Groß, R. Zika virus replication in glioblastoma cells: electron microscopic tomography shows 3D arrangement of endoplasmic reticulum, replication organelles, and viral ribonucleoproteins. Histochem Cell Biol. 156 (6), 527-538 (2021).
- Bergner, T., Zech, F., Hirschenberger, M., Stenger, S., Sparrer, K. M. J. Near-native visualization of SARS-CoV-2 induced membrane remodeling and virion morphogenesis. Viruses. 14 (12), 2786(2022).
- Romero-Brey, I., Bartenschlager, R. Viral infection at high magnification: 3D electron microscopy methods to analyze the architecture of infected cells. Viruses. 7 (12), 6316-6345 (2015).
- Baena, V., Conrad, R., Friday, P., Fitzgerald, E., Kim, T. FIB-SEM as a volume electron microscopy approach to study cellular architectures in SARS-CoV-2 and other viral infections: a practical primer for a virologist. Viruses. 13 (4), 611(2021).
- Villinger, C., Schauflinger, M., Gregorius, H., Kranz, C., Höhn, K. Electron microscopy, methods and protocols. Methods Mol Biol. 1117, 617-638 (2013).
- Hohmann-Marriott, M. F., Sousa, A. A., Azari, A., Glushakova, S., Zhang, G. Nanoscale 3D cellular imaging by axial scanning transmission electron tomography. Nat Methods. 6 (10), 729-731 (2009).
- Walther, P., Bauer, A., Wenske, N., Catanese, A., Garrido, D. STEM tomography of high-pressure frozen and freeze-substituted cells: a comparison of image stacks obtained at 200 kV or 300 kV. Histochem Cell Biol. 150 (5), 545-556 (2018).
- Rachel, R., Walther, P., Maaßen, C., Daberkow, I., Matsuoka, M. Dual-axis STEM tomography at 200 kV: setup, performance, limitations. J Struct Biol. 211 (3), 107551(2020).
- Mielanczyk, L., Matysiak, N., Michalski, M., Buldak, R., Wojnicz, R. Closer to the native state. Critical evaluation of cryo-techniques for transmission electron microscopy: preparation of biological samples. Folia Histochem Cytobiol. 52 (1), 1-17 (2014).
- Walther, P., Schmid, E., Höhn, K. Cell imaging techniques, methods and protocols. Methods Mol Biol. 931, 525-535 (2012).
- Steyer, A. M., Ruhwedel, T., Möbius, W. Biological sample preparation by high-pressure freezing, microwave-assisted contrast enhancement, and minimal resin embedding for volume imaging. J Vis Exp. (145), e59156(2019).
- Read, C., Walther, P., von Einem, J. Human cytomegaloviruses, methods and protocols. Methods Mol Biol. 2244, 265-289 (2021).
- Romero-Brey, I. Influenza virus, methods and protocols. Methods Mol Biol. 1836, 213-236 (2018).
- Elbaum, M., Seifer, S., Houben, L., Wolf, S. G., Rez, P. Toward compositional contrast by cryo-STEM. Acc Chem Res. 54 (19), 3621-3631 (2021).
- Kirchweger, P., Mullick, D., Wolf, S. G., Elbaum, M. Visualization of organelles in situ by cryo-STEM tomography. J Vis Exp. (196), (2023).
- McDonald, K., et al. Chapter 28 "tips and tricks" for high-pressure freezing of model systems. Methods Cell Biol. 96, 671-693 (2010).
- Sosinsky, G. E., Crum, J., Jones, Y. Z., Lanman, J., Smarr, B. The combination of chemical fixation procedures with high-pressure freezing and freeze substitution preserves highly labile tissue ultrastructure for electron tomography applications. J Struct Biol. 161 (3), 359-371 (2008).
- Kremer, J. R., Mastronarde, D. N., McIntosh, J. R. Computer visualization of three-dimensional image data using IMOD. J Struct Biol. 116 (1), 71-76 (1996).
- Rauch-Wirth, L., Schuetz, D., Groß, R., Rode, S., Glocker, B. Transduction enhancing EF-C peptide nanofibrils are endocytosed by macropinocytosis and subsequently degraded. Biomaterials. , 317(2025).
- Tonnemacher, S., Folly-Klan, M., Gazi, A. D., Schaefer, S., Pénard, E. Vaccinia virus H7-protein is required for the organization of the viral scaffold protein into hexamers. Sci Rep. 12 (1), 13007(2022).
- Villinger, C., Gregorius, H., Kranz, C., Hoehn, K., Münzberg, C. FIB/SEM tomography with TEM-like resolution for 3D imaging of high-pressure frozen cells. Histochem Cell Biol. 138 (4), 549-556 (2012).
- Hackstadt, T., Chiramel, A. I., Hoyt, F. H., Williamson, B. N., Dooley, C. A. Disruption of the Golgi apparatus and contribution of the endoplasmic reticulum to the SARS-CoV-2 replication complex. Viruses. 13 (9), 1798(2021).
- Horstmann, H., Körber, C., Sätzler, K., Aydin, D., Kuner, T. Serial section scanning electron microscopy (S3EM) on silicon wafers for ultra-structural volume imaging of cells and tissues. PLoS ONE. 7 (4), e35172(2012).
- Lewczuk, B., Szyryńska, N. Field-emission scanning electron microscope as a tool for large-area and large-volume ultrastructural studies. Animals. 11 (12), 3390(2021).
- Höög, J. L., Schwartz, C., Noon, A. T., O'Toole, E. T., Mastronarde, D. N. Organization of interphase microtubules in fission yeast analyzed by electron tomography. Dev Cell. 12 (3), 349-361 (2007).
- Jiang, Y., Lin, H., Fu, C. 3D mitochondrial ultrastructure of Drosophila indirect flight muscle revealed by serial-section electron tomography. J Vis Exp. (130), e56567(2017).
- Snijder, E. J., Limpens, R. W. A. L., de Wilde, A. H., de Jong, A. W. M., Zevenhoven-Dobbe, J. C. A unifying structural and functional model of the coronavirus replication organelle: tracking down RNA synthesis. PloS Biol. 18 (6), e3000715(2020).
- Welsch, S., Miller, S., Romero-Brey, I., Merz, A., Bleck, C. K. E. Composition and three-dimensional architecture of the dengue virus replication and assembly sites. Cell Host Microbe. 5 (4), 365-375 (2009).
- Cortese, M., Goellner, S., Acosta, E. G., Neufeldt, C. J. Ultrastructural characterization of Zika virus replication factories. Cell Rep. 18 (9), 2113-2123 (2017).
- Milrot, E., Lazar, S., Schuster, O., Makdasi, E., Schmaya, S. Insights from the infection cycle of VSV-ΔG-spike virus. Viruses. 14 (12), 2828(2022).
- Schauflinger, M., Bergner, T., Neusser, G., Kranz, C., Read, C. Potassium permanganate is an excellent alternative to osmium tetroxide in freeze-substitution. Histochem Cell Biol. 157 (4), 481-489 (2022).
Reprints and Permissions
