Here, we present a semi-automated protocol for identifying and quantifying immune and non-immune cells in skin sections using SCAnED, a free ImageJ-based macro for skin segmentation.
A subscription to JoVE is required to view this content. Sign in or start your free trial.
Method Article
SCAnED - An Open-source Skin Segmentation Macro for Semi-automated Cell and Nuclei Detection in Epidermal and Dermal Skin Compartments
In This Article
Summary
Abstract
The spatial distribution of immune and non-immune cells within tissues and the expression of cell-specific markers provides essential information on cell function in situ. Human skin is a highly complex organ with defined compartments comprising different cells with diverse phenotypes. By using multi-fluorescence labeling, distinct skin cell populations can be determined and further characterized. However, currently, the availability of non-commercial tools for image analysis of skin samples that allow in silico segmentation of cells specifically within the epidermis or the dermis at a single-cell resolution is limited. We provide here a step-by-step protocol for immunofluorescence staining of skin sections, confocal microscopy, and image analysis using our freely available tool SCAnED (Skin Compartment Analysis of Epidermis and Dermis). The SCAnED macro allows the precise identification and classification of cells and nuclei in both the epidermal and dermal compartments of human skin. We provide guidelines on how to determine average intensity levels of maker expression in different cells and cellular compartments, such as the cytoplasm and the nucleus, and how to quantify cells expressing varying amounts of these markers with an accompanying Python pipeline provided as a ready-to-use Jupyter notebook executed in Google Colab. This protocol will allow inexperienced users to determine cell-specific expression profiles within skin tissue and provide insights into the spatial distribution of cells within the epidermal and dermal compartments, allowing a deeper understanding of the intricate tissue structure and cell composition of human skin.
Introduction
Understanding skin tissues on a cellular level and discerning cell phenotypes, morphology, and their localization within both the epidermal and dermal compartments are pivotal in dermatological research and histopathology1,2. The cellular composition within the epidermis, encompassing keratinocytes, melanocytes, and Langerhans cells under healthy conditions, becomes greatly imbalanced in inflammatory skin diseases and cancer. Moreover, the phenotype and localization of cells within the dermis, situated beneath the epidermis and harboring fibroblasts and the majority of immune cells, can change significantly in disease. Hence, cell and nuclei segmentation are imperative for assessing cellular attributes such as cell number, protein expression, morphology and spatial organization, and nucleus characteristics such as size, shape, and transcription factor expression, thereby aiding in the comprehension of skin homeostasis and diseases3,4,5.
Despite the availability of general-purpose image analysis platforms such as QuPath6, CellProfiler7, and ilastik8, these tools often require extensive customization and scripting to adapt to the structural complexity and heterogeneous cell morphology of skin tissue. Few tools have been specifically tailored for automated segmentation of epidermal and dermal compartments, and many available solutions are commercial and not freely accessible. These limitations make it challenging for non-experts to implement efficient pipelines for skin-specific analysis.
Here, we present a comprehensive protocol for the analysis of cells and nuclei within skin tissue and its compartments, covering all vital steps from tissue staining to image analysis using our semi-automated image analysis pipeline. We start with detailed information on immunofluorescence staining of skin tissue, including staining with E-cadherin for epidermis/dermis segmentation and 4′,6-diamidino-2-phenylindole (DAPI) for cell/nuclei detection. Two markers of interest, Vimentin (VIM) and CD90, were included for validation purposes. We recommend using antibodies at optimized concentrations (see Table 1) and capturing images using confocal microscopy with consistent settings for laser intensity, exposure time, and resolution to ensure reproducibility.
Further, we introduce our custom-designed ImageJ9 macro SCAnED, which stands for Skin Compartment Analysis of Epidermis and Dermis, and we provide all necessary steps for in silico segmentation and detection of nuclei and cells within both the epidermis and dermis. Users can choose between two different nuclei detection methods, either using simple and fast thresholding or the deep learning tool StarDist10 and our trained skin model, before proceeding with the SCAnED protocol. Unlike general tools, SCAnED was developed specifically for skin histology and outperforms them by enabling automatic compartmentalization of epidermal and dermal regions and integrated quantification of multiple markers across both regions. This is particularly useful for researchers who lack expertise in programming or deep learning, offering a ready-to-use tool tailored for skin image analysis.
We further show how mean intensity levels are extracted per cell from immunofluorescence images of up to five distinct markers of interest. Finally, we provide a Python code for the statistical analysis of the obtained single-cell data written and executed in Google Colab11 and shared as a Jupyter notebook. Our protocol and the SCAnED macro aim to provide skin researchers without advanced immunofluorescence and computing expertise with a practical tool to label and semi-automatically quantify cells and marker expression in human skin, focusing on the epidermal and dermal compartments.
Access restricted. Please log in or start a trial to view this content.
Protocol
1. Immunofluorescence labeling of E-cadherin, VIM, and CD90 and nuclear staining with DAPI in paraffin-embedded skin sections
NOTE: The protocol shows steps for paraffin-embedded sections. For fresh and frozen tissue samples, fix the tissue sections and continue with step 1.3 of the protocol.
- Melt paraffin using a fan or oven.
- Rehydrate sections by passing through graded alcohols with increasing water content (e.g., xylene → 100% ethanol → 85% ethanol → 70% ethanol → water).
- Perform antigen retrieval steps as appropriate for the antigens.
- Permeabilize tissue sections with 0.3% Triton X in PBS (3 x 20 min) (see Table 2).
- Wash slides with PBS (1 x 5 min).
- Encircle each sample with a hydrophobic slide marker pen to prevent liquid spillage and minimize the volume of reagents and let dry.
- Apply primary antibodies (buffer for Abs: PBS + 2% BSA) (see Table 1 and Table 2). Place slides in a humidified chamber box (wet box) and incubate overnight.
- Wash slides with 0.3% Triton X in PBS (3 x 5 min).
- Remove excess detergent by washing slides with PBS (1 x 5 min).
- Apply secondary antibodies and goat serum (see Table 1). Incubate slides in a dark place for 1 h.
- Wash slides with 0.3% Triton X in PBS (3 x 5 min).
- Remove excess detergent by washing slides with PBS (1 x 5 min).
- Add DAPI for nuclei staining (see Table 1). Incubate slides in a dark place for 30 min.
- Wash slides with 0.3% Triton X in PBS (3 x 5 min).
- Wash slides with PBS (1 x 5 min).
- Apply 1 droplet (~5-15 µL) of fluorescence mounting medium onto each sample and carefully place coverslips (remove bubbles if necessary). Allow slides to dry in the dark.
| Antibodies &Dye | Working concentration | Dilution |
| anti-Vimentin antibody | 0.8 µg/mL | 1:50 |
| anti-E-cadherin antibody | 1 µg/mL | 1:333 |
| anti-CD90 antibody | 1:1000 | |
| AF488 anti-mouse | 1:500 | |
| AF568 anti-rabbit | 1:500 | |
| AF647 anti-mouse | 1:500 | |
| DAPI | 1 µg/mL |
Table 1: Antibodies and dye.
| 1. Staining buffer | ||
| Reagent | Final concentration | Amount |
| BSA | 2% | 1 g |
| PBS | 1x | 50 mL |
| Total | n/a | 50 mL |
| 2. Permeabilization buffer | ||
| Reagent | Final concentration | Amount |
| Triton X | 0.30% | 300 µL |
| PBS | 1x | 100 mL |
| Total | n/a | 100 mL |
Table 2: Recipes for solutions.
2. Confocal imaging
NOTE: For this protocol, a confocal laser scanning microscope, equipped with a 10x objective (NA 0.4), and 4 laser lines (405 nm, 488 nm, 561 nm, 640 nm) was used.
- Acquire images using a fluorescence microscope (see example image in Figure 1).
- Use the following scan size parameter to create the macro, train the StarDist model, and ideally for image acquisition: Image size = 4,096 x 4,096 pixels (or 1,273 x 1,273 microns), bit depth = 16-bit, minimum pixel size = 0.3 microns, signal-to-noise ratio (SNR) = minimum of 3.

Figure 1: Immunofluorescence staining of skin section. DAPI: labels nuclei, CD90: fibroblast marker, E-cadherin: used to label epidermis, VIM: VIM-expressing cells, Merge: Merge of DAPI (magenta), CD90 (blue), E-cadherin (yellow), and VIM (green) staining. Scale bars = 100µm. Please click here to view a larger version of this figure.
3. Image analysis using the SCAnED macro (Supplemental File 1, Supplemental Video S1, and Supplemental Video S2)
- Start the macro (SCAnED.mp4 movie).
- Open immunofluorescence images in Fiji/ImageJ using Bio-Formats with default settings.
NOTE: Do not split channels at this step. - Download and run the SCAnED macro by navigating to Plugins | Macros | Run and select the SCAnED macro script (Supplemental File 1).
- Follow the step-by-step on-screen instructions provided by the macro.
- Open immunofluorescence images in Fiji/ImageJ using Bio-Formats with default settings.
- In silico segmentation of epidermis and dermis using the SCAnED macro.
- Select the E-cadherin channel when prompted.
- Adjust the threshold manually by navigating to Image | Adjust | Threshold and clicking OK for the E-cadherin channel to fully capture the epidermal region.
- If needed, confirm the Flood Fill step to close gaps in the E-cadherin mask by selecting the Flood Fill Tool icon in ImageJ, clicking on the upper part of the epidermis, and clicking OK (Supplemental Figure S1A-E and troubleshooting tips in the discussion section).
- If the mask is inverted, select Yes and OK when prompted to invert the selection; otherwise, select No and OK (see Supplemental Figure S1F,G and troubleshooting tips in the discussion section).
- Select the DAPI channel when prompted. The nuclei images before and after epidermal-dermal segmentation are shown in Figure 2.
- Nuclei segmentation using the threshold function
- Auto-define intensity levels.
- Nuclei segmentation using StarDist
- Open StarDist in ImageJ (Figure 3).
- Load the nuclei detection model (Supplemental File 2) into the StarDist GUI (Figure 4). The corresponding training pair for creating the StarDist model is shown in Supplemental Figure S2.
NOTE: Tensor Flow version 1.15 should be used for this model if StarDist error occurs (see Supplemental Figure S3). - Click on the nuclei channel first.
- Adjust tile settings accordingly (ensure the number of tiles matches the expected patch size (256 x 256 px) (see Figure 3 and Figure 4).
NOTE: StarDist segmentation may take time depending on the number of nuclei.
- Intensity measurement and quantification of nuclear proteins
NOTE: Before running the SCAnED, go to Analyze | Set Measurements and configure the parameters to ensure accurate and relevant data output (Figure 5).- When prompted, select Yes to measure marker intensity in nuclei.
- Choose the appropriate marker channel (up to five possible).
- Save the results as CSV files as instructed by the macro.
- Repeat for each channel.
- After all channels are processed, save the results as CSV files as instructed by the macro.
NOTE: For better visualization, we included a magnified view of a specific skin region for the rest of analysis (Figure 6).
- Cell segmentation (cytoplasmic region)
NOTE: The cell segmentation is based on expanding the nuclear ROI and must therefore be initiated after nuclei segmentation.- When the threshold function has been used for nuclei segmentation, apply binary dilation.
- When StarDist has been used for nuclei segmentation, use enlargement expansion, which has a longer processing time (see Supplemental Figure S4).
- Intensity measurement and quantification of cytoplasmic proteins
- Select Yes to measure marker intensity in whole cells.
- Save the result CSV files as instructed by the macro.
- Repeat for each marker channel in order.
- Keep the same order of channels for both nucleus and cell measurements to maintain consistency in the output data.
- Choose Discard whenever the macro prompts, to avoid mixing nuclei data between epidermis and dermis. Figure 7 illustrates all steps of the Threshold-based segmentation.

Figure 2: Channel-specific nuclei analysis and separation in epidermal and dermal nuclei. Immunofluorescence staining of DAPI demonstrates the morphology and spatial distribution of nuclei in whole skin (left image). Nuclei channel representation of epidermal nuclei stained with DAPI, providing insight into the distribution of nuclei within the epidermal compartment (middle image). Nuclei channel representation of dermal nuclei stained with DAPI, offering visualization of nuclei distribution within the dermal compartment (right image). Scale bars = 100µm. Please click here to view a larger version of this figure.

Figure 3: Utilizing the "StarDist" option. Screenshot highlighting the location of the "StarDist 2D" option within the menu/Plugins/StarDist/StarDist 2D. Please click here to view a larger version of this figure.

Figure 4: Instructions for Using the Nuclei Detection Model. Download the "nuclei_detection_model.zip" file and provide its file path in the Browse section. Please click here to view a larger version of this figure.
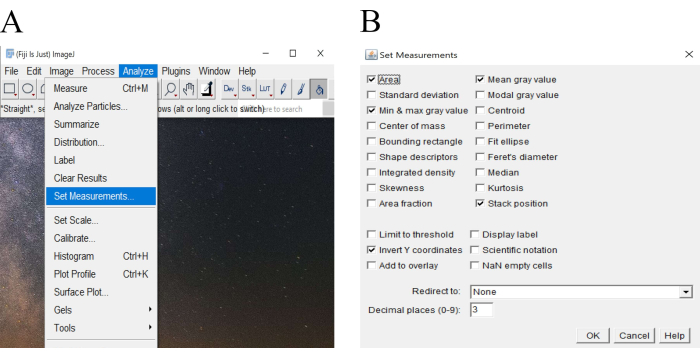
Figure 5: Configuring measurement settings. (A) Screenshot highlighting the location of the Set Measurements option within the menu, enabling customization of measurement parameters for subsequent analysis. (B) Set Measurements box displaying the interface for adjusting measurement settings, allowing users to specify parameters for data collection and analysis. Please click here to view a larger version of this figure.
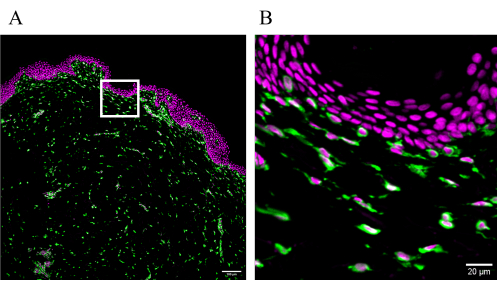
Figure 6: Magnified view of a specific region. (A) Merge of DAPI (magenta)and VIM (green) staining. (B) Magnified view of a specific region from A, providing detailed visualization of VIM expression within skin tissue. Please note the different morphology of nuclei within the epidermis and dermis. Scale bars = 100 µm (A), 20 µm (B). Please click here to view a larger version of this figure.

Figure 7: SCAnED segmentation in epidermis and dermis for nuclei and cells by using threshold. (A) Whole image: Merge of DAPI (magenta) and VIM (green) staining. Upper part: (B) Merge of epidermal nuclei stained with DAPI and VIM after separation. (C) Mask of epidermal nuclei by using threshold. (D) Nuclei segmentation of epidermal nuclei overlaid onto the merge of DAPI and VIM, aiding in the visualization of nuclei distribution within the epidermal compartment. (E) Cell segmentation of epidermal nuclei overlaid onto the merge of DAPI and VIM, aiding in the visualization of nuclei distribution within the epidermal compartment by using threshold and dilation, as it shows the selection region is bigger than nuclei. Lower part: (F) Merge of dermal nuclei stained with DAPI and VIM after separation. (G) Mask of dermal nuclei by using threshold. (H) Nuclei segmentation of dermal nuclei overlaid onto the merge of DAPI and VIM, aiding in the visualization of nuclei distribution within the dermal compartment. (I) Cell segmentation of dermal nuclei overlaid onto the merge of DAPI and VIM, aiding in the visualization of nuclei distribution within the dermal compartment. Scale bars = 20 µm. Please click here to view a larger version of this figure.
4. Classification and visualization of extracted single-cell data (Supplemental Video S3)
NOTE: Each immunofluorescence marker generates two CSV files: one for the epidermal compartment and one for the dermal compartment.
- Establish marker-specific intensity thresholds using isotype control samples.
- Import the CSV output files generated by the SCAnED macro into Google Colab using the provided Jupyter Notebook. At first, download the appropriate Jupyter Notebook (e.g., Supplemental File 3 or Supplemental File 4), go to Google Colab (https://colab.research.google.com/), click on File, open the notebook, select the file, run the code cells one by one. When prompted with Choose Files, click the button and upload the .csv file.
- For each antibody, calculate the mean fluorescence intensity from the isotype controls. To determine the cut-off for each antibody, open the DotPlot notebook (Supplemental File 4), upload the corresponding isotype control file, and run the code.
- Based on the distribution of dots in the isotype control and specific antibody plots, choose an appropriate intensity threshold to separate background (isotype control) from signal (specific staining). Use these values as cutoffs to classify individual cells as either positive or negative for marker expression.
- Compare marker intensities in experimental samples to the calculated thresholds.
- Classify cells with intensity ≥ threshold as positive.
- Classify cells with intensity < threshold as negative.
- Classify subpopulations based on combinations of marker expression, for example, identify single-positive, double-positive, or triple-positive cell populations.
- Visualize the distribution and relationships of marker expression using two types of plots:
- Create histograms and overlay histograms to compare the intensity distribution between conditions (e.g., control vs. diseased skin) by running the Histogram code (download the Supplemental File 3, go to Google Colab (https://colab.research.google.com/), click on File, open notebook, select the file, run the code) (Figure 8).
- Create dot plots to simulate flow cytometry-style scatter plots for assessing co-expression patterns by running the DotPlot code (download Supplemental File 4, go to the Google Colab (https://colab.research.google.com/), click on File, open notebook, select the file, run the code) (Figure 9).
- Export processed data for additional analyses and evaluation of significant differences using statistical tests.

Figure 8: Overlay histogram comparing mean intensity of VIM-positive cells. Histogram overlay comparing the mean intensity of VIM cells in healthy samples (H) in blue and psoriasis samples (P) in orange within the dermis. Please click here to view a larger version of this figure.

Figure 9: Double positive signals on a dot plot. A demonstration of double-staining dot plot that can help in better visualization of single-positive, double-positive, and double-negative populations. This example shows the double staining of CD90 and VIM in the dermis of (A) healthy and (B) psoriasis skin, and in the epidermis of (C) healthy and (D) psoriasis skin samples. Please click here to view a larger version of this figure.
Access restricted. Please log in or start a trial to view this content.
Results
In a previous study, we successfully used SCAnED to detect and quantify cells and expression levels of lysyl oxidase (LOX), a cytoplasmic protein, and the transcription factor hypoxia-inducible factor 1 (HIF-1) in cells within the dermis of human skin12 highlighting the applicability of this tool for skin research.
To further assess the precision of our skin segmentation macro in identifying cells and nuclei in the epidermal and dermal compartments, we stained paraffin-...
Access restricted. Please log in or start a trial to view this content.
Discussion
The SCAnED protocol is a semi-automated method for compartment-specific analysis of both immune and non-immune cells in human skin tissue. The workflow integrates an E-cadherin-based staining protocol to enable epidermis and dermis segmentation, DAPI-based nuclei and cell detection, followed by the quantification of marker expression in nuclei and cells using our ImageJ-based macro. Further, we guide users through the analysis of our Python workflow to visualize extracted single-cell data. The protocol is flexible and su...
Access restricted. Please log in or start a trial to view this content.
Disclosures
The authors declare no competing financial interests.
Acknowledgements
The development of this image analysis pipeline was funded by the Land Niederösterreich as part of the Danube Allergy Research Cluster and by the Fellinger Krebsforschung.
Access restricted. Please log in or start a trial to view this content.
Materials
| Name | Company | Catalog Number | Comments |
|---|---|---|---|
| 0.3% Triton X | Sigma-Aldrich | T9284 | |
| BSA (Bovine serum albumin) | Sigma Aldrich | ||
| CD90 | cell signaling | D3V8A | |
| DAPI | Roche | 10236276001 | |
| Deionized water | |||
| E-cadherin | Abcam | ab1416 | |
| Fluorescence mounting medium | Dako | S3023 | |
| Goat anti-Mouse IgG1 Cross-Adsorbed Secondary Antibody, Alexa Fluor 488 (AF 488 anti-mouse) | Thermo Fisher Scientific | A-21121 | |
| Goat anti-Mouse IgG2a Cross-Adsorbed Secondary Antibody, Alexa Fluor 647 (AF 647 anti-mouse) | Thermo Fisher Scientific | A-21241 | |
| Goat anti-Rabbit IgG (H+L) Cross-Adsorbed Secondary Antibody, Alexa Fluor 568 ( AF 568 anti-rabbit) | Thermo Fisher Scientific | A-11011 | |
| Goat serum | Agilent Technologies Österreich GmbH, Dako | X0907 | |
| PBS | Gibco | 14190-094 | |
| Vimentin | Dako | M7020 | |
| Materials | |||
| Chamber box (wet box) | |||
| Coverslips | Thermo Fisher | ||
| Liquid-repelling slide marker pen for staining (hydrophobic) | Daido Sangyo | Z377821 | 24x50mm |
| Solutions | |||
| Permeabilization buffer (0.3% Triton X in PBS) | Refer to Table 2 | ||
| Staining buffer (2% BSA in PBS) | Refer to Table 2 | ||
| Software and Datasets | |||
| Confocal laser scanning microscope | Olympus | FV3000 based on inverted IX83 | equipped with a 10x objective (NA 0.4), 4 laser lines (405 nm, 488 nm, 561 nm, 640 nm, Coherent) |
| Fiji (ImageJ) | V1.54h | ||
| Google Colab | |||
| GraphPad Prism | GraphPad Software Inc. | Prism 10 | for further statistical analysis |
| HALO | Indica Labs | ||
| Python program | Python 3.11.12 | ||
| QuPath | open software ( Bankhead, P. et al, https://doi.org/10.1038/s41598-017-17204-5) | v0.5.1 | |
| StarDist | Install TF1.15.0 CPU version |
References
- Lichtenberger, B. M., Kasper, M. Cellular heterogeneity and microenvironmental control of skin cancer. J Intern Med. 289 (5), 614-628 (2021).
- Watt, F. M. Mammalian skin cell biology: at the interface between laboratory and clinic. Science. 346 (6212), 937-940 (2014).
- Bergstresser, P. R., Pariser, R. J., Taylor, J. R. Counting and sizing of epidermal cells in normal human skin. J Invest Dermatol. 70 (5), 280-284 (1978).
- Régnier, M., Patwardhan, A., Scheynius, A., Schmidt, R. Reconstructed human epidermis composed of keratinocytes, melanocytes and Langerhans cells. Med Biol Eng Comput. 36 (6), 821-824 (1998).
- Régnier, M., Staquet, M. J., Schmitt, D., Schmidt, R. Integration of Langerhans cells into a pigmented reconstructed human epidermis. J Invest Dermatol. 109 (4), 510-512 (1997).
- Bankhead, P., et al. QuPath: Open source software for digital pathology image analysis. Sci Rep. 7 (1), 16878(2017).
- McQuin, C., et al. CellProfiler 3.0: Next-generation image processing for biology. PLoS Biol. 16 (7), e2005970(2018).
- Berg, S., et al. ilastik: interactive machine learning for (bio)image analysis. Nat Methods. 16 (12), 1226-1232 (2019).
- Schindelin, J., et al. Fiji: an open-source platform for biological-image analysis. Nat Methods. 9 (7), 676-682 (2012).
- Schmidt, U., Weigert, M., Broaddus, C., Myers, G. Cell detection with star-convex polygons. Medical Image Computing and Computer Assisted Intervention - MICCAI 2018. Frangi, A., Schnabel, J., Davatzikos, C., Alberola-Lopez, C., Fichtinger, G. 11071, Springer. Cham. Lecture notes in Computer Science 265-273 (2018).
- Google Colab. , Google. https://colab.research.google.com/ (2025).
- Balsini, P., et al. Stiffness-dependent lysyl oxidase regulation through hypoxia-inducing factor 1 drives extracellular matrix modifications in psoriasis. J Invest Dermatol. 1145 (7), 1653-1669.e10 (2024).
- Mahrle, G., Bolling, R., Osborn, M., Weber, K. Intermediate filaments of the vimentin and prekeratin type in human epidermis. J Invest Dermatol. 81 (1), 46-48 (1983).
- de Waal, R. M., Semeijn, J. T., Cornelissen, M. H., Ramaekers, F. C. Epidermal Langerhans cells contain intermediate-sized filaments of the vimentin type: an immunocytologic study. J Invest Dermatol. 82 (6), 602-604 (1984).
- Bata-Csorgo, Z., Hammerberg, C., Voorhees, J. J., Cooper, K. D. Flow cytometric identification of proliferative subpopulations within normal human epidermis and the localization of the primary hyperproliferative population in psoriasis. J Exp Med. 178 (4), 1271-1281 (1993).
- Nakamura, Y., et al. Expression of CD90 on keratinocyte stem/progenitor cells. British Journal of Dermatology. 154, 1062-1070 (2006).
- Wetzel, A., et al. Increased neutrophil adherence in psoriasis: role of the human endothelial cell receptor Thy-1 (CD90). J Invest Dermatol. 126 (2), 441-452 (2006).
- RRID:SCR_018350. , Indica Labs. https://www.indicalab.com/halo/ (2025).
Access restricted. Please log in or start a trial to view this content.
Reprints and Permissions
