In this study, we present an in vitro cell assay for identifying teratogenic chemicals. The dynamics of fibroblast growth factor (FGF)/serum response factor (SRF) signaling were measured in human induced pluripotent stem (iPS) reporter cells, and the risk of teratogenicity was evaluated by quantifying chemical disruption of this signaling pathway.
Method Article
Developmental Toxicity Assay Based on Real-Time Monitoring of Fibroblast Growth Factor Signal Disruption in Human Induced Pluripotent Stem Cells
In This Article
Summary
Abstract
Developmental toxicity (Devtox) is typically evaluated in animal models. However, there are challenges in ensuring accuracy, such as false negatives due to interspecies differences and ethical concerns regarding animal welfare. Therefore, there is a need for new test systems to evaluate human Devtox and help address these issues. We hypothesized that teratogens disrupt Devtox-related signaling pathways essential for morphogenesis, irrespective of their molecular targets. To test this hypothesis, we developed a fibroblast growth factor (FGF) reporter system using human induced pluripotent stem (iPS) cells. This system enables quantification of signal disruption caused by chemicals, achieving an accuracy rate of 83% for known teratogenic and non-teratogenic compounds. Because Devtox signaling activity changes over time, it is important to capture its dynamics continuously rather than measuring at a single endpoint. Use of a real-time luminescence measurement system is optional, but it enhances temporal resolution with less labor. The entire test can be completed within 1 week, from seeding cells in a culture plate to acquiring luminescence data.
Introduction
Some chemicals cause developmental toxicity (Devtox), including growth delays, malformations, functional deficits, and death1. Evaluating Devtox is essential to ensure the safety of pharmaceuticals and pesticides2. Current Devtox assays typically rely on multiple animal models. However, owing to interspecies differences, animal models have inherent limitations when extrapolating results to humans3. Thalidomide, a well-known developmental toxicant, was first prescribed to pregnant women in the late 1950s to relieve morning sickness. Although teratogenicity was not observed in rodents, severe limb malformations in human newborns were reported worldwide. This tragedy highlighted the limitations of animal-based safety testing and prompted international efforts to introduce and revise Devtox testing guidelines4. In addition, there are concerns related to animal welfare, as well as the substantial time and cost required for animal testing. Therefore, alternative in vitro assays that can accurately predict human Devtox are needed5.
Here, we propose an in vitro assay to evaluate developmental toxicants based on disruption of signaling pathways that are critical for embryonic development6,7,8. The assay is performed using human induced pluripotent stem cells (iPSCs) genetically engineered to express NanoLuc luciferase (Nluc), a luminescent reporter gene, under the control of the serum response element (SRE). The SRE is the binding site for serum response factor (SRF), a transcription factor in the fibroblast growth factor (FGF) signaling pathway. SRF integrates signals from multiple ligands and regulates the expression of more than 200 genes that play essential roles in diverse biological processes, including embryonic development9.
In this assay, reporter cells were exposed to a test chemical and stimulated with FGF to activate signaling and amplify any interference by the chemical. A key feature of this assay is capturing the dynamics of signaling activity as luminescence intensity changes. Because signaling activity varies over time, endpoint measurements at a single time point can be inaccurate10. Indeed, measurements at seven time points over a 24-h period demonstrated improved predictive accuracy, with an area under the curve (AUC) value of 0.837.
Test chemicals can be applied at a broad range of concentrations, from 0.01 ng/mL to 1000 µg/mL, depending on cytotoxicity and solubility. Approximately 1.4 × 10⁴ cells are required to seed a single 96-well plate. A limitation of this assay is that teratogenic chemicals may not be detectable if they act through targets not expressed in undifferentiated human iPS cells. In addition, this assay may not capture teratogenic metabolites. Moreover, it does not provide information on the detailed mechanisms underlying teratogenic toxicity or its specific outcomes.
Use of a real-time luminescence monitoring system further improves time resolution, reduces labor required for continuous measurements, and minimizes artifacts from repeated handling of culture plates. Here, we present a detailed protocol for the signal disruption-based Devtox assay. The entire procedure can be completed within one week. This approach can be automated, making it suitable for chemical screening and contributing to a reduction in animal testing.
Protocol
Human iPS cells (201B7) were used in this study, with the Nluc gene under the control of a serum response element (SRE) knocked into the Adeno-Associated Virus Integration Site 1 (AAVS1) locus using the CRISPR-Cas9 system (Figure 1A). The details of gene editing for reporter cells (SRE-Nluc-knocked-in human iPS cells) have been reported elsewhere6. The protocol is mainly divided into three steps: 1) a cytotoxicity assay of a chemical to determine its maximum exposure concentration, 2) signal disruption testing, and 3) data analysis.
To minimize the influence of medium evaporation, perform all cell culture experiments using the central 60 wells of a 96-well plate, and add water to the outermost wells and inter-well spaces. Cover the plate with a gas-permeable sealing film during incubation to further reduce evaporation.
1. Cell preparation
- Culture reporter cells for at least 2 weeks after thawing frozen stock. Maintain cells on a 7-day repeat schedule and use day-7 cells for the assay. Optimize seeding density to ~80% confluence on the passage day.
- Seed single cells at 2.0 × 10⁵ cells/well in an ECM-coated six-well plate with 2 mL of fresh maintenance medium supplemented with 10 µM ROCK inhibitor.
- After 24 h, replace the medium with 2 mL/well of fresh maintenance medium.
- At 72 h, collect cells using an enzyme-based dissociation reagent to obtain a single-cell suspension. Seed at 1.0 × 10⁵ cells/well in an ECM-coated six-well plate with 2 mL of fresh maintenance medium supplemented with 10 µM ROCK inhibitor.
- After 24 h, replace medium with 4 mL/well of fresh maintenance medium.
- After 96 h, collect cells as a single-cell suspension using an enzyme-based dissociation reagent. Use these cells for the reporter assay.
2. Cytotoxicity assay
- Preliminary test
- Seed single cells at 2.0 × 10⁴ cells/well in an ECM-coated 96-well plate with 200 µL of fresh maintenance medium supplemented with 10 µM ROCK inhibitor. Seal the plate with a gas-permeable film.
- At 24 h, replace the medium with 200 µL/well of fresh maintenance medium and reseal the plate with a gas-permeable film.
- At 72 h, replace the medium with 100 µL/well of assay medium and reseal the plate with a gas-permeable film.
- At 96 h, replace the medium with 100 µL/well of assay medium.
NOTE: If 100% confluence is not achieved, discontinue the assay. Because growth rate may vary by cell line, optimize seeding density to ensure full confluence on the assay day. - Dissolve the test chemical in assay medium to its maximum solubility.
NOTE: When dimethyl sulfoxide (DMSO) is used as the solvent, the final DMSO concentration must not exceed 0.1%. - Prepare a five-point, five-fold serial dilution of the test chemical in assay medium using the solution from Step 2.1.5.
- Add 11 µL/well of the chemical solutions from Step 2.1.6. For the vehicle control, add 11 µL/well of assay medium containing the same DMSO concentration.
- After 48 h, incubate the plates at 25 °C for 30 min.
- Add 111 µL/well of pre-equilibrated ATP-based luminescent cell viability assay reagent at 25 °C. For the blank, prepare a well containing 111 µL of assay medium and 111 µL of the reagent.
- Shake the plate at 300 rpm for 2 min using a microplate shaker.
- Transfer 200 µL of the mixture to a black plate for luminescence measurement. Incubate the plates at 25 °C for 10 min.
- Measure luminescence intensity to estimate the cell count.
- Calculate cell viability using the following formula:
Cell viability (%) = (RLU_sample − RLU_blank) / (RLU_vehicle − RLU_blank) × 100
NOTE: Determine subsequent steps based on cell viability. If viability is >50% at all tested concentrations, proceed to Step 2.2 with the maximum solubility concentration. If viability crosses 50% within the tested range, proceed to the determination test using the highest concentration with viability >50%. If viability is <50% at all concentrations, repeat the preliminary test starting from a lower concentration.
- Determination test
- Seed single cells at 2.0 × 10⁴ cells/well in an ECM-coated 96-well plate with 200 µL of fresh maintenance medium supplemented with 10 µM ROCK inhibitor. Seal the plate with a gas-permeable film.
- At 24 h, replace the medium with 200 µL/well of fresh maintenance medium and reseal the plate with a gas-permeable film.
- At 72 h, replace the medium with 100 µL/well of assay medium and reseal the plate with a gas-permeable film.
- At 96 h, replace the medium with 100 µL/well of assay medium.
NOTE: If 100% confluence is not achieved, discontinue the assay. Optimize seeding density to ensure full confluence on day 4. - Dissolve the test chemical in assay medium according to the results of the preliminary test (Step 2.1).
- Prepare a nine-point, two-fold serial dilution of the test chemical in assay medium using the solution from Step 2.2.5.
- Add 11 µL/well of the chemical solutions from Step 2.2.6. For the vehicle control, add 11 µL/well of assay medium containing the same DMSO concentration.
- After 48 h, incubate the plates at 25 °C for 30 min.
- Add 111 µL/well of pre-equilibrated ATP-based luminescent cell viability assay reagent at 25 °C. For the blank, prepare a well containing 111 µL of assay medium and 111 µL of the reagent.
- Shake the plate at 300 rpm for 2 min using a microplate shaker.
- Transfer 200 µL of the mixture to a black plate for luminescence measurement. Incubate the plates at 25 °C for 10 min.
- Measure luminescence intensity to estimate the cell count.
- Calculate cell viability using the following formula:
Cell viability (%) = (RLU_sample − RLU_blank) / (RLU_vehicle − RLU_blank) × 100 - Generate a dose-response curve using data from nine concentrations and calculate the IC50 from the curve.
3. Real-time reporter assay (Figure 1B)
- Seed single cells at 2.0 × 10⁴ cells/well in an ECM-coated 96-well plate with 200 µL of fresh maintenance medium supplemented with 10 µM ROCK inhibitor. Seal the plate with a gas-permeable film.
- At 24 h, replace the medium with 200 µL/well of fresh maintenance medium and reseal the plate with a gas-permeable film.
- At 72 h, replace the medium with 100 µL/well of assay medium and reseal the plate with a gas-permeable film.
- At 96 h, replace the medium with 100 µL/well of assay medium containing 1% luminescent substrate.
NOTE: If 100% confluence is not achieved, discontinue the assay. Because growth rate may vary by cell line, optimize seeding density to ensure full confluence on day 4. - Dissolve the test chemical in assay medium at the concentration determined in Section 2.
- Prepare an eight-point, two-fold serial dilution of the test chemical in assay medium, starting from the solution prepared in Step 3.5.
- Two hours after the medium exchange in Step 3.4, add 11 µL/well of the chemical solutions from Step 3.6. For the vehicle control, add 11 µL/well of assay medium containing the same DMSO concentration.
- One hour after starting chemical exposure (Step 3.7), add 12 µL/well of assay medium containing bFGF to a final concentration of 2 ng/mL.
- Measure luminescence continuously for 48 h using a real-time luminescence measurement system under a humidified atmosphere, 5% CO2 at 37 °C.
NOTE: Set time 0 at the point of FGF addition (see Figure 1B).
4. Data analysis (Figure 1C)
- Calculate the log2 fold change (LogFC) of luminescence intensity by normalizing the test group to the vehicle control:
LogFC = log2(Luc_sample / Luc_vehicle) - Integrate LogFC over the 48-h time series to estimate the area between the curves (ABC) for the test and vehicle control groups.
- Sum of ABC values across all concentrations to quantify the overall extent of signal disruption caused by the test chemical.
- Perform receiver operating characteristic (ROC) curve analysis to determine the threshold for Devtox classification.
Results
In our experience, cell morphology is useful for determining whether an assay has been performed correctly. Figure 2A shows typical confocal microscopy images of cells immediately before and after chemical exposure. At the end of the assay, nearly the entire surface of the wells is covered by cells. Figure 2B shows images of live/dead cell staining. The number of dead cells stained with propidium iodide (PI) increases after chemical exposure; however, cell viability is at least 50%, and almost all cells are stained with calcein-AM.
Table 1 lists the test chemicals used in our previous studies7,8. These studies demonstrate that Devtox chemicals can be distinguished with improved accuracy based on the disruption of the FGF signal in human iPS cells. A key finding is that continuous monitoring of signaling activity is critical because it changes dynamically over time. The use of a real-time luminescence measurement system provides considerably higher time resolution with less measurement labor. Here, we describe a protocol that uses a real-time monitoring system.
Figure 3A shows changes in luminescence intensity over 48 h in six replicate wells under the same conditions without the test chemical. The six curves are nearly aligned, indicating good well-to-well reproducibility. Although not clearly identified in 24-h manual measurements in our previous studies, two distinct peaks -- an initial peak immediately after FGF ligand addition and a second peak at approximately 24 h -- appear in 48-h real-time measurements. Figure 3B shows changes in luminescence intensity upon exposure to valproic acid (VPA), a well-known developmental toxicant. VPA is a histone deacetylase inhibitor that causes defects in the neural tube, heart, and limb¹¹. VPA disrupts FGF signaling in a concentration-dependent manner. The automated real-time measurement system captured signal dynamics more accurately than manual measurements.
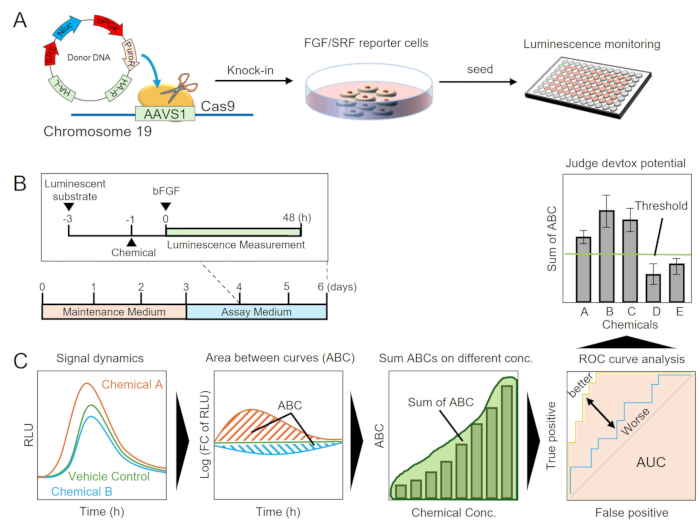
Figure 1: FGF/SRF signal disruption assay. (A) Genetic engineering of human iPS cells to generate FGF/SRF signal reporter cells. A plasmid was constructed containing Nluc downstream of the serum response element, homologous arms for targeted knock-in, and the puromycin resistance gene under the control of the human phosphoglycerate kinase promoter. Following puromycin selection, SRE-Nluc reporter cells were established. (B) Time schedule of the assay. The reporter cells were seeded in a 96-well plate and grown for 4 days to cover the entire surface. The luminescent substrate and test chemical were added 3 and 1 h before starting the measurement, respectively. The time of FGF ligand addition was set as 0 h, and luminescence intensity was continuously measured over the following 48 h. (C) Data analysis. Signal dynamics were recorded in cells exposed and unexposed to test chemicals and normalized to the vehicle control to estimate the area between curves as the degree of as a measure of signal disruption caused by a chemical. ABC values were obtained for each chemical at different concentrations, and their sum was calculated. Receiver operating characteristic curve analysis was performed using all known developmental toxicants tested to determine the threshold. Abbreviations: iPS = induced pluripotent stem cells; RLU = Relative Light Unit; AUC = Area under the curve; FGF = fibroblast growth factor; SRF = serum response factor; SRE = serum response element; HA = homologous arm; L = left; R = right; PuroR = puromycin resistance gene; hPGK = human phosphoglycerate kinase; Nluc = NanoLuc luciferase; ROC = receiver operating characteristic; ABC = area between the curves. Please click here to view a larger version of this figure.
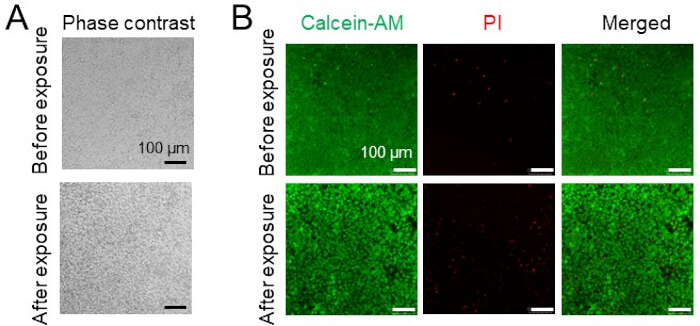
Figure 2: Cell morphology and live/dead cell staining. (A) Confocal microscopic images of cells before (day 4) and after (day 6) exposure to a test chemical. Remaining cells covering almost the entire surface of the wells after the test are an indicator of a successful test run. Nearly complete well coverage at the end of the assay indicates a successful run. (B) Live/dead cell staining before and after exposure to a test chemical. Live cells were stained green with Calcein-AM, and dead cells were stained red with propidium iodide (PI). were stained with calcein-AM (green), and dead cells with propidium iodide (PI, red). The proportion of dead cells should be less than should be < 50% of the total cells. Scale bars = 100 µm. Please click here to view a larger version of this figure.
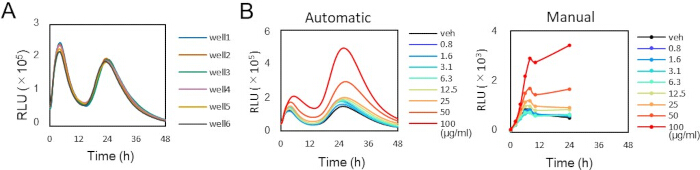
Figure 3: Typical examples of luminescence intensity dynamics. (A) Time-course luminescence changes the time course of luminescence after FGF ligand stimulation, measured using a real-time luminescence measurement system. Luminescence intensity was monitored every 22 min for 48 h. The six colored lines represent signals from different wells. (B) Comparison of manual and real-time luminescence measurements with valproic acid. Signal disruption was observed with both measurement methods, while real-time monitoring more clearly captured the enhanced signal at the second peak. Abbreviations: RLU = Relative Light Unit; VPA = valproic acid; FGF = fibroblast growth factor. Please click here to view a larger version of this figure. Please click here to download this Table.
| Test Chemical | Abbreviation | Cas NO. | Animal study (previous study) | In vitro study (this study) | Sum of ABC values | Max Concentration (µg/mL) |
| all-trans-Retinoic acid | ATRA | 302-79-4 | P | P | 65.9 | 0.0100 |
| Hydroxyurea | HU | 127-07-1 | P | P | 63.3 | 149 |
| Methoxyacetic acid | MAA | 625-45-6 | P | P | 225 | 683 |
| Methylmercury chloride | MeHg | 115-09-3 | P | P | 77.7 | 1.20 |
| Methotrexate hydrate | MTX | 133073-73-1 | P | P | 80.5 | 5.00 |
| Sodium salicylate | SA | 54-21-7 | P | P | 38.7 | 666 |
| valproic acid | VPA | 99-66-1 | P | P | 63.3 | 100 |
| 6-Aminonicotinamide | 6-AN | 329-89-5 | P | N | 24.9 | 1.00 |
| Boric acid | BA | 10043-35-3 | P | N | 24.2 | 250 |
| 5-Bromo-2'-deoxyuridine | BrdU | 59-14-3 | P | P | 83.9 | 50.0 |
| 5,5-Dimethyl-2,4-oxazolidinedione | DMO | 695-53-4 | P | P | 50.3 | 840 |
| Lithium cloride | LiCl | 7447-41-8 | P | N | 29.8 | 250 |
| 5-Fluorouracil | 5-FU | 51-21-8 | P | P | 92.4 | 2.65 |
| Cyclophosphamide monohydrate | CPA | 6055-19-2 | P | N | 19.1 | 400 |
| Imatinib mesylate | IMA | 220127-57-1 | P | P | 42.4 | 12.5 |
| Lenalidomide | LEN | 191732-72-6 | P | P | 94.7 | 35.0 |
| Pomalidomide | POM | 19171-19-8 | P | P | 50.9 | 2.50 |
| Thalidomide | THA | 50-35-1 | P | P | 53.3 | 12.0 |
| Acrylamide | AcA | 79-06-01 | N | N | 37.1 | 454 |
| D-Camphor | CAM | 464-49-3 | N | N | 27.5 | 50.0 |
| Diphenhydramine hydrochloride | DHM | 147-24-0 | N | P | 68.2 | 262 |
| Dimethyl pthalate | DMP | 131-11-3 | N | N | 24.4 | 100 |
| Penicillin G sodium salt | PenG | 69-57-8 | N | N | 22.1 | 1000 |
| Sodium saccharin | SAC | 82385-42-0 | N | N | 34.0 | 1000 |
| Acetaminophen | APAP | 103-90-2 | N | N | 22.3 | 20.0 |
| Amoxicillin trihydrate | AMX | 61336-70-7 | N | N | 28.4 | 25.0 |
| Cimetidine | CM | 51481-61-9 | N | N | 25.3 | 30.0 |
| Erythromycin | ERY | 114-07-8 | N | N | 20.0 | 15.0 |
| Hydrochlorothiazide | HCTZ | 58-93-5 | N | N | 21.9 | 20.0 |
| Sulfasalazine | SSZ | 599-79-1 | N | N | 30.8 | 100 |
| Chemical | AUC | Threshold | Sensitivity | Specificity | Accuracy | |
| 30 substances | 0.819 | 37.9 | 0.778 | 0.917 | 0.833 |
Table 1: Devtox and non-Devtox chemicals classified within animal experiments and outcomes estimated with and without FGF signal disruption. Abbreviations: P = positive (Devtox); N = negative (non-Devtox).
Discussion
Embryonic-fetal development is tightly regulated by signaling networks12. While feedback within these networks provides robustness against internal and external noise, we hypothesized that Devtox chemicals can exert effects beyond such buffering. Here, we present a protocol for estimating Devtox chemicals based on excessive disruption of FGF/SRF signaling. This approach does not provide any information regarding the molecular mechanisms responsible for Devtox, such as the target proteins of a chemical, and it focuses only on FGF/SRF signaling. Nevertheless, it was possible to classify Devtox chemicals efficiently, with an accuracy of 83% and an AUC of 0.819 (Table 1). This is probably because each signaling pathway is closely associated with others and forms dense signaling networks, and disruption within these networks results in FGF/SRF signal disruption.
Several technical challenges must be addressed when generating reporter cells. Nluc is approximately 100 times brighter than conventional luciferases derived from fireflies or Renilla, allowing continuous long-term monitoring of signal changes13. Nluc containing the PEST sequence was used to more accurately capture the dynamics of signaling activity. The PEST sequence promotes protein degradation. While the Nluc protein is stable with a half-life of more than 6 h, the PEST tag accelerates degradation via the ubiquitin-proteasome pathway, reducing its half-life to 10-30 min. Furthermore, the reporter gene was knocked into the AAVS1 locus, a genomic "safe harbor," ensuring that expression is not silenced and that essential genes are not accidentally disrupted14.
In the evaluation of testing methods, it is crucial to select reference chemicals for Devtox and non-Devtox. We selected reference chemicals from lists in the ECVAM international validation study, ICH S5 guidelines (including thalidomide), and animal studies7. We listed 30 Devtox and non-Devtox chemicals, but more chemicals from reliable sources need to be added and tested. Therefore, the ROC threshold (Sum ABC = 37.9) reported here should be considered preliminary and will require validation with a larger, independent set of compounds to ensure statistical robustness. Cyclophosphamide (CPA) was one of three chemicals with false-negative results. CPA is hydroxylated in the liver to 4-hydroperoxycyclophosphamide, and CPA and its degradation products are teratogenic15. In vitro assays, including our approach, typically do not consider metabolism and cannot detect chemicals that induce Devtox via metabolism. This is a limitation of the proposed approach. In addition to metabolism-dependent false negatives (e.g., CPA), we also observed a false positive with diphenhydramine hydrochloride (DHM). Epidemiological evidence does not strongly support a causal association between DHM and congenital malformations, yet several in vitro studies have classified it as a developmental toxicant; this likely contributed to its misclassification in our assay. Conversely, 6-aminonicotinamide (6-AN) did not disrupt FGF/SRF signaling and was therefore misclassified, suggesting that its mechanism of developmental toxicity may proceed via pathways not captured by this reporter. Together, these examples support expanding the assay panel to include additional developmental signaling pathways to reduce both false positives and false negatives.
Several factors have a major influence on this assay. One such factor is cell preparation before the assay. To minimize this, cells were maintained on a 7-day repeat schedule to ensure that cells used in the assay were collected under the same growth conditions. Cells are seeded on Monday, passaged on Thursday, and a portion is used for the assay and seeded for the next passage. Another factor is the cell density at the time of exposure to a test chemical. The assay was performed only when the cells reached 100% confluence on the day of chemical exposure. Edge effects in 96-well plates are well known. In this assay, only the inner 60 wells of the 96-well plate were used to avoid edge effects. In addition to general considerations, technical variability can occur during an assay. A common issue was inconsistent luminescence intensity among the wells in the vehicle control group, which may have resulted from uneven cell seeding or suboptimal cell quality. We recommend maintaining the cells at approximately 80% confluence to minimize this variability and verifying uniform growth across wells the day after seeding. Adjusting the iPSC seeding density can also enhance assay reproducibility. In addition, excessive cell death can lead to non-specific luminescence fluctuations unrelated to the experimental signal. Therefore, assess cell morphology at the end of the assay to ensure cells are in an appropriate condition during measurement. In manual assays, removing the plate from the incubator at each time point exposes the cells to brief changes in temperature and CO2 levels. To limit these environmental fluctuations, measurements should be performed quickly and consistently.
This assay can be performed manually or using a real-time measurement system. The manual approach does not require specialized equipment, but a real-time measurement system enables more precise detection of signal dynamics. Although not identified in the manual measurements, the real-time measurement system clearly captured two peaks of the luminescence signal. In the manual measurements, a 12 h gap in data acquisition occurred during the nighttime, which may have led to the underestimation or loss of the second peak. These two peaks may be caused by negative feedback from FGF signaling and the presence of a thermally stable FGF ligand. Notably, the FGF signal disruption by a chemical sometimes appeared to be larger in the second peak than in the first peak (Figure 3B).
This protocol represents a promising approach for Devtox chemical screening using a human iPSC-based reporter assay to quantitatively assess FGF signal disruption. Several alternative in vitro assays for developmental toxicity have been developed over the past few decades, including the mouse embryonic stem cell test (mEST)16, Hand1-based embryonic stem cell test (Hand1-EST)17, and ReProGlo18. Compared with these conventional assays, this method demonstrated superior predictive accuracy. In recent years, alternative strategies such as those employing human embryonic stem cells or zebrafish embryos have been introduced as part of international efforts to establish non-animal testing systems. These approaches have also reported high predictive accuracy for developmental toxicity assessments. To further improve the performance of this assay, incorporating additional signaling pathways involved in embryonic development may be beneficial. There are several other major signaling pathways in developmental morphogenesis, such as Wnt/β-catenin, BMP/SMAD, and Hedgehog/GLI signaling19. Different combinations of reporter cells used to assess these signaling pathways may provide a more comprehensive assessment of various chemicals. The effect of the differentiation stage of iPS cells, for example, the earliest stage when the three germ layers are formed-on the detection sensitivity of this assay will be our future research topic. Future studies may also explore cross-species validation using rodent or rabbit stem cell systems to enable direct comparison with in vivo datasets in those species, while our primary focus remains on human iPS cells to maximize human relevance.
Disclosures
The authors have no conflicts of interest to disclose.
Acknowledgements
This work was supported by JSPS, Japan [KAKENHI grant numbers 23K25021 and 25K03278]; MHLW, Japan [program grant numbers 23KD1003 and 24KD1003]; KISTEC, Japan; and AMED, Japan [grant numbers JP23mk0101252 and 25mk0121314].
Materials
| Name | Company | Catalog Number | Comments |
|---|---|---|---|
| 1.5 mL Microcentrifuge Tube | FastGene | FG-MCT015C | Test chemical preparation |
| 15mL centrifuge tube | VIOLAMO | 1-3500-21 | Cell culture |
| 8-strip PCR Tube | Watson | 137-333C | Test chemical preparation |
| 96 Well White/Clear Bottom Plate, TC Surface | Thermo Fisher Scientific | 165306 | Cell culture and luminescence measurements |
| Black Microplate Flat Bottom 96Well | ASONE | 3-3321-04 | For luminescence measurement in cytotoxicity assays |
| Breathe-EASIER | TOHO | BERM-2000 | Gas-permeable sealing film |
| CellTiter-Glo Luminescent Cell Viability Assay | Promega | G7572 | Cytotoxicity assay |
| Centrifuge 5702 R | Eppendorf | Centrifugation | |
| ClipTip 300, Filtered, Sterile, Rack | Thermo Fisher Scientific | 94420513 | |
| ClipTip 50, Filtered, Sterile, Rack | Thermo Fisher Scientific | 94420253 | |
| Countess 3 FL Automated Cell Counter | Invitrogen | Cell counting | |
| Countess Cell Counting Chamber Slides | Invitrogen | C10312 | Cell counting |
| Culture Sure DMSO | FUJIFILM Wako | 031-24051 | Solvent for chemicals |
| CultureSure Y-27632 | FUJIFILM Wako | 036-24023 | ROCK inhibitor for iPSC seeding |
| DMEM/F12 HEPES, no phenol red | Thermo Fisher Scientific | 11039-021 | Coating for iPS cell culture |
| F1-ClipTip Multichannel Pipettes, 30 to 300 µL | Thermo Fisher Scientific | 4661180N | |
| F1-ClipTip Multichannel Pipettes, 5 to 50 µL | Thermo Fisher Scientific | 4661160N | |
| Filter chip | Watson | ||
| Geltrex LDEV-Free Reduced Growth Factor Basement Membrane Matrix | Thermo Fisher Scientific | A1413202 | Coating for iPS cell culture |
| HIENAI Mat 01R | COSMO BIO | HMAT01R | For maintaining plate temperature stability during cell culture handling |
| HIENAI Tube Warmer GX01 | COSMO BIO | TWGX013 | For keeping medium warm during experimental handling |
| Human Heat Stable bFGF Recombinant Protein | Thermo Fisher Scientific | PHG0367 | FGF stimulation for reporter assay |
| Human Induced Pluripotent Stem (iPS) Cells | 201B7 (RCB Cat# HPS0063, RRID: CVCL_A324) | RIKEN BRC Cell Bank | |
| Microplate shaker | TAITEC | 0089532-000 | Plate shaking for cytotocicity test |
| Multiplate reader | PerkinElmer | ARVO X4 | Luminescence measurement |
| Nano-Glo Endurazine Live Cell Substrate | Promega | N2571 | Luminescence substrate |
| PBS (-) | FUJIFILM Wako | 166-23555 | Cell culutre |
| Parafilim | AS One | 65-1681-93 | Stored for coating plate |
| Pipetto | eppendorf | ||
| WSL-1563 KronosHT | ATTO | 3510140 | Real-time luminescence measurement system |
| Reservoir | BMBio | BM-0850-1 | |
| STEMdif APEL2 Medium | STEMCELL Technologies | ST-05275 | Assay medium |
| StemFlex Medium | Thermo Fisher Scientific | A3349401 | Maintenance medium |
| Sterile Water, Endotoxin Free | FUJIFILM Wako | 196-15645 | Humidity control for iPS cell culture |
| Tissue Culture Plate VTC-P6 | VIOLAMO | 2-8588-01 | Cell culuture |
| TrypL Select Enzyme (1X), no phenol red | Thermo Fisher Scientific | 12563011 | Cell culture |
| Valproic acid | FUJIFILM Wako | 227-01071 | Test chemical |
References
- Gilbert-Barness, E. Teratogenic causes of malformations. Ann Clin Lab Sci. 40 (2), 99-114 (2010).
- DeSesso, J. M. Future of developmental toxicity testing. Curr Opin Toxicol. 3, 1-5 (2017).
- Teixidó, E., Krupp, E., Amberg, A., Czich, A., Scholz, S. Species-specific developmental toxicity in rats and rabbits: Generation of a reference compound list for development of alternative testing approaches. Reprod Toxicol. 76, 93-102 (2018).
- Vargesson, N. Thalidomide-induced teratogenesis: History and mechanisms. Birth Defects Res C Embryo Today. 105 (2), 140-156 (2015).
- van der Laan, J. W., Chapin, R. E., Haenen, B., Jacobs, A. C., Piersma, A. Testing strategies for embryo-fetal toxicity of human pharmaceuticals. Animal models vs. in vitro approaches: A workshop report. Regul Toxicol Pharmacol. 63 (1), 115-123 (2012).
- Kanno, S., et al. Luciferase assay system to monitor fibroblast growth factor signal disruption in human iPSCs. STAR Protoc. 3 (2), 101439(2022).
- Kanno, S., Okubo, Y., Kageyama, T., Yan, L., Fukuda, J. Integrated fibroblast growth factor signal disruptions in human iPS cells for prediction of teratogenic toxicity of chemicals. J Biosci Bioeng. 133 (3), 291-299 (2022).
- Kanno, S., et al. Establishment of a developmental toxicity assay based on human iPSC reporter to detect FGF signal disruption. iScience. 25 (2), 103770(2022).
- Miano, J. M. Role of serum response factor in the pathogenesis of disease. Lab Invest. 90 (9), 1274-1284 (2010).
- Purvis, J. E., Lahav, G. Encoding and decoding cellular information through signaling dynamics. Cell. 152 (5), 945-956 (2013).
- Paradis, F. -H., Hales, B. F. Exposure to valproic acid inhibits chondrogenesis and osteogenesis in mid-organogenesis mouse limbs. Toxicol Sci. 131 (1), 234-241 (2013).
- Bosman, S. L., Sonnen, K. F. Signaling oscillations in embryonic development. Curr Top Dev Biol. 149, 341-372 (2022).
- Hall, M. P., et al. Engineered luciferase reporter from a deep sea shrimp utilizing a novel imidazopyrazinone substrate. ACS Chem Biol. 7 (11), 1848-1857 (2012).
- DeKelver, R. C., et al. Functional genomics, proteomics, and regulatory DNA analysis in isogenic settings using zinc finger nuclease-driven transgenesis into a safe harbor locus in the human genome. Genome Res. 20 (8), 1133-1142 (2010).
- Hales, B. F. Comparison of the mutagenicity and teratogenicity of cyclophosphamide and its active metabolites, 4-hydroxycyclophosphamide, phosphoramide mustard, and acrolein. Cancer Res. 42 (8), 3016-3021 (1982).
- Genschow, E., et al. The ECVAM international validation study on in vitro embryotoxicity tests: Results of the definitive phase and evaluation of prediction models. Altern Lab Anim. 30 (2), 151-176 (2002).
- Suzuki, N., Ando, S., Yamashita, N., Horie, N., Saito, K. Evaluation of novel high-throughput embryonic stem cell tests with new molecular markers for screening embryotoxic chemicals in vitro. Toxicol Sci. 124 (2), 460-471 (2011).
- Uibel, F., et al. ReProGlo: A new stem cell-based reporter assay aimed to predict embryotoxic potential of drugs and chemicals. Reprod Toxicol. 30 (1), 103-112 (2010).
- Sanz-Ezquerro, J. J., Münsterberg, A. E., Stricker, S. Editorial: Signaling pathways in embryonic development. Front Cell Dev Biol. 5, 76(2017).
Reprints and Permissions
