Here we evaluate the effects of waste-derived biochars from coffee grounds, spent hops, spruce wood, and cigarette butts on soil health, assessing microbial activity, plant growth, and potential invertebrate ecotoxicity.
Research Article
Assessment of Waste-Derived Biochars on the Health and Biological Activity of Soil
In This Article
Summary
Abstract
Biochar is the product obtained by heating biomass through pyrolysis at high temperatures and has emerged as a common soil amendment based on its potential to improve soil properties such as water retention, pH, and nutrient availability. However, biochar prepared from certain waste materials can exert negative ecotoxicological effects on soil biota. The overall aim of this study was to evaluate the impact of selected biochars derived from coffee grounds, spent hops, spruce wood, and cigarette butts on soil health, focusing on microbial activity, plant growth, and potential ecotoxicity. Biochar-amended soils were incubated for 15 days in total, and a series of assays were performed, including dehydrogenase activity, bacterial quantification, a phytotoxicity bioassay using seeds of Sinapis alba, and an ecotoxicity test using Enchytraeus albidus. Biochar amendments can alter soil pH and impact water retention. Cigarette-butt biochar showed the highest stimulation of bacterial colonies, with counts reaching up to 1.00 × 10⁶ CFU/mL compared to 8.47 × 10⁴ CFU/mL across control replicates, whereas coffee-grounds biochar enhanced dehydrogenase activity (3.53 × 10⁻³ mU/g), implying higher microbial metabolic capacity. Phytotoxicity tests indicated that plant growth was enhanced by hops (162.96%) and spruce-wood biochars (206.66%), whereas higher application rates of cigarette-butt biochar suppressed seedling growth (62.36% inhibition). The ecotoxicity test with Enchytraeus albidus indicated that all biochars had a detrimental effect except the cigarette-butt biochar (33% stimulation). The findings of this study highlight that the effect of biochar on soil health is source-dependent, with important implications for soil management. The study reveals the need for biochar application adjustments based on concentration and type to maximize its benefits while minimizing potential hazards to soil systems.
Introduction
In recent years, biochar has emerged as a multifunctional and eco-friendly soil amendment applied in agriculture1, and as a means of mitigating global warming2. As the world grapples with land degradation, reduced crop productivity, and increased carbon emissions, biochar has emerged as a green alternative to conventional fertilizers3 and carbon-sequestration approaches4. In contrast to synthetic fertilizers, biochar inherently increases soil fertility5, reduces nutrient loss6, and increases water retention7, making it highly useful in regions with degraded or low-fertility soils. Additionally, biochar enhances microbial function by providing a stable habitat and carbon source for beneficial soil microorganisms, which are important for organic matter decomposition and nutrient cycling8.
Aside from agriculture, biochar also serves as a green solution for waste disposal as it converts biomass residues such as agricultural residues, forest residues, and food waste into long-term carbon material9. This not only limits the accumulation of waste but also offsets greenhouse gases through the capture of carbon, which would otherwise escape as carbon dioxide (CO2) or methane (CH4). Compared with other mechanisms for carbon sequestration, biochar offers a long-term, integrated soil strategy that mitigates atmospheric CO2 and supports healthy soils as well as high yields10.
Despite its recognized benefits -- such as soil fertility enhancement, water-holding capacity, and microbial-stimulating properties -- there are ongoing concerns regarding potential ecotoxicological effects on soil biota11. While biochar is generally positive for microbial activity and diversity, certain feedstocks or processing conditions can produce toxic compounds that harm soil microorganisms and their ecological function12.
To assess the potential risks of biochars, ecotoxicological evaluations are necessary. Bacteria (decomposers), plants (producers), and invertebrates (consumers) are among the taxonomic groups used in research on soil and sediment ecotoxicity. These taxa represent both terrestrial and aquatic environments13.
The complementary function of Enchytraeids with earthworms in soil ecosystem functioning is the basis for the development of bioassays for these organisms. In bioassays, Enchytraeids serve as terrestrial biological models to investigate the effects of chemicals like pesticides (e.g., dimethoate, atrazine, carbendazim) and trace metals (e.g., lead, zinc, copper, cadmium)14.
In addition to organism-based assays, microbial enzyme activity is another way to assess soil health. Soil dehydrogenase activity is an indicator of microbial oxidative activity15. Dehydrogenase testing in soil-biochar mixtures is effective for quantifying microbial activity and overall soil health. Since dehydrogenase enzymes are involved in microbial respiration, their activity reflects how biologically active the soil is. This is useful for assessing soil quality, fertility, and biochar's effect on microbes. The assay measures the reduction of triphenyltetrazolium chloride (TTC) to triphenyl formazan (TPF), which is determined spectrophotometrically. Higher TPF production is an indicator of higher microbial activity.
We expect that biochars produced from different feedstocks will have distinctive impacts on soil health. These effects will depend on their chemical and physical characteristics, which may alter the physicochemical parameters of soil, thus influencing microbial activity, plant growth, and soil organism toxicity.
In this study, we evaluate the effects of waste-derived biochars on multiple soil health metrics, including pH, microbial activity, plant growth, and invertebrate survival (Figure 1). Three concentrations (1%, 5%, 10% w/w) of four different waste-derived biochars were mixed with garden soil and assessed for the effects mentioned above. Moisture content, pH, and selection of test organisms were carefully controlled to ensure the study's ecological relevance.
Protocol
1. Biochar preparation
NOTE: See the Table of Materials for details about the biochars used here as test materials. Pyrolysis conditions, elemental composition, and proximate analysis data were provided by the producers (Table 1).
CAUTION: Always perform pyrolysis in a lab that is well-ventilated with proper exhaust or fume system. Wear heat-resistant gloves, lab coat, safety goggles, and wear a face shield if needed.
Table 1: Basic characteristics of the tested biochars. Please click here to download this Table.
2. Chemical characterization of biochar
- Analyze elemental composition of all biochars (done utilizing inductively coupled plasma atomic emission spectroscopy (ICP OES) or inductively coupled plasma mass spectrometry (ICP MS), based on the concentrations, following microwave-assisted decomposition (Table 2).
3. Preparation of soil-biochar mixtures
- Soil collection and experiment setup
- Collect topsoil from an experimental field.
- Remove surface debris manually. Sieve the soil to a particle size of less than 5 mm to remove debris.
- Weigh 100 g of sieved soil and add it to test containers.
- Biochar amendment and incubation
- Add 1 g, 5 g, or 10 g of each biochar type per 100 g of soil to create 1%, 5%, and 10% (w/w basis) soil-biochar amendment.
- Add distilled water to reach 60% of the maximum water holding capacity (WHC).
- Mix thoroughly using a spatula.
- Weigh each container and cover with parafilm to minimize evaporation.
- Incubate the mixtures at 27 °C for 10 days.
NOTE: This mixture will be used for water loss measurement, pH change, phytotoxicity, and bacterial quantification assays.
The used soil should be collected and disposed according to local biosolid protocols.
4. pH Measurement of soil-biochar mixtures
- Weigh 10 g of each soil-biochar mixture into 50 mL conical tubes.
- To the tubes, add 25 mL of distilled water.
- Shake the tubes for 30 s manually or use a vortex mixer at medium speed. Filter the mixture using Whatman No. 1 filter paper into a clean 100 mL beaker.
- Measure pH of the filtrate at room temperature (20-25 °C) using a calibrated pH meter.
5. Enchytraeus albidus toxicity test
- Conduct the test according to the Organization for Economic Co-operation and Development (OECD) 2016, Test No. 22016.
- Preparation of soil for the test
- Use OECD artificial soil for this test.
- Measure the soil pH following the steps mentioned in section 4.
- Adjust to pH 6.0 ± 0.5 by adding analytical grade calcium carbonate (CaCO3) gradually to the soil and mix thoroughly.
- Adjust the moisture content to 40-60% of maximum WHC by adding distilled or deionized water.
NOTE: Check consistency by hand; soil should be moist but not clumpy.
- Worm acclimatization and selection
- Rinse the worms gently with distilled water to remove the transport saline solution.
- Place the worms in the prepared OECD soil and acclimate at 20 °C for 24 h under a 16 h light/8 h dark cycle at 6,000 lux.
- Select 15 healthy adult worms per setup, using a stereomicroscope based on the presence of clitellum.
- Test setup and incubation
- Mix 100 g of the prepared OECD soil with 5 g of each biochar type in clean containers.
- Prepare control using 100 g of unamended OECD soil.
- Confirm the pH and moisture content to be in the required range (pH - 6.0 ± 0.5; moisture content - 40-60% of maximum WHC).
- Introduce 15 adult worms to each test and control container using soft-tipped forceps.
- Add 25 mg of finely ground rolled oats as a food source on the soil surface.
- Cover containers with perforated aluminum foil to allow air exchange.
- Incubate the containers at 20 °C for 5 days under a 16 h light/8 h dark cycle at 6,000 lux.
- Weigh the containers daily and replenish the weight loss by the addition of an appropriate amount of distilled or deionized water to maintain constant moisture content.
- Monitor worm activity and record any visible mortality during the test.
- After the end of the test, calculate the lethal effect (%) using the formula:

Where:
Wi - initial worm count at the start of the test
Wf - final worm count at the end of the test
NOTE: For the test to be valid, adult mortality in the control setup should not exceed 20% at the end of the test. - After the test, dry the test soil at 105 °C to inactivate it, and dispose according to local biosolid protocols.
6. Phytotoxicity test
- Conduct the test according to the International Organization for Standardization (ISO) 18763:201617.
- Petri dish setup
- Add 20 g of the incubated soil-biochar mixtures into 9 cm clean Petri dishes. Flatten the surface gently using a clean spatula.
- Prepare three replicates for each biochar concentration and include two unamended controls.
- Seed planting and incubation
- Place 10 Sinapis alba seeds evenly spaced in each dish on the soil surface.
NOTE: Do not press the seeds into the soil; allow them to set naturally with moisture. - Cover the dishes with lids and place them in an incubator at 25 °C ± 2 °C for 5 days with no direct light.
- After incubation, measure the root length from a seed edge to the end of a root, using a plastic ruler. Report it in cm or mm. If the seed is just cracked, state it as 0.1 cm or 1 mm.
- Calculate the inhibition effect (%) using the formula:

Where:
RLc - average root length of seeds in control dish
RLt - average root length of seeds in the test dish
NOTE: For the test to be valid, it is important to check that the seed germination in control is at least 80% (8 germinated out of 10 seeds).
- Place 10 Sinapis alba seeds evenly spaced in each dish on the soil surface.
7. Bacterial colony quantification
- Soil suspension and dilution
- Weigh 5 g of each incubated soil-biochar mixture into 50 mL sterile conical tubes.
- Add 25 mL of sterile distilled water and shake thoroughly for 30 s.
- Allow the suspension to homogenize at room temperature for 2 h.
- Filter the suspension using sterile gauze or mesh and prepare serial dilutions using this stock solution.
- Prepare five test tubes each containing 9 mL of sterile distilled water.
- Perform 10-fold serial dilutions using sterile pipettes, for example, transfer 1 mL from stock solution to first tube = 10-1, then 1 mL into next = 10-2, etc.)
- Use 10-2 dilution for plating.
- Plating and counting of colonies
- Pipette 0.2 mL of 10-2 dilution onto sterile nutrient agar plates.
- Spread the sample evenly using a sterilized spreader.
- Incubate plates in an inverted position at 27 °C for 24 h.
- Count colonies using a colony counter.
- Calculate the colony forming units (CFU) mL-1 of the mixture using the formula:

NOTE: Work under a biosafety cabinet if available. Flame-sterilize tools between samples to avoid contamination.
Disinfect all the plates with 70% ethanol or autoclave before discarding.
8. Determination of dry matter (DM)
NOTE: Use heat-resistant gloves when handling hot bowls.
- Weigh 10 g of soil into a heat-resistant glass or porcelain bowl.
- Place the bowl in a drying oven preheated to 105 °C and dry for 2 h.
- After drying, transfer the bowl to a desiccator and allow it to cool for 10 min to prevent moisture absorption from air.
- Weigh the cooled bowl again using an analytical balance.
- Repeat the procedure for at least three samples to ensure accuracy.
- Calculate the dry matter (DM) content using the formula:
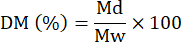
Where:
DM - content of dry matter (%)
Md - dry sample weight in g
Mw - undried (original) sample weight in g
9. Dehydrogenase activity (DHA) test
- Conduct the test according to the standard protocol (ISO 23753-1:2019)18.
- Reagent preparation
- TRIS buffer solution (100 mmol/L, pH 7.6).
- Dissolve 12.12 g of tris(hydroxymethyl)aminomethane (TRIS) in 800 mL of distilled water.
- Adjust the pH to 7.6 using 1 M hydrochloric acid (HCl).
- Adjust the total volume to 1 L with distilled water.
- Store at 4 °C and use it within one week.
- TTC substrate solution (300 mmol/L)
- Dissolve 1 g of TTC in 10 mL of the prepared Tris buffer solution.
- Store in the dark at 4 °C and use it within 1 week.
- Prepare TPF standard solution for calibration curve:
- Add 100 mg of TPF to 10 mL of 96% ethanol and stir until completely dissolved to obtain a TPF stock solution (33 mmol/L).
- Dilute 0.5 mL of the prepared TPF stock solution with 50 mL of ethanol to obtain TPF working solution (330 nmol/mL).
- Prepare working standards of 0, 0.1, 0.2, 0.5, and 1.0 mL from the working solution, diluted with ethanol to a constant final volume of 3 mL.
- Measure absorbance at 485 nm to generate the calibration curve.
- TRIS buffer solution (100 mmol/L, pH 7.6).
- Sample preparation
- Add 5 g of each soil-biochar mixture into 50 mL conical tubes.
- Add 4 mL of Tris buffer (100 mmol/L, pH 7.6) and 1 mL of TTC solution to the test setups.
- Add only 4 mL of Tris buffer to the control setups.
- Mix tubes manually by gentle inversion and incubate at 25 °C for 6 h in darkness.
- Extraction of formazan
- Add 25 mL of ethanol to each tube after incubation.
- Place the samples under orbital agitation in the dark for 1 h (250 min-1, at 25 °C).
- After agitation, add 1 mL of TTC to control tubes.
- Centrifuge all tubes at 2,000 × g for 5 min at 25 °C to separate the supernatant.
- Measurement and calculation
- Transfer supernatants to clean cuvettes.
- Read the absorbance at 485 nm using a spectrophotometer.
- Using the calibration curve to determine the concentration of TPF in samples (nmol/L).
- Calculate the dehydrogenase activity using the following formula:
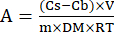
Where:
A - enzymatic activity in mU g-1 (or nmol min-1 g-1) of dry soil
Cs - concentration of TPF in test samples in nmol mL-1
Cb - concentration of TPF in control sample in nmol mL-1
V - total reaction volume (sum of substrate, buffer solution, and ethanol volumes, in mL)
RT - duration of the reaction in minutes
M - soil mass per tube in g
DM - dry matter content of soil (%)
NOTE: Handle TTC and TPF with gloves as they are potential mutagens. Use a fume hood when preparing ethanol-based reagents.
After the test, dispose of ethanol and TTC-containing waste in designated chemical waste containers.
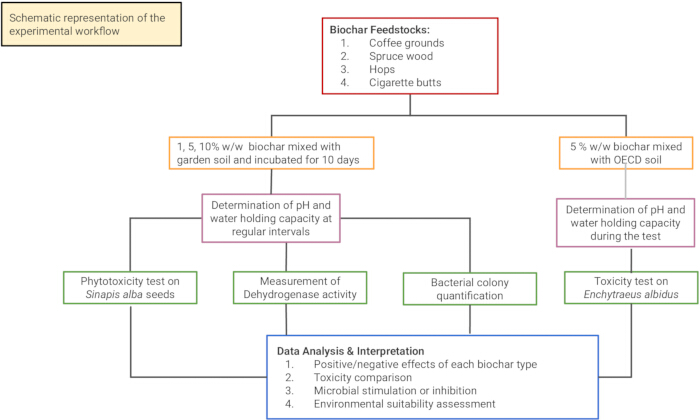
Figure 1: Schematic representation of experimental workflow. Please click here to view a larger version of this figure.
Results
Chemical characterization
The biochars showed significant differences in elemental composition (Table 2). Calcium (Ca) and potassium (K) were highest in cigarette-butt and spent-hops biochars. Spruce-wood biochar had the most aluminum (Al) and iron (Fe). Copper (Cu) and magnesium (Mg) were strongly enriched in spent-hops biochar. Lead (Pb), cadmium (Cd), and other trace metals were present in low amounts across all samples.
Table 2: Chemical composition of the biochars. Main elemental contents of the different biochars used in the study. Please click here to download this Table.
Variation in pH over the incubation period
Across all treatments, the pH of soil-biochar mixtures tended to increase slightly over time (Figure 2). The highest pH value was recorded for the mixture with cigarette-butt biochar at 10% w/w, reaching 9.48 on day 15; this treatment exhibited the greatest increase over time. Coffee-grounds biochar also produced a gradual increase, with a maximum pH of 8.94 at 10% w/w on day 15. Hops biochar increased pH by 16.57%, with a maximum of 9.20 at 10% w/w. In contrast, the spruce-wood biochar mixture reached a pH of 8.56 at 10% w/w. The control showed the lowest pH, ranging from 6.57 to 7.66 with minimal change over time.
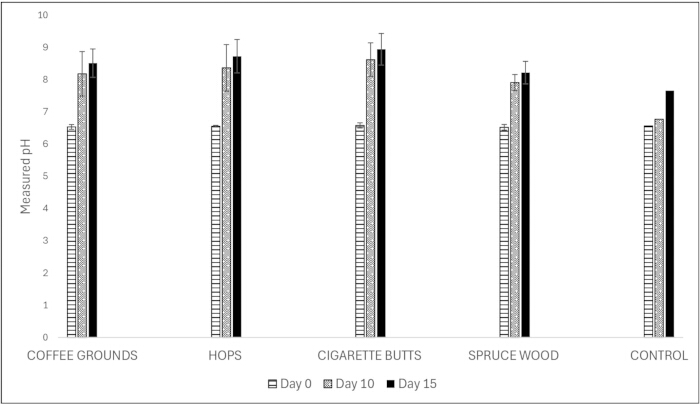
Figure 2: pH Changes over time in soil-biochar mixtures. Soil pH measured on Day 0, 10, and 15 for each biochar amendment at 1%, 5%, and 10% w/w. Please click here to view a larger version of this figure.
Water retention and weight loss
Water retention capacity across all biochar types was lower than the control soil without biochar (Figure 3). The control lost 3.67% of its weight over 15 days, indicating the highest water retention. Among biochars, the cigarette-butt treatment had the least water loss, decreasing by 5.89% over the incubation, and thus the greatest retention among biochars. A similar but more moderate pattern was observed with hops biochar (9.22% total weight loss, with larger losses at higher concentrations). Coffee-grounds biochar showed the greatest weight loss (up to 16.56%), indicating the lowest water retention. The spruce-wood mixture lost an average of 10.22%.
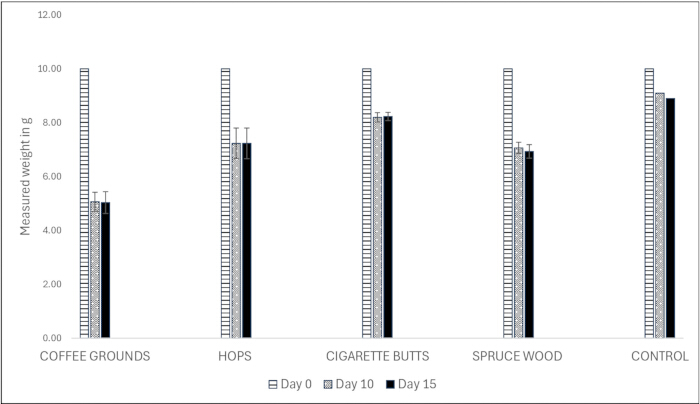
Figure 3: Weight loss of soil-biochar mixtures during incubation. Weight change as an indicator of water retention over 15 days for all biochars and concentrations. Please click here to view a larger version of this figure.
E. albidus toxicity and reproduction test
The reproduction of E. albidus at 5% w/w biochar showed marked feedstock dependence. In the OECD-soil control, the population increased from 15 to 24 (60% increase, Figure 4). Spruce-wood biochar resulted in only 7 survivors (53% inhibition, Figure 5). Hops and coffee-grounds biochars each yielded 12 survivors (20% inhibition, Figure 5). Cigarette-butt biochar stimulated reproduction by 33%, with a total of 20 worms, including offspring.
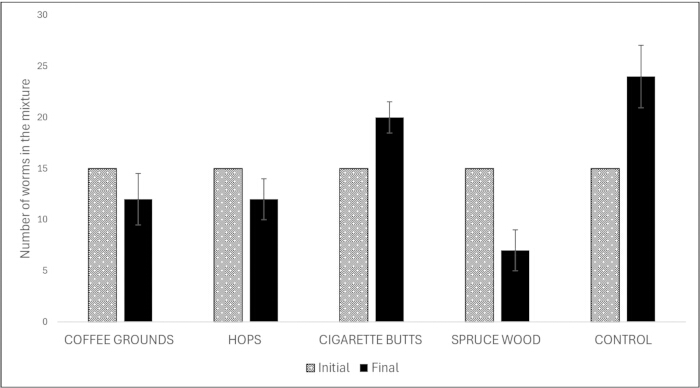
Figure 4: Net population change of E. albidus in biochar-treated soil. Initial and final worm counts after 5 days. The 5% w/w concentration of each biochar was tested. Data represent mean ± standard deviation (n = 3). Please click here to view a larger version of this figure.
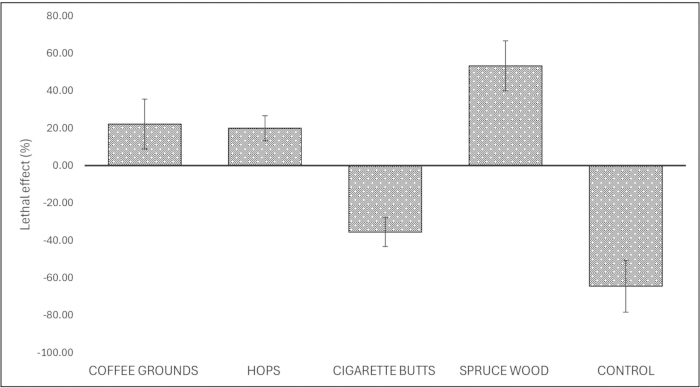
Figure 5: Toxic or stimulatory effects on E. albidus. Net effect on the worms compared to control. Positive values show inhibition; negative values show stimulation. Data represent mean ± standard deviation. Please click here to view a larger version of this figure.
Phytotoxicity
Root elongation in S. alba was measured after a 10 day incubation at 1%, 5%, and 10% w/w (Figure 6). In unamended soil, the average root length was 237 mm. Coffee-grounds biochar at 1% w/w produced a 79.16% stimulation; higher concentrations caused inhibition, up to 47.08% at 5% w/w. Spruce-wood biochar stimulated growth at all concentrations, peaking at 206.66% at 10% w/w. Cigarette-butt biochar yielded 41.01% stimulation at 1% w/w but inhibited growth at 5% and 10% w/w, reaching 62.36% inhibition at 10% w/w. Hops biochar stimulated growth at all rates (38.97%, 31.75%, and 162.96% at 1%, 5%, and 10% w/w, respectively).
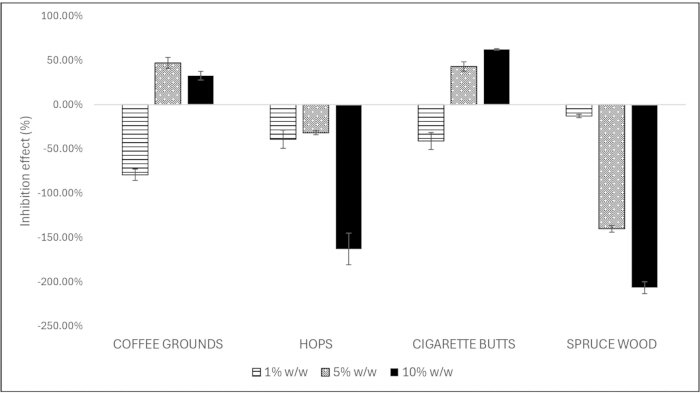
Figure 6: Phytotoxicity effects on Sinapis alba. Root growth inhibition or stimulation relative to control after 10 days of growth in all biochar treatments. Positive values show inhibition; negative values show stimulation. Data represent mean ± standard deviation (n = 3). Please click here to view a larger version of this figure.
Bacterial colony quantification
Bacterial colony counts were assessed after 10 days (Figure 7). The control averaged 8.47 × 10⁴ CFU/mL. Coffee biochar yielded 7.33 × 10⁴ CFU/mL at 1% w/w and increased to 1.18 × 10⁵ and 1.50 × 10⁵ CFU/mL at 5% and 10% w/w, respectively. Spruce-wood biochar gave 1.97 × 10⁵ CFU/mL at 1% w/w, decreasing to 9.73 × 10⁴ and 4.93 × 10⁴ CFU/mL at 5% and 10% w/w. Cigarette-butt biochar produced 5.40 × 10⁴ CFU/mL at 1% w/w and the highest stimulation at 10% w/w (1.00 × 10⁶ CFU/mL). Hops biochar showed slight stimulation across all concentrations, peaking at 1.07 × 10⁵ CFU/mL at 5% w/w.
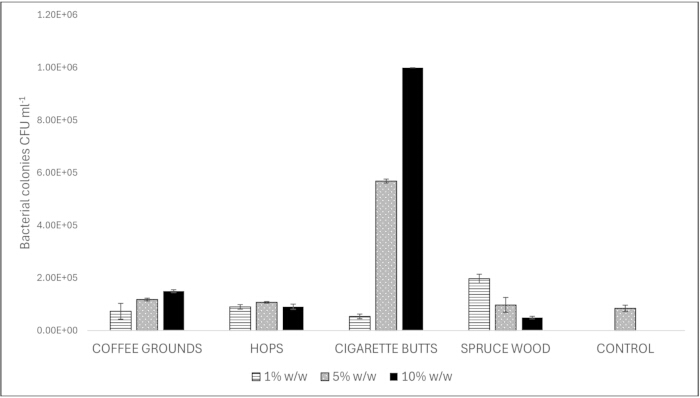
Figure 7: Bacterial growth in soil treated with biochar. Bacterial CFU/mL after 10 days of incubation for all treatments and concentrations. Control included for comparison. Data represent mean ± standard deviation (n = 3). Please click here to view a larger version of this figure.
Dehydrogenase activity
Coffee-grounds biochar produced the highest dehydrogenase activity across concentrations, peaking at 1% w/w (3.53 × 10⁻³ mU/g) and remaining comparable at 5% and 10% w/w (2.38 × 10⁻³ and 2.62 × 10⁻³ mU/g) (see Figure 8). Hops biochar enhanced activity at 1% w/w (2.39 × 10⁻³ mU/g) but decreased at 5% (6.34 × 10⁻⁴ mU/g) and became negative at 10% w/w (−8.30 × 10⁻⁴ mU/g). Cigarette-butt biochar was positive at 1% w/w (1.29 × 10⁻³ mU/g) and decreased to −7.26 × 10⁻⁴ and −8.53 × 10⁻⁴ mU/g at 5% and 10% w/w. Spruce-wood biochar was negative at all concentrations (−5.53 × 10⁻⁴ and −5.19 × 10⁻⁴ mU/g at 1% and 5% w/w; −3.11 × 10⁻⁴ mU/g at 10% w/w), remaining lower than the control.
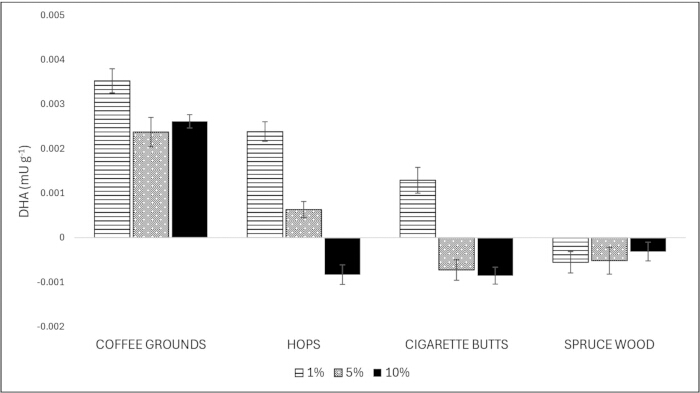
Figure 8: Dehydrogenase activity in biochar-amended soil. Microbial enzyme activity across all biochar types and concentrations. Values are relative to control soil without biochar addition. Positive values indicate higher enzyme activity compared to the control, and negative values indicate enzyme activity lower than the control. Data represent mean ± standard deviation (n = 3). Please click here to view a larger version of this figure.
See Table 3 and Table 4 for a summary of the results.
Table 3: Biochar effects on soil pH and water retention. Shows initial and final pH values, ΔpH, and % water loss during incubation. Please click here to download this Table.
Table 4: Summary of biological effects and DHA results. Combined data on worm reproduction, phytotoxicity, microbial counts, and enzyme activity for all treatments.  indicates stimulation and
  indicates inhibition. For DHA results, positive values indicate higher enzyme activity compared to control and negative values indicate enzyme activity lower than control. Please click here to download this Table.
DATA AVAILABILITY:
Data will be uploaded to public repository: DOI/URL: https://doi.org/10.6084/m9.figshare.30128803.v1
Discussion
The mixture of soil and spent coffee grounds biochar showed high alkalinity, with a pH of 8.94, consistent with previously reported pH of 9.419. The biochar also exhibited the highest increase in weight loss compared to the control sample, indicating low moisture retention capability, which is likely due to its low surface area, limiting water adsorption tendency20,21. These physical properties created unfavorable conditions for E. albidus, causing a 20% inhibition in worms' survival and reproduction.
In phytotoxicity tests, S. alba showed stimulation of 79.16% at 1% w/w concentration, while at higher concentrations, e.g., 5% w/w, the biochar inhibited root elongation by 47.08%. This aligns with reports22 that the phytotoxic effects of coffee grounds biochar on Lactuca sativa were caused by carboxylic acids. Moreover, studies have shown that soluble phenolics and carboxylic acids also disrupt auxin transport, which results in phytotoxic thresholds23.
Bacterial colony counts increased with increased coffee biochar concentration (1.50 × 10⁻⁵ CFU/mL at 10% w/w concentration), indicating that this biochar provided favorable conditions for cultivable bacteria. Coffee biochar also showed the highest DHA activity (3.53 × 10⁻³ mU/g), suggesting it stimulated both cultivable and non-cultivable microbial populations. This was further supported by studies24 that observed the beneficial impacts of coffee biochar on soil enzymatic activity.
Hops biochar caused an increase in soil alkalinity and moderate average weight loss (10%). In phytotoxicity tests, the biochar was beneficial for root elongation stimulation, especially at higher concentrations (162.96% stimulation). Regarding microbial activity, hops biochar showed no remarkable change in bacterial counts (up to 1.00 × 10⁻⁵ CFU/mL), which might be due to a balance in its chemical composition. While hops biochar contained the highest amount of copper (Cu), which can be toxic to microbes as it inhibits bacterial enzyme systems25, it also contained higher levels of elements like potassium (K) and phosphorus (P), which should support microbial growth by improving chlorophyll synthesis in seedlings26. DHA activity also reflected this neutral effect, indicating a stable response with limited biological impact.
Cigarette butts' biochar resulted in increasing soil alkalinity over time (up to pH 9.48). It was produced at a higher pyrolysis temperature (700 °C), which resulted in a more alkaline biochar that supported bacterial growth. This observation is consistent with previous studies27, which reported that biochar improves soil pH, thus improving habitat conditions. Among all treatments, cigarette butts' biochar retained the highest moisture content (up to 94%), which could also explain the stimulatory effect on E. albidus survival and reproduction. High moisture retention can be linked to microstructural changes at 700 °C, producing micropores that trap water films28. Another cause of the stimulatory effect can be due to the high content of calcium (Ca), P, and K in the cigarette butts' biochar, which are beneficial elements for worm survival and reproduction.
In microbial assessments, cigarette butts' biochar exhibited the highest bacterial stimulation at higher concentrations reaching approximately 1.00 × 10⁻⁶ CFU/mL, unlike DHA activity which did not show the same level of increase. This finding suggests selective stimulation of cultivable bacteria rather than the entire microbial community.
The mixture of soil and spruce wood biochar caused only a slight increase in pH, also noted by studies29, which reported a pH of 7.87 for conifer-derived biochar. Its production temperature was the lowest (600 °C) of all biochars used in this study. The biochar's capacity to retain water was moderate compared to other biochar types, as it did not show extreme weight loss.
However, in the case of Eisenia foetida survival and reproduction, the spruce wood biochar showed the highest toxicity (53% lethal effect). One of the probable causes could be elevated levels of elements like aluminum (Al), iron (Fe), and manganese (Mn), which are known to be toxic to earthworms as they interfere with their gut pH regulation and cause oxidative stress30. Similar findings were reported in studies where Eisenia foetida suffered a considerable decline in biomass due to heavy metal toxicity in soil from excessive use of agrochemicals31.
Spruce wood biochar caused the greatest root elongation stimulation in the phytotoxicity assay (up to 206% stimulation). This suggests that, unlike sensitivity to worms, high concentrations of metals can serve as essential micronutrients to plant species like S. alba. Low concentrations of this biochar stimulated bacterial colonies; however, the colony counts declined with increasing concentration. This effect indicates bacterial sensitivity to low levels of K and P and high toxic element content (Al, Fe, Mn). This observation is consistent with the measured DHA activity, which was lower than the control soil, possibly due to a low hydrogen-to-carbon (H/C) ratio, making carbon unavailable32. These findings suggest that spruce wood biochar does not support microbial growth due to poor nutrient content or inhibitory compounds.
The biochars were obtained as test materials from external laboratories and produced under the conditions routinely applied by each provider, which included different pyrolysis temperatures. Our goal was to evaluate representative waste-derived biochars as supplied, rather than to isolate the effect of temperature across feedstocks; therefore, temperature effects cannot be fully disentangled from feedstock effects in this study. Detailed production parameters such as heating rate, gas atmosphere, and residence time were not available from the suppliers; only the provided temperatures and elemental characteristics were reported (see Table 1 and Table 2).
Considering the findings from this study, it can be concluded that the hops biochar had an overall balanced effect with moderate environmental side effects. It supported the growth of plants at all concentrations, showed moderate pH change and water retention capacity, and moreover, it did not have a drastic effect on soil microbes and worms compared to other tested biochars.
These results demonstrate how crucial it is to select appropriate biochar type along with its suitable concentrations for soil amendments to ensure the actual improvement of soil quality and plant growth, without causing negative side effects.
Several steps in the protocol, including pyrolysis temperature and biochar application rate, had a noticeable impact on the outcomes of this study. Higher pyrolysis temperatures resulted in higher alkalinity of the biochar and influenced the stimulation in worm reproduction and bacterial growth, as seen for the cigarette butt's biochar. In contrast, lower pyrolysis temperatures resulted in less alkaline biochar and were associated with the highest worm toxicity and reduced microbial activity, as in the case of spruce wood biochar. The effect of the application rate was dependent on the biochar type and the organism tested. Lower concentrations of coffee grounds biochar led to a stimulatory effect on root elongation and high DHA activity, while high concentrations of cigarette butts' biochar resulted in the highest cultivable bacterial growth.
Certain adjustments were made in the study method to resolve common issues like inconsistent colony counts. This includes allowing 2 h homogenization of soil suspensions and using the 10-2 serial dilution to obtain optimum and comparable colony counts. Additionally, the OECD guideline, test no. 220 is designed to assess the effect of test chemicals on Enchytraeid worms. It suggests the calculation of lethal concentration 50 (LC50) derived from a range of chemical concentrations tested in the range-finding test. In this study, the aim was to evaluate the overall toxic effect of waste-derived biochars on the worms' survival and reproduction; therefore, the lethal effect was determined by the percentage change in the number of worms from the start to end of the test and reported as Lethal Effect %.
This protocol is reproducible under laboratory conditions and at a small scale (e.g., 100 g samples). However, scaling up for larger soil volumes might cause differences in outcomes. This can be controlled by proper mechanical mixing of soil and the used biochar, along with a controlled irrigation system to maintain constant moisture levels. Additionally, the biochar effects varied strongly with feedstock type and pyrolysis temperature, suggesting future research to characterize each material individually before application.
The protocol differs from other soil-health assessment techniques in that it offers a combination of physico-chemical parameters like pH and moisture retention, and biological responses to amending the soil with different types of biochars. The inclusion of enzyme activity analysis along with traditional microbial colony counts provides insight into non-cultivable microbial function. Furthermore, the study was based on different biochar feedstocks at multiple concentrations, which adds practical relevance for real-world soil amendment strategies.
Future research may involve testing additional feedstocks, such as manure, rice husk, or sewage sludge, to compare their effects on soil ecosystems. Long-term field trials can also be adapted to assess seasonal effects and crop yield outcomes. This study shows feedstock- and concentration-dependent effects of waste-derived biochars on soil health. Certain biochars stimulated microbial activity and plant growth, whereas others produced inhibitory or toxic responses in soil organisms. Selecting appropriate biochar types and application rates is essential to maximize benefits while minimizing risks in soil management.
Disclosures
The authors declare that they have no conflicts of interest.
Acknowledgements
The presented work was financed by the project BIOCIRKL (reg. no. TN02000044), supported by the Czech Recovery Plan and the Technology Agency of the Czech Republic within the National Centres of Competence Programme in the years 2023-2028.
Materials
| Name | Company | Catalog Number | Comments |
|---|---|---|---|
| 1,3,5- Triphenyltetrazolium formazan | Sigma-Aldrich, Czech Republic | 93145 | |
| 2,3,5- Triphenyltetrazolium chloride | Sigma-Aldrich, Czech Republic | T8877 | |
| autoclave CertoClav Classic | CertoClav, Austria | 8510174 | |
| Calcium Carbonate | Sigma-Aldrich, Czech Republic | 239216 | |
| centrifuge MPW-251 | MPW Med. Instrument, Poland | 10251 | |
| Cigarette butts biochar | University of Hohenheim, Germany | Produced at 700 °C | |
| Colony counter CC-200 | Cole-Parmer | 14212-04 | |
| Enchytraeus albidus | INVITAL aqua s.r.o. | ||
| Ethanol | Penta, Czech Republic | 70390-11003 | |
| Hops biomass biochar | Laboratory of the Academy of Sciences of the Czech Republic | Produced at 650 °C | |
| Incubator Q-cell | Pol-Lab, Poland | ||
| Microwave oven | Anton Paar, Multiwave PRO | ||
| Notebook PC DELL Latitude 3510 | Dell Products, Ireland | ||
| Nutrient Agar media | OXOID, Czech Republic | CM0003B | |
| OECD soil | Microbiotest, Belgium | ||
| pH meter WTW inoLab pH 7110 | Xylem Analytics, Germany | 1AA112 | |
| Sinapis alba seeds | Microbiotest, Belgium | ||
| Spectrophotometer M4 UV-Visible spectrophometer | VWR | 76520-716 | |
| Spent coffee grounds biochar | Laboratory of the Academy of Sciences of the Czech Republic | Produced at 650 °C | |
| Spruce wood biochar | Olesnice, Czech Republic | Produced at 600 °C | |
| Stereomicroscope MSZ5000-T-IL-TL | A.Kruss Optronic, Germany | MSZ5000-T-IL-TL | |
| Tris Base | Sigma-Aldrich, Czech Republic | 252859 | |
| video eyepiece VOPC93 USB 2.0 | A.Kruss Optronic, Germany | VOPC93 | |
| Weighing scale KERN EMB | KERN, Germany |
References
- Pradhan, S., Parthasarathy, P., Mackey, H. R., Al-Ansari, T., McKay, G. Food waste biochar: A sustainable solution for agriculture application and soil-water remediation. Carbon Res. 3 (1), 41(2024).
- D'Hose, T., Debode, J., De Tender, C., Ruysschaert, G., Vandecasteele, B. Has compost with biochar applied during the process added value over biochar or compost for increasing soil quality in an arable cropping system. Appl Soil Ecol. 156, 103706(2020).
- Wang, S., et al. Biochar improves soil quality and wheat yield in saline-alkali soils beyond organic fertilizer in a 3-year field trial. Environ Sci Pollut Res. 30 (7), 19097-19110 (2023).
- Smith, P. Soil carbon sequestration and biochar as negative emission technologies. Glob Change Biol. 22 (3), 1315-1324 (2016).
- Jin, X., et al. Review on the effects of biochar amendment on soil microorganisms and enzyme activity. J Soils Sediments. 24 (7), 2599-2612 (2024).
- Melo, L. C. A., Lehmann, J., Carneiro, J. S. daS., Camps-Arbestain, M. Biochar-based fertilizer effects on crop productivity: A meta-analysis. Plant Soil. 472 (1), 45-58 (2022).
- Blanco-Canqui, H. Biochar and soil physical properties. Soil Sci Soc Am J. 81 (4), 687-711 (2017).
- Geng, N., et al. Biochar mitigation of soil acidification and carbon sequestration is influenced by materials and temperature. Ecotoxicol Environ Saf. 232, 113241(2022).
- Ippolito, J. A., et al. Feedstock choice, pyrolysis temperature and type influence biochar characteristics: A comprehensive meta-data analysis review. Biochar. 2 (4), 421-438 (2020).
- Wei, S., et al. Influence of pyrolysis temperature and feedstock on carbon fractions of biochar produced from pyrolysis of rice straw, pine wood, pig manure and sewage sludge. Chemosphere. 218, 624-631 (2019).
- Oleszczuk, P., Jośko, I., Kuśmierz, M. Biochar properties regarding to contaminants content and ecotoxicological assessment. J Hazard Mater. 260, 375-382 (2013).
- Bolan, S., et al. Biochar modulating soil biological health: A review. Sci Total Environ. 914, 169585(2024).
- Baran, A., Tarnawski, M. Phytotoxkit/Phytotestkit and Microtox® as tools for toxicity assessment of sediments. Ecotoxicol Environ Saf. 98, 19-27 (2013).
- Novais, S. C., Gomes, N. C., Soares, A. M. V. M., Amorim, M. J. B. Antioxidant and neurotoxicity markers in the model organism Enchytraeus albidus (Oligochaeta): Mechanisms of response to atrazine, dimethoate and carbendazim. Ecotoxicology. 23 (7), 1220-1233 (2014).
- Kaczyńska, G., Borowik, A., Wyszkowska, J. Soil dehydrogenases as an indicator of contamination of the environment with petroleum products. Water Air Soil Pollut. 226 (11), 372(2015).
- Organisation for Economic Co-operation and Development. Test No. 220: Enchytraeid reproduction test. , (2016).
- ISO 18763:2016 - Soil quality - Determination of the toxic effects of pollutants on germination and early growth of higher plants. , International Organization for Standardization. https://www.iso.org/standard/63317.html (2016).
- ISO 23753-1:2019 - Soil quality - Determination of dehydrogenase activity in soils - Part 1: Method using triphenyltetrazolium chloride (TTC). , International Organization for Standardization. https://www.iso.org/standard/70145.html (2019).
- Carnier, R., Coscione, A. R., Delaqua, D., de Abreu, C. A. Coffee industry waste-derived biochar: Characterization and agricultural use evaluation according to Brazilian legislation. Bragantia. 80, e5721(2021).
- Jin, Z., et al. High-performance spent coffee grounds-based 3D microporous biochar for the efficient capture of Cd2+ via a multi-pathway mechanism. Chem Eng J. 485, 149537(2024).
- Batista, E. M. C. C., et al. Effect of surface and porosity of biochar on water holding capacity aiming indirectly at preservation of the Amazon biome. Sci Rep. 8 (1), 10677(2018).
- de Souza, L. Z. M., et al. Ecotoxicological effects of biochar obtained from spent coffee grounds. Mater Res. 25, e20220013(2022).
- Ahmad, A., Liu, Y., Ge, Q. Assessing environmental thresholds in relation to plant structure and nutritional value for improved maize calendar ensuring food security. Sci Total Environ. 834, 155120(2022).
- Martins Filho, A. P., et al. Impact of coffee biochar on carbon, microbial biomass and enzyme activities of a sandy soil cultivated with bean. An Acad Bras Cienc. 93, e20200096(2021).
- Giachino, A., Waldron, K. J. Copper tolerance in bacteria requires the activation of multiple accessory pathways. Mol Microbiol. 114 (3), 377-390 (2020).
- Sardans, J., Peñuelas, J. Potassium control of plant functions: Ecological and agricultural implications. Plants. 10 (2), 419(2021).
- Sorrenti, G., Masiello, C. A., Toselli, M. Biochar interferes with kiwifruit Fe-nutrition in calcareous soil. Geoderma. 272, 10-19 (2016).
- Jin, L., et al. Investigations of the effect of the amount of biochar on soil porosity and aggregation and crop yields on fertilized black soil in northern China. PLoS One. 15 (11), e0238883(2020).
- Gezahegn, S., Sain, M., Thomas, S. C. Variation in feedstock wood chemistry strongly influences biochar liming potential. Soil Syst. 3 (2), 26(2019).
- Yadav, R., et al. Heavy metal toxicity in earthworms and its environmental implications: A review. Environ Adv. 12, 100374(2023).
- Dzul-Caamal, R., Vega-López, A., Osten, J. R. Distribution of heavy metals in crop soils from an agricultural region of the Yucatan Peninsula and biochemical changes in earthworm Eisenia foetida exposed experimentally. Environ Monit Assess. 192 (6), 338(2020).
- Lehmann, J., et al. Biochar in climate change mitigation. Nat Geosci. 14 (12), 883-892 (2021).
Reprints and Permissions
