This study established cough and sneeze models in mice by applying specific stimuli to the trachea and nasal cavity, and developed an audio-based method to distinguish between mouse coughs and sneezes by analyzing differences in their acoustic signals.
Method Article
Precision Induction and Distinction of Coughing and Sneezing Reflexes in Mice
In This Article
Summary
Abstract
Coughing and sneezing, as vital respiratory defensive reflexes, have seen research into their mechanisms constrained by the nonspecific stimulation inherent in traditional models. Existing methods, such as capsaicin or citric acid nebulization, can simultaneously activate coughing (mediated by tracheal C fibers) and sneezing (mediated by nasal trigeminal nerves), leading to confounded behavioral observations. Although previous studies have attempted to distinguish coughing and sneezing by analyzing respiratory patterns or acoustic signatures, these studies lack models that can specifically stimulate the trachea and nasal cavity. Here, we developed a murine model employing site-specific stimulation of the trachea (to induce cough) and nasal cavity (to trigger sneeze). Using synchronized multimodal recordings, whole-body plethysmography (WBP), wideband ultrasonic microphones (0-250 kHz), and high-speed videography (160 fps), we quantified distinct physiological signatures of cough and sneeze. Our findings revealed that both coughing and sneezing exhibit single- and double-peak respiratory patterns, with significant differences in their audio frequency spectra composition. By constructing a coordinate system based on audio features, we were able to effectively distinguish coughing and sneezing, mapping them to different quadrants of the coordinate axis. This study, through anatomically specific stimulation and acoustic feature analysis, established a mouse model capable of quantitatively distinguishing between coughing and sneezing, providing a high-precision experimental method for the investigation of airway defense reflexes and targeted therapeutic development.
Introduction
Coughing and sneezing are crucial defensive reflexes for the body to clear foreign substances from the respiratory tract, and abnormalities in its related neural pathways often trigger chronic diseases, such as chronic cough and rhinitis. Both reflexes involve an inspiratory phase, a compressive phase, and an expiratory phase1,2. The cough reflex is primarily mediated by airway sensory neurons innervated by the vagus nerve3,4,5. Vagus neurons receive mechanical, chemical, or electrical stimuli from the airways and transmit the signals to the nucleus tractus solitarius (NTS) in the medulla oblongata6. The NTS integrates this information and subsequently projects it to the respiratory centers in the medulla and pons7. These centers ultimately coordinate relevant respiratory muscle groups (such as the diaphragm, intercostal muscles, and laryngeal muscles) to execute the cough action, expelling potentially harmful irritants and mucus from the respiratory tract through the oral cavity8,9,10. The sneeze reflex is primarily mediated by nasal sensory neurons within the trigeminal ganglion11,12. Their mechanical or chemical stimuli are transmitted to the spinal trigeminal nucleus (SP5), which then relays the information to the respiratory centers13,14,15,16. These centers regulate relevant muscles (such as respiratory muscles, palatal muscles, and facial muscles) to initiate a sneeze17. The powerful expiratory blast of the sneeze forces most of the air out through the nose to expel the irritants9,18. Research on cough and sneeze not only aids in elucidating the neural mechanisms of respiratory defense, but also provides therapeutic targets for chronic cough and rhinitis. To this end, establishing a robust and reliable animal model is of paramount importance.
In recent years, mice have emerged as a pivotal model organism for studying the neural pathways of cough and sneeze19,20,21. The predominant current methodology still involves inducing these reflex behaviors via inhalation of aerosolized stimulant compounds8,20,22. A significant limitation of this inhalation approach is that the stimuli simultaneously act upon both the nasal cavity and trachea, non-specifically activating the distinct sensory afferent systems mediating sneeze (via the trigeminal pathway) and cough (via the vagal pathway). This poses a substantial challenge for the precise differentiation of the elicited behavior type in experiments. This discrepancy is evident in the literature: some studies define capsaicin-induced respiratory reflexes in mice as sneezing21, while others report that these reflexes encompass both cough and sneeze components8,22.
To address this challenge, advanced methodologies have been developed, including the analysis of respiratory patterns and trajectories to classify distinct reflex behaviors8. Another study demonstrates that coughs and sneezes exhibit marked differences in temporal and spectral characteristics, such as duration, frequency modulation22. Their work highlighted that coughs exhibit energy concentration in lower peak frequency ranges (20-80 kHz), whereas sneezes display components extending beyond 90 kHz22. These acoustic divergences offer a novel, non-invasive framework for behavioral discrimination, complementing traditional respiratory waveform analyses. Despite these innovations, a critical gap persists: existing models lack anatomical specificity in stimulus delivery, often confounding tracheal and nasal reflex pathways. This limitation shows we need better ways to target and study respiratory reflexes.
Research on the mechanisms underlying cough and sneeze induced by mechanical and chemical stimulation of the airways has been extensively conducted in large animal models (e.g., cats)17. However, in small animal models (e.g., guinea pigs, rats, and mice), technical limitations have typically necessitated reliance on aerosolized compounds (such as capsaicin or citric acid) to achieve chemical stimulation.
This protocol proposes a novel method for inducing cough-like and sneeze-like behaviors in mice and establishes a new set of methods to quantify and characterize these respiratory reflexes. This approach establishes a strategy to differentiate cough-like and sneeze-like behaviors in mice by identifying characteristic vocalizations and analyzing their spectral features and acoustic intensity. This novel methodology has the potential to standardize the quantification of murine respiratory reflexes, enhance experimental reproducibility, and deepen mechanistic understanding of cough and sneeze neurophysiology.
Protocol
All experiments were performed in compliance with the guidelines of the Animal Use and Care Protocol of Guangzhou Lab (GZLAB-AUCP- 2024-04-A10). Female and male mice specific-pathogen-free C57BL/6 mice, aged 8-10 weeks were used in this study.
1. Experimental preparation
- Preparation of experimental animals
- House mice in cages with free access to food and water, and maintain at 22 ± 1 °C under a standard 12 h light/dark cycle.
- Preparation of Capsaicin solution
- Dissolve 30.5 mg of capsaicin powder in PBS containing 10% ethanol and 10% Tween-80 to prepare a 10 mM stock solution.
- Dilute stock solution 1:100 in physiological saline to prepare 100 µM working solution.
- Preparation of Tribromoethanol (Avertin)
- Weigh 0.5 g tribromoethanol into a 1.5 mL Eppendorf tube. Add 1 mL of 2-methyl-2-butanol.
- Incubate at 55 °C with agitation (400-600 rpm) in the dark until fully dissolved (~20 min).
- Place 40 mL of physiological saline in a beaker. While stirring, add the dissolved tribromoethanol solution dropwise. Continue stirring until dissolved crystals fully dissipate (~40 min).
- Adjust pH to 7.0-7.3 using NaOH.
2. Establishment and recording of cough-like behavior model
- Implantation cannula preparation
- Cut a 28 G needle (ID: 0.19 mm, OD: 0.35 mm) into a ~5 mm cannula. Smooth both ends with abrasive paper using forceps. Attach one end to silicone tubing (ID: 0.3 mm, OD: 0.8 mm). Connect to a 1 mL syringe and flush the cannula with water to verify patency.
- Bend cannula at 90° with 2:3 arm ratio. Insert longer arm into silicone tube (ID: 0.3 mm, OD: 0.8 mm, 5 cm length; Figure 1A). Designate the bent end for tracheal implantation. Extend the silicone tube from the trachea to the skull for fixation (Figure 1B).
- Recording equipment setup preparation
- Prepare whole-body plethysmography (WBP) system, Ultrasonic recorder, High-speed camera, Microinjection pump.
- Mouse group assignment
- Randomly assign mice to three groups (n = 6/group): i) Control group: Maintain normal untreated status. ii) Sham group: Implant the tracheal cannula without stimulation. iii) Stimulation group: Implant the tracheal cannula and administer capsaicin to induce cough.
- Surgical procedure
- Administer 0.5-1.0 mg/kg buprenorphine ER by subcutaneous injection 30 min prior to the start of the surgical procedure. Anesthetize the mice by intraperitoneal injection of tribromoethanol (125-250 mg/kg) and confirm complete anesthesia by the absence of a response to a toe pinch. Apply ophthalmic ointment to both eyes to prevent corneal dryness prior to the procedure. Then, place the mouse on a heating pad set to maintain a temperature of 37 °C, and cover the animal with a sterile gauze.
- Shave the cranial and cervical hair. Secure the anesthetized mouse supine. Disinfect with iodophor and alcohol.
- Under microscope: Incise cervical skin for approximately 1 cm. Bluntly dissect tissues and muscles to expose the trachea. Puncture soft tissue between the cricoid and tracheal cartilages using 32 G needle. Create a minimal tracheal opening with ophthalmic scissors.
NOTE: Keep the opening size just large enough for cannula diameter to prevent tissue damage. - Insert metal cannula (silicone-sheathed) ~1 mm into tracheal lumen. Secure cannula-trachea junction with 7-0 suture.
NOTE: Limit insertion depth to 1 mm to avoid respiratory compromise. - Incise the scalp for ~1 cm. Bluntly tunnel subcutaneously from neck to skull. Route the silicone tube to the cranium and fix it with dental cement.
- Suture the skin of the neck and the top of the head. Place the mouse on a heating pad until it is conscious. House in a cage for 5 days.
- Flush tracheal cannula/tubing daily with 1 mL air syringe.
NOTE: Omit flushing within 24 h prior to cough induction.
- Cough recording
- Fit the ultrasonic probe with a port-compatible sealing ring. Insert the probe into the WBP chamber port to ensure airtight contact.
- Connect the WBP chamber, flow sensor, and bias flow. Calibrate via software.
- Attach a skull-fixed silicone tube to a 30 cm extension tube. Place the mouse in WBP chamber. Extend the tube through the top port. Seal the port with modeling clay. Verify chamber airtightness by confirming that the respiratory waveform peaks fall within 4 ± 2.
- Load 1 mL syringe with 5 mL of capsaicin solution. Eliminate air bubbles. Connect to the extension tube. Mount the syringe on the microinjection pump and set the flow to 10 µL min-1.
NOTE: Excessive flow may carry capsaicin to the nasal cavity. - Position a high-speed camera facing the chamber. Adjust the distance and focus. Set the sampling rate to 160 fps (maximum).
- Simultaneously start the WBP, ultrasound, and camera software; trigger the pump to infuse the capsaicin. Record cough counts for 10 min.
3. Establishment and recording of sneeze-like behavior model
- Experimental equipment preparation
- Prepare one sterile PE tube (ID: 0.5 mm, OD: 1 mm) for fixation as a stimulation cannula on the murine nasal bone.
- Prepare one 0.25 mm diameter sterilized nylon filament for trans-cannula nasal stimulation. Draw on Vonfrey's calibration method, when the 5 cm long filament is pressed vertically onto a balance until it bends to approximately 45°, the measured force is 0.6 g.
- Recording equipment setup
- Ready one whole-body plethysmography (WBP) system, one ultrasound recorder, and one high-speed camera.
- Mouse group assignment
- Randomly assign mice to three groups (n = 6/group): i) Control group: Maintain untreated baseline status. ii) Sham group: Fixate nasal cannula without stimulation. iii) Stimulation group: Fixate nasal cannula + evoke sneeze via filament stimulation.
- Surgical procedure
- Administer 0.5-1.0 mg/kg buprenorphine ER by subcutaneous injection 30 min prior to the start of the surgical procedure. Anesthetize the mice by intraperitoneal injection of tribromoethanol (125-250 mg/kg) and confirm complete anesthesia by the absence of a response to a toe pinch. Apply ophthalmic ointment to both eyes to prevent corneal dryness prior to the procedure. Then place the mouse on a heating pad set to maintain a temperature of 37 °C, and cover the animal with a sterile gauze.
- Shave hair on the cranial skull and nasal bridge.
- Secure the mouse in a stereotaxic frame. Disinfect with iodophor and alcohol. Incise the skin over the skull and the nasal bone. Expose the nasal bone.
- Create a 0.5 mm hole in the junction between the nasal bone and the lateral process of the nasal septal cartilage using a micro-drill. Expose the nasal mucosa.
NOTE: Limit the hole size to 0.5 mm to prevent tissue damage. - Gently lift the nasal mucosa with 32 G needle. Expose the nasal cavity.
- Mount the PE tube in the stereotaxic arm. Position the tube tip flush with the burr hole. Secure the tube to the nasal bone with dental cement and suture the skin.
- Place the mouse on a heating pad until consciousness returns.
- Sneeze recording
- Connect the WBP chamber, flow sensor, and bias flow per the manual. Calibrate using software.
- Fit the ultrasonic probe with a port-adapted gasket. Insert the probe into the chamber. Verify an airtight seal.
- Transfer the mouse to the WBP chamber. Extend the PE tube through the top port. Seal the port with modeling clay around the tube. Verify chamber airtightness by confirming that the respiratory waveform peaks fall within 4 ± 2.
- Position a high-speed camera facing the chamber. Adjust the distance and focus. Set the sampling rate to 160 fps (maximum).
- Advance a 0.25 mm diameter nylon filament through a soft tube into the nasal cavity to depths of 0-3 mm. The portion of the filament protruding from the hand-held tube is 5 cm long. During stimulation, press this free end until it bends to 45°, delivering ~0.6 g of force to the nasal mucosa for 1 s, repeat once every 30 s. Record the sneezing responses for 10 min.
4. Capsaicin-induced cough and sneeze in mice
- Group Assignment
- Divide mice into sham surgery and surgery groups (n = 5/group). Sham group: Expose bilateral anterior ethmoidal and infraorbital nerves. Surgery group: Transect bilateral anterior ethmoidal and infraorbital nerves.
- Ultrasonic nebulization
- Prepare the behavioral chamber (20 cm × 14 cm × 17 cm).
- Position the ultrasonic recorder and camera for optimal monitoring.
- Load nebulizer with 100 µM of capsaicin solution. Deliver 30 s aerosol pulses every 2 min for 10 min.
- Record behaviors continuously using the ultrasonic recorder and the camera.
5. Data analysis process
- Whole-body plethysmography (WBP) respiratory tracing analysis
- Import the WBP recorded text files into Spike2 software and synchronize them with audio signals.
- Analyze the audio signals corresponding to single-peak and double-peak breathing patterns, and record the duration of the compression phase for each pattern.
- Select the lowest point of the expiratory phase as the midpoint, and take the data from half a second before and after for calculating the average value.
- Audio waveform analysis
- Import audio files into Spike2 software, select individual cough or sneeze audio, and export them as TXT format (with a sampling rate set to 100 kHz and duration of 0.1 s).
- Import the TXT files into Excel, and convert them into the absolute values of the audio signals.
- Use GraphPad Prism software to smooth the absolute values of the audio waveforms using a smoothing spline with 50 points.
NOTE: To ensure the curve closely approximates the original data while avoiding excessive inflection points, selecting a smoothing spline of 50 points is optimal; curves generated with values greater than 50 points show negligible deviation from the 50-parameter curve. - Based on the smoothed audio waveforms, calculate the slope k from the starting point to the highest point.
- Audio spectral analysis
- Import audio files into Spike2 software.
- Select the start and end time points of individual cough or sneeze audio for spectral analysis, and export the spectral analysis results.
- Use GraphPad Prism to generate spectral analysis curves and calculate the area under the curves.
- Calculate the ratio of the area under the curve between the 30-60 kHz and 0-30 kHz frequency bands to distinguish between coughing and sneezing.
- Composite index calculation
- Perform a natural logarithm transformation (ln) on the slope k and the ratio of the area under the spectral analysis curve to enhance the discriminability of the data.
6. Statistical analysis
- Data are presented as the mean ± SEM. Statistical comparisons between two groups were performed using the t-test and two-way ANOVA, with a P < 0.05 considered statistically significant. All analyses were conducted with GraphPad Prism software.
Results
In this study, we conducted a detailed analysis of the respiratory patterns of mouse coughing and sneezing behaviors using whole-body plethysmography (WBP) and ultrasound recording techniques. The results showed that mice subjected to tracheal or nasal surgery demonstrate comparable cough and sneeze responsiveness to naive controls. However, capsaicin (chemical) and mechanical stimulation effectively evoke cough and sneeze reflexes in these surgically prepared animals (Figure 2A,B). WBP results revealed that both behaviors exhibited single- and double-peak patterns, with their sound signals appearing during the expulsive stage of the respiratory pattern (Figure 3A,C,E,G). Further ultrasound analysis revealed distinct acoustic profiles: Cough sounds exhibited abrupt onset with peak intensity occurring instantaneously, predominantly within 0-30 kHz frequency range, and shorter duration (Figure 3B,D; Supporting Video S1). Sneeze sounds demonstrated progressive intensity buildup to maximum amplitude, broadband frequency distribution (0-80 kHz), and prolonged duration (Figure 3F,H; Supporting Video S2). Statistical analysis revealed that the average compression phase of single-peak coughing behavior was 32.39 ± 0.73 ms, significantly shorter than that of double-peak coughing behavior at 53.17 ± 2.29 ms (Figure 4A,B,C). The average compression phase of single-peak sneezing behavior was 44.03 ± 1.84 ms, lower than the average value of double-peak coughing behavior, while the average compression phase of double-peak sneezing behavior was 74.24 ± 1.29 ms, significantly longer than that of single-peak sneezing behavior (Figure 4E,F,G). Additionally, the occurrence ratio of single-peak pattern in coughing behavior was 77.55 ± 2.10% (Figure 4D), while in sneezing behavior, the single-peak pattern accounted for only 32.42 ± 5.88%, with the double-peak pattern making up 67.58 ± 5.88% (Figure 4H). The statistical analysis of audio duration indicated significant differences between coughing and sneezing audio times, but there was considerable overlap between the two (Figure 5A). Through spectral analysis of the ultrasound audio of coughing and sneezing, we found that the frequency spectrum of coughing audio was mainly concentrated in the 0-30 kHz range, while sneezing audio had a higher proportion in the 0-60 kHz range (Figure 5B). Although coughing audio also had frequencies in the 30-120 kHz range, the proportion of low frequencies was always higher than that of high frequencies. Therefore, we used the slope of sound intensity from the starting point to the maximum value (Figure 5C) as the vertical coordinate and the energy ratio of 30-60 kHz to 0-30 kHz (Figure 5D) as the horizontal coordinate to establish a coordinate system, which could effectively distinguish coughing and sneezing audio. In addition, there were no significant differences between single- and double-peak coughing as well as single- and double-peak sneezing in this coordinate system (Figure 5E).
Next, we employed the aforementioned classification methods to categorize the coughing and sneezing behaviors induced by capsaicin nebulization in mice. We found that the coughing and sneezing behaviors induced by capsaicin nebulization overlap with those evoked by specific stimulation on the same coordinate positions (Figure 5F,G). Following transection of nasal sensory afferent nerves (anterior ethmoidal and infraorbital nerves), capsaicin nebulization significantly reduced sneeze-associated acoustic signals while cough-related audio profiles remained unaffected (Figure 5H,I).
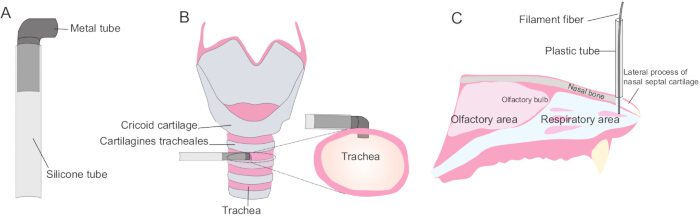
Figure 1: Schematic diagram of the operation in the stimulated trachea and nasal cavity model. (A) Schematic representation of the catheter implanted into the trachea.(B) Frontal (left) and coronal (right) planes show the position of the catheter implanted into the trachea of the mouse. (C) The sagittal plane shows the position of catheter implantation in the nasal cavity and the position of filament fiber stimulation. Please click here to view a larger version of this figure.
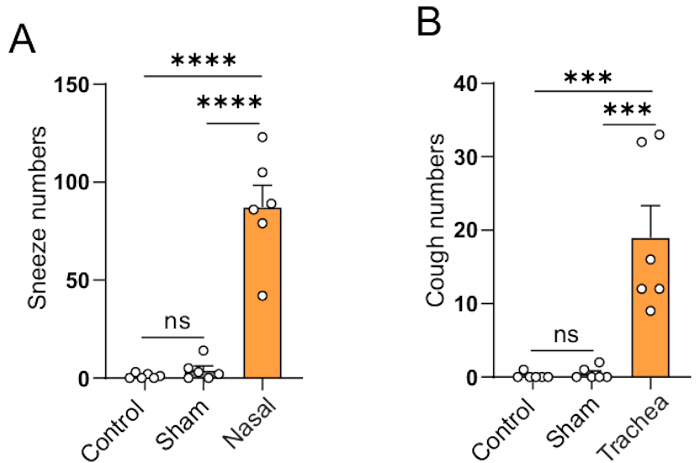
Figure 2: Quantification of cough- and sneeze-like behaviors elicited by site-specific stimulation. (A) Sneeze quantification of the normal control group, sham group, and mechanical nasal stimulation group. The sham group exhibited comparable sneeze frequency to controls. Mechanical nasal stimulation evoked a significant increase in sneeze events. (B) Cough quantification of the normal control group, the sham group, and the capsaicin tracheal challenge group. The sham group showed no significant difference in cough frequency compared to controls. Capsaicin tracheal stimulation significantly increased cough counts. Data are represented as the mean ± SEM, ***P < 0.001, ****P < 0.0001. Please click here to view a larger version of this figure.
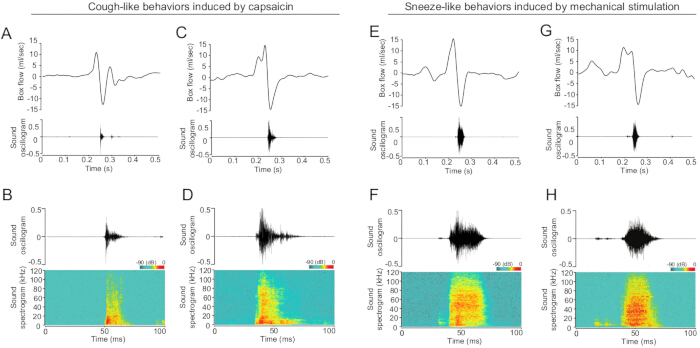
Figure 3: The respiratory traces and sound oscillogram of coughing and sneezing. (A) Representative images showing the single peak respiratory trace and audio recording during a cough induced by capsaicin. (B) The sound oscillogram (top) and spectrogram (bottom) of the cough audio recording in A. (C) Representative images showing the double peaks respiratory trace and audio recording during a cough induced by capsaicin. (D) The sound oscillogram (top) and spectrogram (bottom) of cough audio recording in C. (E) Representative images showing the single peak respiratory trace and audio recording during a sneeze induced by mechanical stimulation. (F) The sound oscillogram (top) and spectrogram (bottom) of the sneeze audio recording in E. (G) Representative images showing the double peaks respiratory trace and audio recording during a sneeze induced by mechanical stimulation. (H) The sound oscillogram (top) and spectrogram (bottom) of the sneeze audio recording in G. Please click here to view a larger version of this figure.
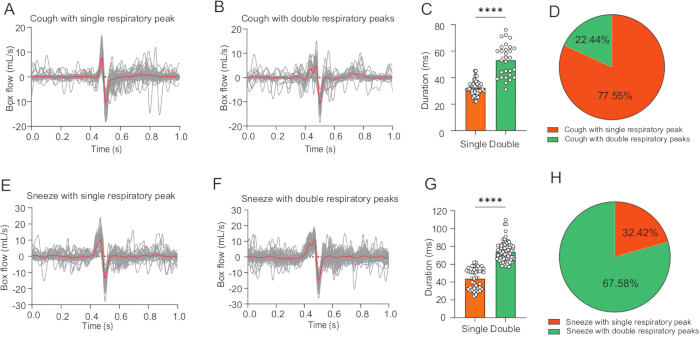
Figure 4: The single and double peaks of the respiratory traces of cough-like and sneeze-like behaviors. (A) Average (red) and individual (gray) and average (red) respiratory traces of cough-like behaviors with a single respiratory peak (n = 52).(B) Average (red) and individual (gray) and average (red) respiratory traces of cough-like behaviors with double respiratory peaks (n = 29).(C) Duration of single and double respiratory peaks compressive phases for coughs induced by capsaicin (single peak n = 52, double peaks n = 29). (D) The average ratio of single and double respiratory peak traces in cough (n = 6 mice). (E) Average (red) and individual (gray) and average (red) respiratory traces of sneeze-like behaviors with single respiratory peaks (n = 40). (F) Average (red) and individual (gray) and average (red) respiratory traces of sneeze-like behaviors with double respiratory peaks (n = 74). (G) Duration of single and double respiratory peaks compressive phases for sneezes induced by mechanical stimulation (single peak n = 40, double peaks n = 74). (H) The average ratio of single and double respiratory peak traces in sneeze (n = 6 mice). Data are represented as the mean ± SEM, ****P < 0.0001. Please click here to view a larger version of this figure.
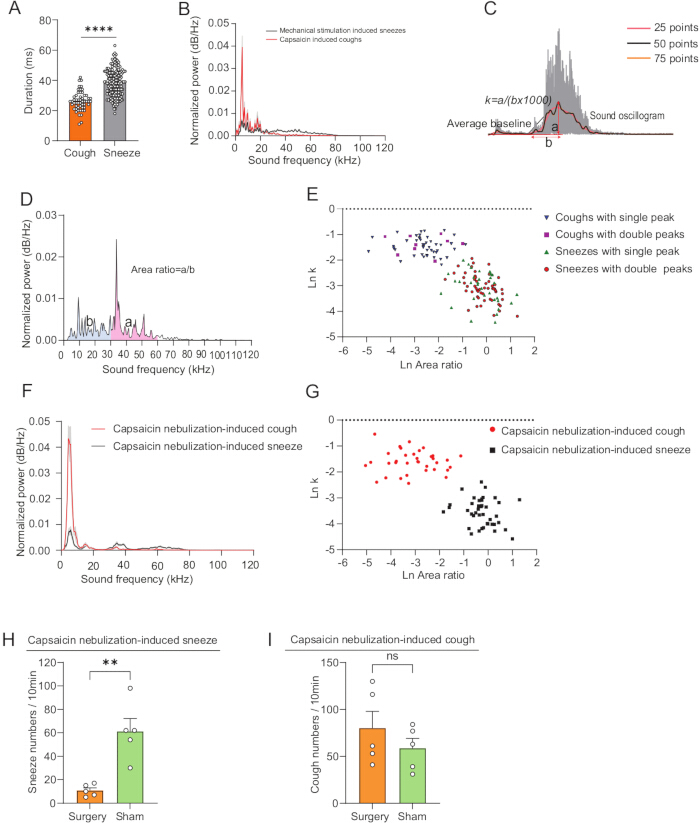
Figure 5: The frequency and waveform classification of coughing and sneezing sound oscillogram. (A) Quantification of sonogram durations of coughs and sneezes.(B) The average spectrogram analysis of mechanical stimulation-induced sneezes (n = 69, black) and capsaicin-induced coughs (n = 140, red).(C) A representative schematic diagram for calculating the slope of a sound oscillogram. Comparative analysis of the smoothing spline reveals that at 25 points, excessive smoothing obscures original data features, whereas values exceeding 50 points (e.g., 75 points) show substantial overlap with the 50-spline curve but introduce additional inflection points.(D) A representative schematic diagram of area ratio calculation, using spectral analysis results to calculate the area under different frequency curves in GraphPad Prism. The area ratio is equal to the area under the 30-60 kHz curve and the area under the 0-30 kHz curve.(E) The frequency and waveform classification of mechanical stimulation-induced sneezes and capsaicin-induced coughs sound oscillogram, with the y-axis representing the exponent of the slope of the sound waveform from baseline to peak, and the x-axis representing the exponent of the ratio of sound waves between 30-60 kHz and 0-30 kHz.(F) The average spectrogram analysis of capsaicin nebulization-induced sneezes (n = 36, black) and capsaicin nebulization-induced coughs (n = 42, red). (G) The frequency and waveform classification of capsaicin nebulization-induced sneezes (n = 36, black) and capsaicin nebulization-induced coughs (n = 42, red) sound oscillogram, with the y-axis representing the exponent of the slope of the sound waveform from baseline to peak, and the x-axis representing the exponent of the ratio of sound waves between 30-60 kHz and 0-30 kHz. (H) Statistical data on capsaicin-induced sneeze reflex in groups with transected anterior ethmoidal and infraorbital nerves versus the sham surgery group. (I) Statistical data on capsaicin-induced cough reflex in groups with transected anterior ethmoidal and infraorbital nerves versus the sham surgery group. Data are represented as the mean ± SEM, **P < 0.01, ****P < 0.0001. Please click here to view a larger version of this figure.
Supplementary Video 1: Video of cough-like behavior synchronized with its audio spectrogram, displayed at normal and 0.1x speed. Please click here to download this File.
Supplementary Video 2: Video of sneeze-like behavior synchronized with its audio spectrogram, displayed at normal and 0.1x speed. Please click here to download this File.
Discussion
In this study, we successfully induced coughing and sneezing behaviors in mice by specifically stimulating the trachea with capsaicin and mechanically stimulating the nasal cavity8,17. We synchronously collected data from whole-body plethysmography (WBP), audio, and video recordings, and found that audio frequency ratios and sound intensity slopes could effectively differentiate between coughing and sneezing behaviors in mice8,23.
Given the delicate nature of the surgical procedures involved, special attention must be paid to several critical steps. First, during tracheal surgery, the implanted intratracheal cannula must be as thin as possible and inserted at a shallow depth to avoid airway obstruction, which could lead to respiratory distress or even mortality. Moreover, as secretions within the trachea can easily block the catheter, daily catheter clearance is crucial. When administering capsaicin, the injection speed must be carefully controlled to prevent retrograde flow into the nasal cavity, which could trigger sneezing reflexes. Second, during the nasal bone implantation surgery, the size of the hole drilled is crucial to avoid excessive damage to the mouse. The catheter should be placed on the level of the nasal bone without being inserted too deeply, to prevent excessive irritation of the nasal cavity or interference with normal respiration. Ultimately, the implementation of precise surgical procedures is essential for the experiment. By minimizing injury to the mouse, not only can recovery be accelerated, but also more accurate experimental behavioral responses can be recorded. Such surgical methods help enhance the reliability of the model and ensure high-quality data, thereby providing a solid experimental foundation for studying respiratory reflex behaviors such as coughing and sneezing.
Traditionally, coughing behavior modeling has relied on nebulization of compounds like capsaicin and citric acid to induce coughing24,25. However, this approach carries notable limitations: it not only elicits coughing but also may concurrently trigger sneezing reflexes8,22. Furthermore, significant inter-individual variability in sensitivity to aerosolized stimuli has been observed26, and a subset of mice exhibited no cough response at all. In contrast, the novel mechanical stimulation paradigm developed in this study achieves stable cough-like behaviors while allowing flexible customization of stimuli through interchangeable actuators. Similarly, conventional sneeze models employing aerosolized agents suffer from poor behavioral specificity, as they frequently evoke collateral coughing22, thereby complicating differentiation between these distinct respiratory reflexes.
Previous studies have established mouse cough and sneeze models using capsaicin, and differentiated the two based on the characteristics of respiratory patterns (single or double peaks) recorded by whole-body plethysmography (WBP)8. Our research data indicates that in induced coughing behavior, the single-peak breathing pattern accounted for 77.55 ± 2.10% of occurrences, while in sneezing behavior, the single-peak pattern accounted for 32.42 ± 5.88%. These results confirm that the classification method based on WBP respiratory patterns is effective in most cases but exhibits limitations and does not permit perfect differentiation between the two behaviors. Additionally, some studies have attempted to distinguish coughing from sneezing using the duration and frequency characteristics of audio signals22. Although the average duration of audio signals for sneezing behavior is typically longer than for coughing, substantial overlap exists between the durations of individual events. Therefore, relying on audio duration as a distinguishing indicator may lack sufficient discrimination. Furthermore, spectral analysis of coughing and sneezing has not revealed a clear boundary: mild coughs may only manifest as low-frequency signals, while vigorous coughs can produce sounds that include significant high-frequency components, with spectral characteristics similar to those of sneezing. Notably, cough events consistently exhibit a higher proportion of low-frequency energy. In contrast, the ratio of high-frequency to low-frequency energy (High-to-Low Frequency Energy Ratio) may provide a more discriminative acoustic feature for distinguishing between coughing and sneezing behaviors.
Our innovation addresses these limitations through spatially constrained mechanical stimulation. The refined behavioral model demonstrates dual advantages: (1) millimeter-level precision in stimulus application stabilized probes, and (2) enhanced behavioral specificity. Furthermore, our extensive analysis of cough and sneeze acoustics reveals that these behaviors exhibit distinct sound intensity profiles, with statistically significant differences in their high-to-low frequency energy ratios. Furthermore, our comprehensive acoustic analysis of cough and sneeze events reveals distinctive sound intensity profiles between these behaviors, accompanied by statistically significant differences in their high-to-low frequency energy ratios. Moreover, this classification method is also feasible in the acoustics recordings of coughing and sneezing behaviors induced by capsaicin nebulization. Collectively, these acoustic parameters enabled the development of a multidimensional feature space that establishes an objective, quantifiable standard for differentiating cough and sneeze. The result establishes a good standard for investigating airway defense mechanisms with reduced confounders and improved reproducibility. This not only resolves longstanding challenges in respiratory reflex research but also opens avenues for precise neuromodulation studies of cough and sneeze neural circuits.
Although this method effectively induces coughing and sneezing behaviors in mice, it still has some limitations. Compared to nebulization induction, surgery may cause some degree of injury to mice, even though we strive to minimize damage during the procedure. Nonetheless, the surgery can still stably elicit coughing and sneezing behaviors, indicating that the surgery itself does not diminish the sensitivity of mice to these stimuli. Technical challenges also emerged in behavioral phenotyping. Acoustic signal fidelity required precise calibration of microphone placement from the subject to balance signal-to-noise ratios while avoiding amplitude saturation. Furthermore, the integration of stimulus delivery catheters with whole-body plethysmography (WBP) chambers necessitated specialized designs: the catheter must extend from the top of the chamber without hindering the mouse's natural movements or the delivery of the stimulus. In summary, despite the limitations of the surgical method, it provides an effective means of stably inducing coughing and sneezing behaviors in mice, and with a carefully designed experimental process, injury to the mouse can be minimized to ensure accurate behavioral data collection.
In conclusion, through these delicate surgical manipulations and rigorous experimental design, we have established a model that stably induces coughing and sneezing behaviors in mice, providing a reliable experimental foundation for further study of these two respiratory reflex behaviors.
Disclosures
The authors have nothing to disclose.
Acknowledgements
This work is supported by the National Key R&D Program of China (STI2030-Major Projects-2021ZD0202400 to C.S.), the National Natural Science Foundation of China (32422032 and 32271069 to C.S.), Guangdong special support plan (2023TQ07A609 to C.S.), Major Project of Guangzhou National Laboratory (MP-GZNL2024A02001-02 and Grant No. GZNL2024A02001 to C.S.). All data are archived in Guangzhou National Laboratory.
Materials
| Name | Company | Catalog Number | Comments |
|---|---|---|---|
| 0.25mm nylon filament | https://item.taobao.com/item.htm?app =weixin&bc_fl_src=share-1041234389 826863-2-1&bxsign=scdVy4Xlh07ZND yojKnPqZ8vQnR_0pjarQFoQH9h636l au-W1sONf-RPbGobT6VinB8J0CrFC xRXoB-tghl13JMFQh3DrBLpqflgMRg DY2repq1fcQGIoPm4AuDfQSUQXE p&cpp=1&h5_spm=a-tb-item.b-tb-ite m&id=595514372480&share_crt_ v=1&shareurl=true&short_name=h .hIi5xvPc8rHTjez&sp_tk=eDdVczR SSG1vODU%3D&spm=a2159r.13 376460.0.0&tbSocialPopKey=shar eItem&tk=x7Us4RHmo85&un=b3 859eab62ef44248bd7bab98ffeb2 63&un_site=0&ut_sk=1.ZZv9EYy wWWkDAI%2FaThaoYLYt_2164 6297_1755074424775.TaoPassw ord-WeiXin.1&wxsign=tbwr_qqSc esj7OBC_MTN-urBRm3r6GFm9t SERXxmOXNfgDGI3usP8mgVRu QmtuQ3LRrt9OkMGFP3XV55Hpp DzZZUQ4jUaki80cL79BKkrc85YE 5VYZfdiqppGkhao6kzkKF&x-ssr=true | ||
| 28G needle | https://item.taobao.com/item.htm? app=weixin&bc_fl_src=share-1041 234389566731-2-1&bxsign=scdfvM o7l21o6H5xXAgtKjf4TGT54QtHpk ED6yQRvvPvkGUKWiNyteUooM8e 6wcMmSKQpRsUCHjVo1q6Cliyp61 S3Nr1VadjTYKEJ1_SxSFZln_zI-0U omdKkkegvM6O5Rr&cpp=1&h5_sp m=a-tb-item.b-tb-item&id=670272 286239&share_crt _v=1&shareurl=true&short_name= h.hIiUFWFOj35n1LJ&sp_tk=eHFJ QTRSSE9xZDc%3D&spm=a2159 r.13376460.0.0&tbSocialPopKey= shareItem&tk=xqIA4RHOqd7&un =b3859eab62ef44248bd7bab98ff eb263&un_site=0&ut_sk=1.ZZv9 EYywWWkDAI%2FaThaoYLYt_2 1646297_1755074424775.TaoPa ssword-WeiXin.1&wxsign=tbwwJc wF20yLPkLax6kR7BPCJ3uPXx_ KPLTBjHUIph1nmN96mu0vYRC 0-DQxpG6mWPKWPZwSElseb HTR6nMzL7zthSG_67CIodTi_3i bFk7SKNFmbLeg1MVSDl9YzKs axPI&x-ssr=true | ||
| 2-methyl-2-butanol | Sigma-Aldrich | 240486-100ML | |
| Avisoft RECORDER USGH | Avisoft | For ultrasonic recording | |
| Brain Stereotactic Injector | RWD | 68801 | |
| Capsaicin | MCE | HY-10448 | |
| Electronic Balance | Shanghai ZhuoJing | BSM-220.4 | |
| GraphPad Prism | GraphPadSoftware | Used for graphs and data analysis | |
| High Speed Camera System | Filr | 20102748 | |
| Iodophor | LIRCON | https://www.lircon.cn/products_details/218.html | |
| Microinjection pump | XIMAINANOTECH | XMSP-C | |
| Modeling clay | https://detail.tmall.com/item.htm? | ||
| Nebulizer | YUWELL | M105 | For the atomization of capsaicin |
| PE Tubing | RWD | 62323 | |
| Silicone tubing | https://item.taobao.com/item.htm? id=618505617112&pisk=gFrice1c WPu1u5K6Stm15sEF8l7d5cijiSK xMmhV8XlBXSntDD-EBYH2ux8Z Ty27ifBf5cUniWPn_S2fCxl4gScY WwI8CRij0_Uc2ge6-dJRw5xZ3p Wqex8NpV5Fxrz-0_CR2epE51n 4Mg0bwy8EFXkZ3m8NK2krnmk Z7jWnTxDWuCPq09XnnYxw_xu qLMksIm8q7n-ULYH-QCuZ72W nhX8Z0mPqY9DjTjoq0b1J0bq4A k5cCgtoXJh0xA0iaJbW0nvrQQhu QN-D0k4n8bR-tn-4xA2cQfKHqZ hzPf3-MWSpjm2En5hLag-nY44 7HxVGjhoT8yZsXkCkMVmK_4z q-OSaKccirl3lD1igu5Zm5PvfFJo aOzGS7w1IKlE-obgHT1yLKfuuo5 CB0fUuLW08vBK-cWa4gxVesglW 8U8O0ngpWb8XlVkIKbKQBDHRe 4RzM9XHPNgZdACRK9YXlVkIKb BhKUOj7vMOw&spm=a21xtw.291 78619.0.0 | ||
| Spike2 software | Spike2 | Used for respiratory trace and audio analysis | |
| SpinView | Filr | Used for high-speed video recording | |
| Tribromoethanol | Sigma-Aldrich | T48402-100G | |
| UltraSoundGate 116Hme | Avisoft | 116Hme/63 | |
| WBP admiad software | TOW-INT-TECH | Used for WBP recording | |
| WBP body plethysmography system | TOW-INT-TECH | 2403-3204 |
References
- Umayahara, Y., et al. Clinical significance of cough peak flow and its non-contact measurement via cough sounds: a narrative review. Appl Sci (Basel). 10 (8), 2782(2020).
- Nonaka, S., Unno, T., Ohta, Y., Mori, S. Sneeze-evoking region within the brainstem. Brain Res. 511 (2), 265-270 (1990).
- Canning, B. J., et al. Anatomy and neurophysiology of cough: chest guideline and expert panel report. Chest. 146 (6), 1633-1648 (2014).
- Mazzone, S. B., Undem, B. J. Vagal afferent innervation of the airways in health and disease. Physiol Rev. 96 (3), 975-1024 (2016).
- Canning, B. J., et al. Identification of the tracheal and laryngeal afferent neurones mediating cough in anaesthetized guinea-pigs. J Physiol. 557 (Pt 2), 543-558 (2004).
- Driessen, A. K., et al. A role for neurokinin 1 receptor-expressing neurons in the paratrigeminal nucleus in bradykinin-evoked cough in guinea-pigs. J Physiol. 598 (11), 2257-2275 (2020).
- Lu, H., Cao, P. Neural mechanisms underlying the coughing reflex. Neurosci Bull. 39 (12), 1823-1839 (2023).
- Gannot, N., et al. A vagal-brainstem interoceptive circuit for cough-like defensive behaviors in mice. Nat Neurosci. 27 (9), 1734-1744 (2024).
- Bourouiba, L., Dehandschoewercker, E., Bush, J. W. M. Violent expiratory events: on coughing and sneezing. J Fluid Mech. 745, 537-563 (2014).
- Al-Biltagi, M., Bediwy, A. S., Saeed, N. K. Cough as a neurological sign: what a clinician should know. World J Crit Care Med. 11 (3), 115-128 (2022).
- Korpás, J., Tomori, Z. Cough and other respiratory reflexes. , Karger, Basel. (1979).
- Rui, Y., et al. The sneeze reflex in physiological and pathological states: a mini review. Front Neurosci. 19, 1598027(2025).
- Batsel, H. L., Lines, A. J. Discharge of respiratory neurons in sneezes resulting from ethmoidal nerve stimulation. Exp Neurol. 58 (3), 410-424 (1978).
- Wallois, F., Bodineau, L., Macron, J. M., Marlot, D., Duron, B. Role of respiratory and non-respiratory neurones in the region of the NTS in the elaboration of the sneeze reflex in cat. Brain Res. 768 (1-2), 71-85 (1997).
- Hersch, M. Loss of ability to sneeze in lateral medullary syndrome. Neurology. 54 (2), 520-521 (2000).
- Cauna, N., Hinderer, K. H., Wentges, R. T. Sensory receptor organs of the human nasal respiratory mucosa. Am J Anat. 124 (2), 187-209 (1969).
- Simera, M., et al. Interactions of mechanically induced coughing and sneezing in cat. Respir Physiol Neurobiol. 205, 21-27 (2015).
- Burke, W. Why do we sneeze. Med Hypotheses. 78 (4), 502-504 (2012).
- Hiramatsu, Y., et al. The mechanism of pertussis cough revealed by the mouse-coughing model. mBio. 13 (2), e0319721(2022).
- Chen, L., et al. Establishment of a mouse model with all four clinical features of eosinophilic bronchitis. Sci Rep. 10 (1), 10557(2020).
- Li, F., et al. Sneezing reflex is mediated by a peptidergic pathway from nose to brainstem. Cell. 184 (14), 3762-3773.e10 (2021).
- Lu, H., et al. Brainstem opioid peptidergic neurons regulate cough reflexes in mice. Innovation (Camb). 5 (6), 100721(2024).
- Ludlow, C. L. Laryngeal reflexes. J Clin Neurophysiol. 32 (4), 284-293 (2015).
- Laude, E. A., Higgins, K. S., Morice, A. H. A comparative study of the effects of citric acid, capsaicin and resiniferatoxin on the cough challenge in guinea-pig and man. Pulm Pharmacol. 6 (3), 171-175 (1993).
- Nascimento, L. A., Fonseca, L. F., Rosseto, E. G., Santos, C. B. Development of a safety protocol for management of thirst in the immediate postoperative period. Rev Esc Enferm USP. 48 (5), 834-843 (2014).
- Meisel, A., et al. Detection of mouse cough based on sound monitoring and respiratory airflow waveforms. PLoS One. 8 (3), e59263(2013).
Reprints and Permissions
