Here, we describe an in vitro protocol to model hypoxia/reoxygenation damage in the highly metabolic proximal tubular epithelial cells. This model is designed to induce metabolic stress-induced damage, which can be measured through the expression of proximal tubule damage markers and assessment of mitochondrial respiratory function.
Method Article
Modeling Hypoxia/Reoxygenation Injury in Proximal Tubular Epithelial Cells
In This Article
Summary
Abstract
Kidney transplantation accounts for approximately 60%-65% of all transplanted solid organs. Most donor kidneys are obtained from deceased individuals, requiring extended cold preservation, which is a known contributor to poor transplant outcomes. Despite current preservation strategies, ischemia-reperfusion injury (IRI) remains an unavoidable consequence of transient blood flow interruption, leading to oxygen and nutrient deprivation. Within the nephron, proximal tubular epithelial cells (PTECs) of the S3 segment are particularly susceptible to IRI due to their high metabolic demand and dependence on mitochondrial oxidative phosphorylation. At the molecular level, IRI disrupts mitochondrial metabolism and reduces ATP production, compromising the energy requirements of proximal tubular epithelial cells (PTECs) and promoting apoptosis and necrosis. To investigate these mechanisms and evaluate potential therapeutic strategies, robust and reproducible in vitro models of renal IRI that accurately recapitulate the metabolic vulnerability of PTECs are essential. Here, we describe a protocol for the induction and assessment of hypoxia/reoxygenation (H/R) injury in murine immortalized PTECs (IM-PTECs). The protocol includes detailed information on the medium composition and culture conditions required to maintain these cells, followed by the induction of H/R injury through controlled hypoxia and reoxygenation phases that closely mimic the ischemia and reperfusion events in transplanted kidneys. This model provides a valuable platform for evaluating the effects of different interventions on renal epithelial cells exposed to H/R injury. The impact of these treatments can be assessed through the analysis of the expression of markers associated with PT damage, as well as through the assessment of the mitochondrial respiratory function. Together, these readouts offer mechanistic insights into compound efficacy and cellular recovery processes, supporting the development of targeted therapies for renal IRI.
Introduction
According to the Global Observatory on Donation and Transplantation, kidney transplantation accounts for approximately 60%-65% of all solid organ transplants worldwide, with the number of procedures performed in 2023 being nearly three times higher than that of liver transplants, the latter being the second most common type. In 61% of kidney transplants performed that year, the organ originated from deceased donors1, which involves a longer preservation period compared to transplants from living donors, where the waiting time is significantly shorter2. During this preservation period, kidneys are usually preserved using static cold storage in order to slow down cellular metabolism, which reduces oxygen and energy demand and therefore limits ischemic injury3. However, static cold storage provides only partial protection, as it cannot fully sustain cellular metabolism or oxygen delivery, leading to progressive metabolic dysfunction during preservation4,5. Alternatively, ex vivo normothermic preservation has emerged as a viable strategy to maintain the organ at near-physiological temperature, thereby supporting cellular metabolism and oxygenation, and consequently reducing ischemia-reperfusion injury (IRI)6.
However, during kidney transplantation, acute kidney injury (AKI) due to IRI is an unavoidable consequence. IRI results from the interruption of blood flow through the organ, leading to an imbalance between the supply and demand of oxygen and nutrients7. This process has a direct impact on the function of the transplanted kidney, and increases the risk of acute rejection and reduced long-term graft function8,9.
PTECs-especially abundant in the renal cortex-are particularly vulnerable to IRI. These cells constitute approximately 60%-70% of the tubular epithelium and are responsible for the reabsorption of most of the glomerular filtrate, including water, ions, glucose, and amino acids10. Their high metabolic activity is supported by an extensive mitochondrial network to meet ATP-dependent transport demands11. Consequently, they are extremely sensitive to metabolic disturbances, such as oxygen deprivation and mitochondrial dysfunction, both of which are central features of IRI12.
During IRI, the deprivation of oxygen disrupts mitochondrial oxidative phosphorylation, leading to ATP depletion and impaired reabsorption function13,14. This initiates a metabolic switch from fatty acid oxidation (FAO) to anaerobic glycolysis and activation of the pentose phosphate pathway, which, while temporarily protective, is insufficient to fully meet the energetic and redox demands of these cells15. If the suppression of FAO persists during the repair phase, lipid accumulation16 and lipotoxicity ensue17, further damaging the cells and impairing their regenerative capacity18. This maladaptive metabolic state can ultimately drive tubular atrophy, interstitial fibrosis, and progression to chronic kidney disease19.
This metabolic impairment, driven by defective FAO, hinders the ability to meet the high energetic demands of the renal tubule17,19. The resulting ATP depletion and lipid accumulation promote mitochondrial dysfunction and generation of reactive oxygen species, which activate pro-inflammatory signaling and leukocyte infiltration20,21,22. Persistent inflammation and oxidative injury destabilize mitochondrial integrity, amplifying energy failure and eventually triggering apoptotic and necrotic cell death23,24. During this acute-injury phase, specific biomarkers such as Kidney Injury Molecule 1 (KIM-1) and Neutrophil Gelatinase-Associated Lipocalin (NGAL) are upregulated, serving as sensitive indicators of proximal tubular damage and early AKI25.
Following acute injury, maladaptive repair mechanisms promote excessive extracellular matrix deposition, a hallmark of renal fibrosis26. Among the extracellular matrix components, collagen, particularly type I collagen (encoded by the Col1a1 gene), accumulates in the interstitial space, contributing to tubular atrophy and loss of functional parenchyma27. This fibrotic remodeling is largely driven by tubular senescence and partial epithelial-to-mesenchymal transition (pEMT) in tubular epithelial cells, ultimately leading to kidney functional decline28,29,30. The onset of renal pEMT and fibrosis assists the progression from AKI to chronic kidney disease (CKD), culminating in an irreversible loss of kidney function and compromised graft survival31,32.
In this protocol, we describe an in vitro model of H/R injury using mouse SV40-immortalized proximal tubular epithelial cells (IM-PTECs), subjected to controlled H/R conditions. Most preclinical studies of renal IRI have traditionally relied on animal models, which reproduce the complex vascular and immune responses of the kidney but entail higher costs, ethical concerns, and considerably higher biological variability33,34. These limitations have slowed the development of complementary cell-based systems valid for detailed mechanistic and high-throughput studies. This experimental setup allows for the reproducible simulation of oxygen deprivation and restoration, mimicking key features of IRI observed in transplanted kidneys. The model serves as a valuable tool for studying the cellular and molecular mechanisms underlying tubular injury, biomarker expression, and fibrotic responses in a controlled environment. Moreover, it provides a relevant platform for the screening and evaluation of potential therapeutic strategies aimed at preventing or mitigating ischemic damage and improving post-transplant outcomes.
Protocol
The cells used in this protocol were not isolated within the context of this study. They were previously isolated and made available by other researchers35. Therefore, no new animal experimentation was performed, and ethical approval was not required for the present work.
1. IM-PTEC culture
- Prepare L3 medium as described in Table 1.
- Thaw a vial of IM-PTECs. Culture approximately 1 x 10⁶ cells at 33 °C in a humidified incubator under standard conditions (5% CO2, atmospheric O2) until 80% confluence (usually reached after 3 days).
NOTE: IM-PTECs are isolated from Immorto mice. For a detailed protocol on IM-PTECs isolation, please refer to35. - Subculture cells 2x a week at an approximate 1:10 split ratio. For passaging, detach the adherent monolayer using 0.05% trypsin-EDTA for 2-3 min at 33 °C, neutralize with complete growth medium, and reseed in fresh culture flasks.
| Component | Quantity/Final Media Concentration |
| DMEM/F12 | 500 mL |
| Fetal calf serum (FCS) | 10% |
| Penicillin | 10,000 U/mL |
| Streptomycin | 10,000 µg/mL |
| L-glutamine | 0.02 µM |
| Insulin | 5 µg/mL |
| Transferrin | 5 µg/mL |
| Sodium Selenite | 5 µg/mL |
| Triiodothyronine | 40 pg/mL |
| Hydrocortisone | 36 ng/mL |
| Epidermal Growth Factor | 20 ng/mL |
| Interferon γ (IFN-γ) | 10 ng/mL |
Table 1: L3 medium composition.
2. Restrictive culture of IM-PTECs
- Subculture as described in step 1.3 and transfer the entire cell suspension from one T-25 flask of IM-PTECs into a T-75 flask containing approximately 10 mL of L3 medium without interferon-γ (IFN-γ). Culture at 37 °C under standard conditions until 80% confluence (usually reached after 3 days).
- Subculture as described in step 1.3 and transfer the entire cell suspension from one T-75 flask into two T-175 flasks containing approximately 20 mL of L3 medium without IFN-γ. Culture at 37 °C under standard conditions until 80% confluence (usually reached after 3 days).
- Plate IM-PTECs for experiments by detaching cells from confluent cultures using 0.05% trypsin-EDTA, resuspending them in complete medium, and seeding at the desired density (approximately 1 x 10⁵). Use 6-well plates for molecular marker expression analysis, or 96-well cell culture microplates suitable for mitochondrial respiration studies.
NOTE: For other experiments, use a suitable culture format.- When plating cells in a 96-well cell culture microplate for mitochondrial respiration studies, leave the four wells at the corners empty to use them as background correction. Leave the microplate for 1 h at room temperature before placing it in the incubator to allow cells to settle.
3. Hypoxia/reoxygenation procedure (Figure 1)
- Refresh IM-PTECs by removing culture media and adding fresh L3 medium without IFN-γ (0.1 mL/well for 96-well plates or 2 mL/well for 6-well plates). Place cells into a hypoxia incubator at 1% O2, 5% CO2, at 37 °C for 48 h.
- Remove cells from the hypoxia incubator and refresh them with L3 medium without IFN-γ. Place cells into a cell culture incubator at standard O2 conditions and 5% CO2 at 37 °C for 24 h.
NOTE: Hypoxic conditions can be achieved using either a hypoxia incubator or a modular hypoxia chamber connected to a controlled gas supply.
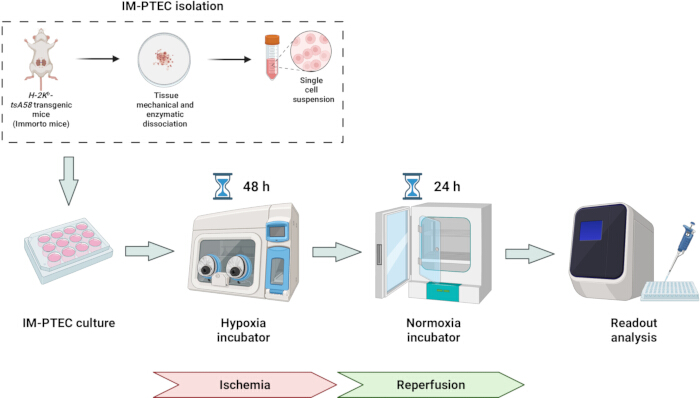
Figure 1: Schematic representation of the in vitro H/R model in immortalized proximal tubular epithelial cells (IM-PTECs). IM-PTECs derived from H-2Kb-tsA58 transgenic (Immorto) mice were cultured under normoxic conditions, exposed to hypoxia (1% O2, 48 h), and subsequently reoxygenated (standard O2 conditions, 24 h), for readout analysis. Please click here to view a larger version of this figure.
4. Analysis of the expression of molecular markers
- RNA isolation
- Add 800 µL of RNA isolation reagent to each well of a 6-well plate. Incubate for 5 min at room temperature. Transfer the samples to RNAse-free 1.5 mL microcentrifuge tubes.
- Add 200 µL of chloroform and mix well for 15 s by pipetting. Incubate at room temperature for 2-3 min.
- Centrifuge at 12,000 x g at 4 °C for 12 min. Transfer the aqueous top phase to a RNAse-free 1.5 mL microcentrifuge tube.
- Add 500 µL of isopropanol. Incubate at room temperature for 10 min. Centrifuge at 12,000 x g at 4 °C for 10 min.
- Discard the supernatant and wash the pellet with 1 mL of 70% ethanol. Centrifuge at 5,000 x g at 4 °C for 5 min. Discard the supernatant.
- Air-dry the pellet. Dissolve the pellet in 12 µL of RNAse-free water.
- Heat the sample at 56 °C for 15 min. Measure RNA concentration in a microvolume UV-Vis spectrophotometer.
NOTE: Always keep the samples on ice between incubation steps to avoid RNA degradation.
- Reverse transcription
- On ice, add the following reaction components to a RNAse-free 0.2 mL microcentrifuge tube: 10 µL of Master Mix (2x), 2 µL of Enzyme Mix, 1-5 µg RNA, and up to 20 µL of nuclease-free H2O.
- Mix gently and incubate at 25 °C for 10 min followed by incubation at 50-55 °C for 10 min.
- Inactivate the reaction by heating at 85 °C for 5 min and chill on ice. Dilute cDNA at 1:5 or 1:10.
- Real-Time Quantitative PCR (RT-qPCR)
- Prepare primer sets by mixing them at a final concentration of 10 µM (Table 2).
- For each gene to measure, prepare a Real-Time (RT) qPCR mix containing the following reagents per well: 5 µL of RT-qPCR Master Mix; 0.4 µL of 10 µM forward primer, 0.4 µL of 10 µM reverse primer, and 2.2 µL of nuclease-free H2O.
- Add 8 µL of the RT-qPCR mix to each well of a 384-well PCR plate. Add 2 µL of cDNA sample to each well, leaving a drop on the edge of the well.
- After adding all the samples, tap the plate gently until all drops fall in the wells. Seal the plate firmly with its membrane. Spin the 384-well PCR plate.
- Measure in an RT qPCR System with the following program: 98 °C for 30 s, 40 cycles of 98 °C for 10 s followed by 60 °C for 30 s, and a melting curve at 95 °C.
| Gene | Primer sequences |
| Kim-1 | F: 5' - TGGTTGCCTTCCGTGTCTCT |
| R: 5' - TCAGCTCGGGAATGCACAA | |
| Ngal | F: 5' - ATGTCACCTCCATCCTGGTCAG |
| R: 5' - GCCACTTGCACATTGTAGCTCTG | |
| Acta2 | F: 5' - GCCATCTTTCATTGGGATGGA |
| R: 5' - CCCCTGACAGGACGTTGTTA | |
| Col1a1 | F: 5' - CCTCAGGGTATTGCTGGACAAC |
| R: 5' - CAGAAGGACCTTGTTTGCCAGG |
Table 2: Primer sequences used for RT-qPCR.
5. Mitochondrial respiratory function assessment
- Day prior to assay
- Turn on the oxygen consumption rate (OCR)/extracellular acidification rate (ECAR) analyzer and allow it to warm up at least 5 h before the experiment.
- Hydrate a sensor cartridge at 37 °C in a non-CO2 incubator overnight.
- Day of assay
- Prepare assay medium for one 96-well cell culture microplate containing: 33.4 mL of DMEM medium pH 7.4; 0.875 mL of glucose 1 M (final concentration 25 mM); 0.35 mL of pyruvate 100 mM (final concentration 1 mM); and 0.35 mL of Glutamine 200 mM (final concentration 2 mM).
- Prepare inhibitor solutions as per Table 3.
- Remove the assembled Sensor Cartridge from the incubator. Load 25 µL of each inhibitor into its corresponding port using a multichannel pipette and a loading guide.
- Remove cell culture growth medium from the cell culture microplate. Add 175 µL of pre-warmed (37 °C) assay medium to each well using a multichannel pipette.
- Place the cell culture microplate into a 37 °C non-CO2 incubator for 45-60 min prior to the assay.
- Place the calibration plate with the loaded sensor cartridge in the OCR/ECAR analyzer for calibration.
- Place the cell culture microplate in the instrument for measurement.
- After the run, save the cell culture microplate for quantification of total protein for data normalization.
| [Cartridge] (µM) | [Assay medium] (µM) | Port A | Port B | Port C | |
| Oligomycin | 12 | 1.5 | 8.4 µL | ||
| FCCP | 9 | 1 | 6.3 µL | ||
| Antimycin A | 25 | 2.5 | 17.5 µL | ||
| Rotenone | 12.5 | 1.25 | 8.75 µL | ||
| Assay medium | 3.5 mL | 3.5 mL |
Table 3: Inhibitor solutions for the assessment of mitochondrial respiration.
Results
A time-course validation was first performed to determine the optimal hypoxia/reoxygenation (H/R) conditions to reproduce ischemic injury in IM-PTECs. Caspase-3 activation, a hallmark of renal ischemia-reperfusion injury both in vivo and in vitro, was used as an indicator of model fidelity36,37. We found that 48 h of hypoxia followed by 24 h of reoxygenation produced the greatest increase in caspase-3 activity. Cell viability, assessed by the MTT assay, remained comparable to that of normoxic controls under these conditions, indicating that while apoptotic signaling was initiated, cells remained viable for subsequent pharmacological testing (Supplementary Figure 1). This validated protocol was then used to induce H/R injury through controlled hypoxia/reoxygenation of IM-PTECs.
After the ischemic insult, RT-qPCR was performed to determine the expression of several markers of kidney damage (Figure 2). RT-qPCR showed that, in the context of IRI, the expression of Kim-138,39and Ngal40,41, known markers of acute kidney injury, was significantly increased. Furthermore, the expression of Acta242,43 and Col1a144,45,46, markers of renal pEMT/fibrosis, were also increased. In addition to being a kidney pEMT/fibrosis marker, Col1a1 expression can be correlated with CKD severity47. /p>
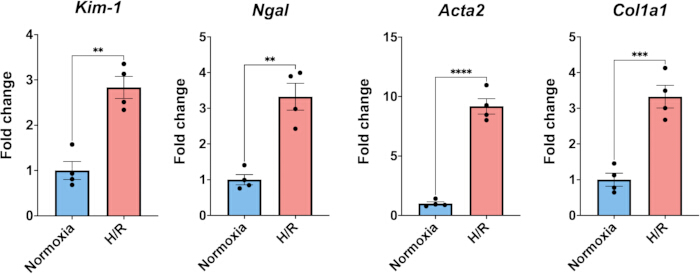
Figure 2: Molecular expression of kidney injury markers under normoxia or hypoxia/reoxygenation (H/R). After H/R, the expression of the kidney injury molecular markers Kim-1, Ngal, Acta2, and Col1a1 is significantly increased in IM-PTECs. Data are presented as mean ± standard error of the mean (SEM) from four biological replicates per condition. Statistical significance was assessed using an unpaired two-tailed Student's t-test. Significance levels are indicated as follows: p < 0.05 (*), p < 0.01 (**), p < 0.001 (***), and p < 0.0001 (****). Please click here to view a larger version of this figure.
Mitochondrial respiration studies were also performed to determine the mitochondrial respiratory capacity after H/R (Figure 3). Through the measurement of the Oxygen Consumption Rate (OCR), we determined that, after the ischemic challenge, all mitochondrial respiration parameters (basal respiration, ATP production, proton leak, maximal respiration, and spare capacity) were reduced, pointing towards hindered mitochondrial metabolism.
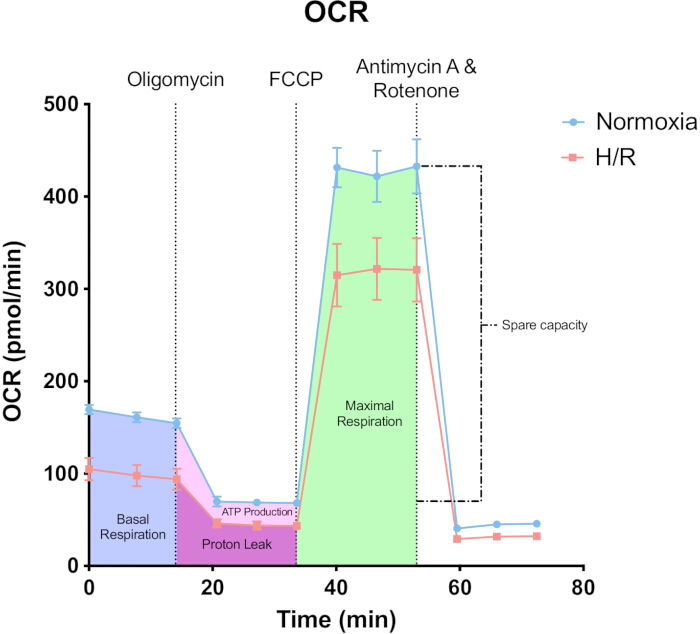
Figure 3: OCR (oxygen consumption rate) in IM-PTECs under normoxic or hypoxic conditions. Following hypoxia/reoxygenation (H/R), IM-PTECs show a reduced mitochondrial respiratory function. Mitochondrial respiration was assessed by sequentially adding electron transport chain inhibitors: oligomycin, FCCP (carbonyl cyanide-p-trifluoromethoxyphenylhydrazone), antimycin A, and rotenone. Data are presented as mean ± standard error of the mean (SEM) from four biological replicates per condition. Please click here to view a larger version of this figure.
These results confirm that the H/R protocol effectively induces molecular and metabolic alterations consistent with ischemic renal injury in IM-PTECs48,49. This protocol therefore provides a useful framework to reproduce renal ischemia-reperfusion-like conditions in vitro.
Supplementary Figure 1. Cell viability and caspase-3 activity under normoxia and hypoxia/reoxygenation (H/R) conditions. (A) Cell viability. Cell viability was assessed by MTT assay after exposure to normoxia or hypoxia/reoxygenation (H/R). Results are expressed as relative viability (%) normalized to normoxic controls. (B) Cleaved caspase-3. Cleaved caspase-3 activity (nmol/min/mg protein) was quantified in cells subjected to different durations of normoxia (N), hypoxia (H), and reperfusion (R). Data are presented as mean ± SEM, and each dot represents an individual biological replicate. Please click here to download this figure.
Discussion
Most preclinical data on renal IRI-induced AKI is generated through in vivo models50,51,52,53, due to the lack of established in vitro models. This, added to the limited availability of well-characterized murine immortalized proximal tubular epithelial cell lines, constrains in vitro research, making the development of this protocol a valuable asset. This method provides a more accessible and reproducible platform to study renal H/R injury mechanisms under controlled conditions, while also reducing the need for animal use.
Furthermore, this protocol predominantly utilizes standard laboratory equipment, facilitating its implementation without the need for specialized and expensive instruments. The only exception is the requirement for a hypoxia incubator, which is typically available in cancer research laboratories to recreate hypoxic tumor microenvironments54,55,56. This accessibility supports broader adoption and promotes reproducibility across different laboratories.
A critical consideration in this protocol is the correct culture of IM-PTECs. Cells must be cultured at 33 °C and supplemented with IFN-γ to avoid downregulation of SV40 activity. Before experimental procedures, IM-PTECs are then shifted to restrictive conditions for 7 days prior to starting the experiments. Restrictive culture is achieved by increasing the temperature to 37 °C and removing interferon-gamma (IFN-γ) from the medium for 1 week, which decreases SV40 large T antigen expression-a viral protein encoded by Simian Virus 40, used to immortalize the cells35,57-causing cells to lose their immortalized status and promoting a more differentiated and physiologically relevant phenotype58. Notably, IM-PTECs can develop prominent cytoplasmic vacuoles after several days in culture; if vacuolation occurs, hydroxycortisone should be omitted from the culture medium to prevent or reverse this change.
While the use of immortalized PTECs offers the advantage of stability and ease of maintenance, researchers may also consider using primary proximal tubular epithelial cells to increase physiological relevance. However, mouse primary PTECs present greater donor-to-donor variability59,60 and have limited proliferative capacity61,62, making them less suitable for high-throughput or long-term experiments. Their use may be more appropriate for validation studies or when studying specific patient-derived responses
This protocol provides a valuable platform to investigate the molecular mechanisms underlying H/R injury, identify and evaluate potential therapeutic approaches, and explore cellular responses such as inflammation, oxidative stress, and cell death pathways in a controlled environment63,64.
Nevertheless, an important limitation of this model is that it does not reproduce certain features of ischemia observed in kidney transplantation, such as hypothermia and nutrient deprivation during cold storage9. These conditions markedly influence cellular metabolism and injury patterns, and their absence may restrict the translation of findings to the clinical setting65,66.
In conclusion, this in vitro H/R model in IM-PTECs provides a reproducible, accessible, and ethically favorable approach to study renal ischemia-reperfusion injury under controlled conditions. While it does not fully recapitulate the complexity of in vivo ischemia, it represents a valuable complementary tool to elucidate cellular mechanisms, screen therapeutic candidates, and reduce reliance on animal experimentation in kidney research.
Disclosures
The authors declare that they have no conflicts of interest with this work to disclose
Acknowledgements
Mariano Marin-Blazquez belongs to the "Programa de Doctorado en Ciencias de la Salud" from the Catholic University of Murcia (UCAM). Work in Ruben Rabadan-Ros and Ruben Zapata-Perez group is supported by a grant from Ministerio de Ciencia, Innovación y Universidades - Proyectos de Generación de Conocimiento 2023 (PID2023-147560OA-I00). Ruben Rabadán-Ros is supported by a grant from Fundación Séneca - Agencia de Ciencia y Tecnología de la Región de Murcia (22524/JLI/24, Ayudas a Proyectos para la Generación de Nuevo Liderazgo Científico Jóvenes Líderes en Investigación 2024). R.Z.-P. is part of a European Union’s Horizon Europe research and innovation program (NADIS - 101073251). Alessandra Tammaro is financially supported by a NWO-FAPESP join grant on Healthy Ageing executed by Zonmw (no. 457002002) and a Junior Talent Grant from Nierstichting.
The authors gratefully acknowledge the Universidad de Murcia (UM) and the Universidad Católica de Murcia (UCAM) for providing access to their facilities where video footage was recorded.
Materials
| Name | Company | Catalog Number | Comments |
|---|---|---|---|
| 384-well qPCR plate | Applied Biosystems | 4309849 | |
| Centrifuge | Ortoalresa | Biocen22R | |
| Chloroform | VWR | 0757-500ML | |
| DMEM/F12 | Gibco | 21331020 | |
| Epidermal Growth Factor | Sigma-Aldrich | E9644 | |
| Ethanol | PanReac AppliChem | 141086.1214 | |
| FCS | Biowest | S181B-500 | |
| Heating block | Eppendorf | ThermoMixer C | |
| Hydrocortisone | Sigma-Aldrich | H0135 | |
| Hypoxia Incubator | Memmert | ICO 50med | |
| IFN-γ | ProspecBIo | CYT-358 | |
| Incubator | Memmert | ICO 105 | |
| Isopropanol | VWR | 0918-1L | |
| ITSe | Gibco | 41400045 | |
| L-glutamine | Gibco | 25030081 | |
| Multichannel pipette | Eppendorf | 3125000052 | |
| Non-CO2 incubator | |||
| PCR Primers | Eurofins Genomics | ||
| Penicillin - Streptomycin | Gibco | 15140-122 | |
| qPCR Master Mix | NZYTech | MB22303 | |
| Real-Time qPCR System | Applied Biosystems | QuantStudio 5 | |
| Reverse transcription Master Mix | NZYTech | MB12502 | Contains Enzyme Mix |
| RNAse-free water | HyClone | SH3053802 | |
| Seahorse XF Cell Mito Stress Test Kit | Agilent | 103015-100 | Contains Oligomycin, FCCP, Antimycin A and Rotenone |
| Seahorse XF DMEM medium | Agilent | 103575-100 | |
| Seahorse XF Glucose | Agilent | 03577-100 | |
| Seahorse XF Glutamine | Agilent | 103579-100 | |
| Seahorse XF Pyruvate | Agilent | 103578-100 | |
| Seahorse XFe96 Analyzer | Agilent | S7800BR | |
| Seahorse XFe96 FluxPak | Agilent | 103792-100 | Contains XFe96 Cell Culture Microplate and XFe96 Sensor Cartridge |
| Thermal cycler | BIO-RAD | T100 Thermal Cycler | |
| Triiodothyronine | Sigma-Aldrich | T5516 | |
| Trizol | Invitrogen | 15596026 | |
| UV-Vis spectrophotometer | DeNovix | DS-11 |
References
- Use of the data/quoting data. GODT. , Global Observatory on Donation and Transplantation. https://www.transplant-observatory.org/uses-of-dataquoting-data (2016).
- van de Laar, S. C., Lafranca, J. A., Minnee, R. C., Papalois, V., Dor, F. J. M. F. The Impact of Cold Ischaemia Time on Outcomes of Living Donor Kidney Transplantation: A Systematic Review and Meta-Analysis. J Clin Med. 11 (6), 1620(2022).
- Tingle, S. J., et al. Machine perfusion preservation versus static cold storage for deceased donor kidney transplantation. Cochrane Database Syst Rev. 3 (3), CD011671(2019).
- Jing, L., Yao, L., Zhao, M., Peng, L., Liu, M. Organ preservation: from the past to the future. Acta Pharmacol Sin. 39 (5), 845-857 (2018).
- Smith, T. B., Nicholson, M. L., Hosgood, S. A. Advances in Hypothermic and Normothermic Perfusion in Kidney Transplantation. Transplantology. 2 (4), 460-477 (2021).
- Montagud-Marrahi, E., et al. Ex vivo normothermic preservation of a kidney graft from uncontrolled donation after circulatory death over 73 hours. Front Bioeng Biotechnol. 11, 1330043(2023).
- Malek, M., Nematbakhsh, M. Renal ischemia/reperfusion injury; from pathophysiology to treatment. J Renal Inj Prev. 4 (2), 20-27 (2015).
- Ditonno, P., et al. Effects of ischemia-reperfusion injury in kidney transplantation: risk factors and early and long-term outcomes in a single center. Transplant Proc. 45 (7), 2641-2644 (2013).
- Salvadori, M., Rosso, G., Bertoni, E. Update on ischemia-reperfusion injury in kidney transplantation: Pathogenesis and treatment. World J Transplant. 5 (2), 52-67 (2015).
- Park, J., et al. Single-cell transcriptomics of the mouse kidney reveals potential cellular targets of kidney disease. Science. 360 (6390), 758-763 (2018).
- Curthoys, N. P., Moe, O. W. Proximal Tubule Function and Response to Acidosis. Clin J Am Soc Nephrol. 9 (9), 1627-1638 (2014).
- Bhargava, P., Schnellmann, R. G. Mitochondrial energetics in the kidney. Nat Rev Nephrol. 13 (10), 629-646 (2017).
- Erpicum, P., Rowart, P., Defraigne, J. O., Krzesinski, J. M., Jouret, F. What we need to know about lipid-associated injury in case of renal ischemia-reperfusion. Am J Physiol Renal Physiol. 315 (6), F1714-F1719 (2018).
- Vasko, R. Peroxisomes and Kidney Injury. Antioxid Redox Signal. 25 (4), 217-231 (2016).
- Lan, R., et al. Mitochondrial Pathology and Glycolytic Shift during Proximal Tubule Atrophy after Ischemic AKI. J Am Soc Nephrol. 27 (11), 3356-3367 (2016).
- Lipke, K., Kubis-Kubiak, A., Piwowar, A. Molecular Mechanism of Lipotoxicity as an Interesting Aspect in the Development of Pathological States-Current View of Knowledge. Cells. 11 (5), 844(2022).
- Jang, H. S., Noh, M. R., Kim, J., Padanilam, B. J. Defective Mitochondrial Fatty Acid Oxidation and Lipotoxicity in Kidney Diseases. Front. Med. 7, 65(2020).
- Rinaldi, A., et al. Impaired fatty acid metabolism perpetuates lipotoxicity along the transition to chronic kidney injury. JCI Insight. 7 (18), e161783(2022).
- Kang, H. M., et al. Defective fatty acid oxidation in renal tubular epithelial cells has a key role in kidney fibrosis development. Nat Med. 21 (1), 37-46 (2015).
- Chen, Y., et al. Mitochondrial metabolism and targeted treatment strategies in ischemic-induced acute kidney injury. Cell Death Discov. 10 (1), 69(2024).
- Bhatia, D., Capili, A., Choi, M. E. Mitochondrial dysfunction in kidney injury, inflammation, and disease: potential therapeutic approaches. Kidney Res Clin Pract. 39 (3), 244-258 (2020).
- Zhao, L., et al. Energy metabolic reprogramming regulates programmed cell death of renal tubular epithelial cells and might serve as a new therapeutic target for acute kidney injury. Front Cell Dev Biol. 11, 1276217(2023).
- Fontecha-Barriuso, M., et al. Tubular Mitochondrial Dysfunction, Oxidative Stress, and Progression of Chronic Kidney Disease. Antioxidants. 11 (7), 1356(2022).
- Wang, H., Zhang, S., Guo, J. Lipotoxic Proximal Tubular Injury: A Primary Event in Diabetic Kidney Disease. Front Med (Lausanne). 8, 751529(2021).
- Bhosale, S. J., Kulkarni, A. P. Biomarkers in Acute Kidney Injury. Indian J Crit Care Med. 24 (Suppl 3), S90-S93 (2020).
- van der Rijt, S., Leemans, J. C., Florquin, S., Houtkooper, R. H., Tammaro, A. Immunometabolic rewiring of tubular epithelial cells in kidney disease. Nat Rev Nephrol. 18 (9), 588-603 (2022).
- Liu, Y. Cellular and molecular mechanisms of renal fibrosis. Nat Rev Nephrol. 7 (12), 684-696 (2011).
- Lovisa, S., et al. Epithelial-to-mesenchymal transition induces cell cycle arrest and parenchymal damage in renal fibrosis. Nat Med. 21 (9), 998-1009 (2015).
- Luo, C., et al. Wnt9a Promotes Renal Fibrosis by Accelerating Cellular Senescence in Tubular Epithelial Cells. J Am Soc Nephrol. 29 (4), 1238-1256 (2018).
- Mylonas, K. J., et al. Cellular senescence inhibits renal regeneration after injury in mice, with senolytic treatment promoting repair. Sci Transl Med. 13 (594), eabb0203(2021).
- Mimura, I., Nangaku, M. The suffocating kidney: tubulointerstitial hypoxia in end-stage renal disease. Nat Rev Nephrol. 6 (11), 667-678 (2010).
- Fine, L. G., Norman, J. T. Chronic hypoxia as a mechanism of progression of chronic kidney diseases: from hypothesis to novel therapeutics. Kidney International. 74 (7), 867-872 (2008).
- Lerink, L. J. S., et al. Preclinical models versus clinical renal ischemia reperfusion injury: A systematic review based on metabolic signatures. American Journal of Transplantation. 22 (2), 344-370 (2022).
- Harwood, R., et al. Murine models of renal ischemia reperfusion injury: An opportunity for refinement using noninvasive monitoring methods. Physiol Rep. 10 (5), e15211(2022).
- Leemans, J. C., et al. Renal-associated TLR2 mediates ischemia/reperfusion injury in the kidney. J Clin Invest. 115 (10), 2894-2903 (2005).
- Havasi, A., Borkan, S. C. Apoptosis and acute kidney injury. Kidney Int. 80 (1), 29-40 (2011).
- Wang, X., Wang, W., Wang, J. Z., Yang, C., Liang, C. -Z. Effect of apigenin on apoptosis induced by renal ischemia/reperfusion injury in vivo and in vitro. Ren Fail. 40 (1), 498-505 (2018).
- Bonventre, J. V. Kidney injury molecule-1: a translational journey. Trans Am Clin Climatol Assoc. 125, discussion 299 293-299 (2014).
- Ichimura, T., et al. Kidney injury molecule-1 (KIM-1), a putative epithelial cell adhesion molecule containing a novel immunoglobulin domain, is up-regulated in renal cells after injury. J Biol Chem. 273 (7), 4135-4142 (1998).
- Clerico, A., Galli, C., Fortunato, A., Ronco, C. Neutrophil gelatinase-associated lipocalin (NGAL) as biomarker of acute kidney injury: a review of the laboratory characteristics and clinical evidences. Clin Chem Lab Med. 50 (9), 1505-1517 (2012).
- Xu, C., Lin, S., Mao, L., Li, Z. Neutrophil gelatinase-associated lipocalin as predictor of acute kidney injury requiring renal replacement therapy: A systematic review and meta-analysis. Front Med (Lausanne). 9, 859318(2022).
- Huang, R., Fu, P., Ma, L. Kidney fibrosis: from mechanisms to therapeutic medicines. Sig Transduct Target Ther. 8 (1), 1-20 (2023).
- Schreibing, F., Anslinger, T. M., Kramann, R. Fibrosis in Pathology of Heart and Kidney: From Deep RNA-Sequencing to Novel Molecular Targets. Circ Res. 132 (8), 1013-1033 (2023).
- Wang, Q., et al. CircCSPP1 Functions as a ceRNA to Promote Colorectal Carcinoma Cell EMT and Liver Metastasis by Upregulating COL1A1. Front Oncol. 10, 850(2020).
- Zhu, X., Luo, X., Jiang, S., Wang, H. Bone Morphogenetic Protein 1 Targeting COL1A1 and COL1A2 to Regulate the Epithelial-Mesenchymal Transition Process of Colon Cancer SW620 Cells. J Nanosci Nanotechnol. 20 (3), 1366-1374 (2020).
- Salimian, N., Peymani, M., Ghaedi, K., Hashemi, M., Rahimi, E. Collagen 1A1 (COL1A1) and Collagen11A1(COL11A1) as diagnostic biomarkers in Breast, colorectal and gastric cancers. Gene. 892, 147867(2024).
- Mavrogeorgis, E., et al. Collagen-Derived Peptides in CKD: A Link to Fibrosis. Toxins. 14 (1), 10(2022).
- Kurian, G. A., Pemaih, B. Standardization of in vitro Cell-based Model for Renal Ischemia and Reperfusion Injury. Indian J Pharm Sci. 76 (4), 348-353 (2014).
- Strazdauskas, A., et al. In Vitro Hypoxia/Reoxygenation Induces Mitochondrial Cardiolipin Remodeling in Human Kidney Cells. Int J Mol Sci. 25 (11), 6223(2024).
- Wang, H. J., Varner, A., AbouShwareb, T., Atala, A., Yoo, J. J. Ischemia/reperfusion-induced renal failure in rats as a model for evaluating cell therapies. Ren Fail. 34 (10), 1324-1332 (2012).
- Greite, R., et al. Renal ischemia-reperfusion injury causes hypertension and renal perfusion impairment in the CD1 mice which promotes progressive renal fibrosis. Am J Physiol Renal Physiol. 314 (5), F881-F892 (2018).
- Skrypnyk, N. I., Harris, R. C., de Caestecker, M. P. Ischemia-reperfusion Model of Acute Kidney Injury and Post Injury Fibrosis in Mice. J Vis Exp. (78), e50495(2013).
- Le Clef, N., Verhulst, A., D'Haese, P. C., Vervaet, B. A. Unilateral Renal Ischemia-Reperfusion as a Robust Model for Acute to Chronic Kidney Injury in Mice. PLoS One. 11 (3), e0152153(2016).
- Ma, R., He, X., Wang, H., Jia, W., Zeng, X. Hypoxic microenvironment promotes proliferation and invasion of non-small cell lung cancer A549 Cells through Wnt/β-catenin signaling pathway. Biomed Res. 29 (2), 268-273 (2018).
- Metsälä, O., et al. Transportable system enabling multiple irradiation studies under simultaneous hypoxia in vitro. Radiat Oncol. 13, 220(2018).
- Nushtaeva, A. A., et al. Establishment of primary human breast cancer cell lines using "pulsed hypoxia" method and development of metastatic tumor model in immunodeficient mice. Cancer Cell Int. 19 (1), 46(2019).
- Stokman, G., et al. Stem Cell Factor Expression after Renal Ischemia Promotes Tubular Epithelial Survival. PLoS One. 5 (12), e14386(2010).
- Stokman, G., et al. Epac-Rap signaling reduces cellular stress and ischemia-induced kidney failure. J Am Soc Nephrol. 22 (5), 859-872 (2011).
- Bejoy, J., Qian, E. S., Woodard, L. E. Tissue Culture Models of AKI: From Tubule Cells to Human Kidney Organoids. J Am Soc Nephrol. 33 (3), 487-501 (2022).
- Li, Y., et al. An in vitro method for the prediction of renal proximal tubular toxicity in humans. Toxicol Res. 2 (5), 352-365 (2013).
- Wilmer, M. J., et al. Novel conditionally immortalized human proximal tubule cell line expressing functional influx and efflux transporters. Cell Tissue Res. 339 (2), 449-457 (2010).
- Terryn, S., et al. A primary culture of mouse proximal tubular cells, established on collagen-coated membranes. Am J Physiol Renal Physiol. 293 (2), F476-F485 (2007).
- Zapata-Pérez, R., et al. Reduced nicotinamide mononucleotide is a new and potent NAD+ precursor in mammalian cells and mice. FASEB J. 35 (4), e21456(2021).
- Tammaro, A., et al. HDAC1/2 inhibitor therapy improves multiple organ systems in aged mice. iScience. 27 (1), 108681(2024).
- Verstraeten, L., Den abt, R., Ghesquière, B., Jochmans, I. Current Insights into the Metabolome during Hypothermic Kidney Perfusion-A Scoping Review. J Clin Med. 12 (11), 3613(2023).
- Turkmen, K., et al. Apoptosis and Autophagy in Cold Preservation Ischemia. Transplantation. 91 (11), 1192(2011).
Reprints and Permissions
