This protocol presents a light-induced method for fabricating slippery three-dimensional structures via sequential digital patterning and grafting on silane-coated nanoporous surfaces. This approach enables the spatially controlled formation of slippery regions, enabling patterned liquid repellency and the quantitative analysis of interfacial slipperiness, with applications in fluid manipulation and surface engineering.
Method Article
Light-induced Patterning and Grafting for Slippery Surfaces based on Silane-coated Nanoporous Structures
* These authors contributed equally
In This Article
Summary
Abstract
This protocol describes a light-induced method for fabricating spatially patterned slippery surfaces via digital light processing (DLP) and polymerization-induced phase separation. A photocurable polyurethane acrylate (PUA) resin is mixed with a water-soluble porogen (PEG-200) and selectively exposed to ultraviolet (UV) light using a DLP projection system. This process simultaneously induces polymer crosslinking and porogen phase separation. After porogen removal, a nanoporous structure remains, which is chemically modified via UV-ozone activation and vapor-phase silanization to enhance hydrophobicity. Silicone oil is then infused and covalently grafted onto the surface using multi-wavelength UV light, forming a stable polydimethylsiloxane (PDMS) brush layer. The resulting surface exhibits strong liquid repellency, low contact angle hysteresis, and high optical transparency. Wettability is quantitatively evaluated using contact angle and hysteresis measurements with water, octane, honey, and artificial human saliva. This method enables selective slipperiness, demonstrated by directing water-based droplets away from slippery domains toward untreated hydrophilic regions, forming well-defined liquid patterns. The approach supports high-resolution, maskless fabrication on flexible substrates and scalable patterning for applications in microfluidics, droplet transport, water harvesting, and biomedical devices.
Introduction
Slippery liquid-infused porous surfaces (SLIPS)1 are bioinspired interfaces that repel a wide range of liquids by locking lubricating fluids within micro- or nanostructured solid frameworks2,3. Unlike lotus-inspired superhydrophobic surfaces4, SLIPS use a stabilized liquid-liquid interface, allowing droplets to move with minimal friction. They exhibit omniphobicity, low contact angle hysteresis, and self-healing3,5 behavior driven by capillary-induced lubricant redistribution6. These properties make SLIPS attractive for applications in microfluidics7, antifouling6,8, anti-icing9,10,11, water harvesting12,13,14, and self-cleaning surfaces15.
However, extending SLIPS to geometrically complex or spatially patterned surfaces remains challenging. Conventional fabrication techniques for porous scaffolds-such as photolithography16,17, anodizing18, gelation6,19, and electrospinning20-are time-consuming and require multiple processing steps. Fused deposition modeling (FDM)21,22, a standard 3D printing approach, has also been used to create SLIPS by printing porous polymers and infusing them with lubricants. While more accessible, FDM has slow, point-by-point deposition and limited resolution, making it challenging to fabricate fine surface features or large-area patterns efficiently. Moreover, SLIPS produced by these techniques are typically uniformly slippery, which limits their utility in applications that require selective liquid control.
To address these limitations, a light-induced method is introduced for fabricating patterned slippery surfaces using digital light processing (DLP)23. DLP enables the fast, high-resolution projection of designed images onto photocurable materials. By combining DLP with polymerization-induced phase separation, nanoporous microstructures are formed with lubricant-retaining capacity. A photocurable polyurethane acrylate (PUA) resin is mixed with a water-soluble porogen and exposed to patterned ultraviolet (UV) light, inducing crosslinking and porogen phase separation. Subsequent washing removes the porogen, leaving a porous matrix.
The surface is subsequently silanized with octadecyltrichlorosilane (OTS) to enhance hydrophobicity24 and infused with silicone oil. Brief UV exposure induces the covalent grafting of a polydimethylsiloxane (PDMS) brush layer6,19,25 onto the substrate, chemically anchoring the lubricant and improving long-term interfacial stability. The characteristics of the fabricated surfaces-including static contact angle, contact angle hysteresis, sliding angle, sliding speed, and optical transmittance-are quantitatively evaluated. Moreover, a liquid patterning test demonstrates selective slipperiness by guiding water droplets to untreated regions. In this work, a light-induced patterned SLIPS fabrication via DLP is introduced, which enables the spatial control of slippery domains without requiring complex photolithography, anodizing, or gelation. By chemically bonding the lubricant via photoinduced grafting onto designed nanoporous surfaces, the proposed method produces high-resolution, stable slippery surfaces suitable for selective droplet manipulation in microfluidics13, water harvesting systems12,13,14, and biomedical devices26,27.
Protocol
NOTE: A schematic overview of this process appears in Figure 1. The materials and equipment used in this study are listed in the Table of Materials.
1. Nanoporous surface
- Mix the photocurable PUA resin with polyethylene glycol-200 (PEG-200) as the porogen at a weight ratio of 50 wt%. Stir the mixture at 500 rpm for 5 min using a magnetic stirrer.
- Dispense the mixed solution onto a polyethylene terephthalate (PET) film as sessile droplets. Cover the droplets with a fluorinated ethylene propylene (FEP) film, and apply uniform pressure with a roll-to-plate system28 to ensure even spreading.
- Expose the PUA resin to UV light (365 nm) at an energy dose of 180 mJ/cm2 with an LED UV-curing system to induce polymerization. After curing, remove the FEP films.
- Immerse the cured specimen in deionized (DI) water for 1 h to extract unreacted PEG-200. Dry the porous sample in a 70 °C oven for 1 h to remove residual water and finalize the fabrication of the nanoporous surface (Figure 2).
NOTE: After drying, a whitish and matte appearance indicates that PEG-200 has been completely removed and nanopores exist.
2. OTS-treated surface
- Perform UV ozone treatment at 185 and 254 nm wavelengths with a UV intensity of 25 mW/cm2 for 20 min to introduce hydroxyl groups onto the surface as a pretreatment for OTS self-assembled monolayer (SAM) formation. Conduct this process under standard laboratory ambient conditions at room temperature and atmospheric pressure.
CAUTION: UV ozone treatment generates ozone (O3) and reactive oxygen species (ROS) upon exposure to 185 nm and 254 nm UV light. These byproducts are harmful to human health and can irritate the respiratory system. Ensure the UV ozone system is connected to a functional exhaust or fume extraction system .
Prolonged UV ozone exposure beyond 20 min may damage the polymer surface and cause structural deformation. - Place a hot plate inside a nitrogen-filled glovebox. Position a clean beaker on the hot plate and dispense 1 mL of OTS solution onto the bottom of the beaker as a sessile droplet.
CAUTION: Octadecyltrichlorosilane is highly reactive with moisture and generates corrosive hydrogen chloride (HCl) gas upon hydrolysis. It can irritate the skin, eyes, and respiratory system. Handle OTS only in a nitrogen-filled glovebox, and wear appropriate personal protective equipment (PPE), including gloves, safety goggles, and a lab coat. - Secure the PET film specimens onto glass slides. Invert the slides and place them face down over the beaker to conduct vapor-phase deposition of OTS. Heat the setup to 120 °C for 40 min.
NOTE: Overcoating of OTS due to excessive heating or prolonged exposure may cause surface defects. - Remove the specimens from the glovebox and clean the beaker using a lint-free wipe.
NOTE: If the beaker is not cleaned properly, residual OTS may solidify and appear white, affecting repeat processing conditions.
3. Light-induced grafting
- Perform UV ozone treatment at 185 and 254 nm wavelengths with a UV intensity of 25 mW/cm2 for 20 min on the OTS-coated surface to introduce hydroxyl groups as a pretreatment step for covalent grafting of the PDMS brush layer. This process is conducted under standard laboratory ambient conditions at room temperature and atmospheric pressure.
NOTE: This step is critical. Without hydroxyl activation, the PDMS brush layer fails to form, and a slippery interface will not develop. - Apply 20 µL/cm2 of 10 cS silicone oil to the surface by sessile droplet deposition to ensure uniform coating.
- Irradiate the specimen for 15 min with a high-intensity UV lamp positioned 15 cm above the surface. Use a multi-wavelength source featuring prominent peaks at 207 nm (149 mW/cm2), 214 nm (155 mW/cm2), 296 nm (125 mW/cm2), 317 nm (93 mW/cm2), and 321 nm (89 mW/cm2). The irradiation produces heat, and the substrate reaches 103.3 ± 5.2 °C, facilitating covalent brush formation.
CAUTION: During high-intensity UV irradiation, silicone oil may reach elevated temperatures (>100 °C). Although silicone oil itself has low acute toxicity, inhalation of oil mist can cause respiratory irritation. At elevated temperatures, its volatility increases, and prolonged exposure in poorly ventilated or enclosed spaces can pose health risks.Wear UV-blocking goggles and ensure adequate exhaust ventilation to vent ozone. Keep flammable or volatile materials away from the setup to prevent fire hazards from heat and UV exposure. - Tilt the specimen at a 30° angle and maintain for 5 min to allow excess silicone oil to drain off the surface.
NOTE: Successful drainage is confirmed when the surface displays a thin, uniform film of silicone oil without pooling or large visible droplets.
4. Fabrication of patterned slippery structures
- Design the desired shapes with CAD software (e.g., CATIA) and export them as STL files (gear, maze, and JoVE text; Supplemental File 1, Supplemental File 2, Supplemental File 3, and Supplemental File 4). Load the STL files into slicing software (e.g., Carima Slicer) to generate 2D projection images compatible with the DLP 3D printer. Send the resulting files to the printer for digital light projection.
- Place the polymer solution-coated film (from step 1.2) on the window of the DLP printer. Expose the sample to 365 nm UV light at an intensity of 180 mJ/cm2 with the projected digital pattern to selectively cure the resin.
- Submerge the exposed sample in DI water for 1 h to extract PEG-200. Dry the sample in a 70 °C oven for 1 h to remove residual water and produce the nanoporous structure. Conduct OTS surface treatment and light-induced grafting to complete the fabrication of patterned slippery surfaces.
Results
The nanoporous surfaces fabricated via polymerization-induced phase separation exhibited a dominant pore size distribution of 60-100 nm, as shown in Figure 2. This distribution was confirmed by three replicate measurements using high-resolution SEM imaging. The SEM images were processed via pixel-based image analysis in MATLAB to determine pore diameters, assuming a circular cross-section.
The static water contact angle measured on the porous surface was 84.4 ± 1.4°, based on five replicate tests with 5 µL sessile water droplets (Figure 3A). To evaluate the changes in surface wettability, the contact angle was monitored across the surface-modification steps-including nanoporous structure formation, UV-ozone activation, silanization, and light-induced PDMS grafting. After silanization, the surface became hydrophobic; however, a second UV-ozone treatment, performed prior to PDMS grafting, temporarily reduced the contact angle because hydroxyl groups were introduced. This reduction was reversed by the formation of a covalently bonded PDMS brush layer, restoring the hydrophobicity of the surface29. Unlike free silicone oil coatings, which can readily deplete, the tethered PDMS brush provides a stable and flexible molecular layer that retains lubricant and enables long-term slippery behavior11. If the grafting process is not completed, droplets remain pinned on the surface and fail to slide, indicating that the grafting step is essential to achieving slippery behavior.
To validate the slippery behavior of four representative liquids (Figure 3B)-deionized water, octane (low surface tension), honey (high viscosity), and artificial human saliva (a biofluid mimic; commercial synthetic solution)-their contact angle (Figure 3C), sliding angle (Figure 3D), sliding speed (Figure 3E), and contact angle hysteresis (CAH) (Figure 3F) were measured. For each liquid, a 5 µL sessile droplet was used to measure the contact and sliding angles (tilting rate: 0.8°/s), and another 5 µL droplet was placed on a 30° tilted surface to measure the sliding speed over an 8.5 mm distance. CAH was quantified in each case. All slippery behavior tests were performed in quintuplicate. In every experiment, the sliding angles remained below 3°. The sliding speed of honey was markedly lower because its high viscosity causes greater internal viscous dissipation, which strongly resists droplet motion under the same driving force. Additionally, CAH remained below 10° (Figure 3F), indicating a robust, omniphobic slippery interface.
Before implementing the slippery patterning protocol with DLP projection, the printing resolution of the PEG-PUA resin was evaluated using line-and-space test patterns (Figure 4). Given the native pixel resolution of the DMD chip (50 µm x 50 µm), the minimum line width was set at 50 µm, with incremental increases up to 300 µm. Each line width was fabricated and analyzed five times. The 50 µm features exhibited high fidelity to the designed geometry (50.3 ± 6.3 µm). However, dimensional deviations increased slightly with wider features, likely due to light scattering and lateral diffusion during exposure of broader areas, leading to overcuring beyond the intended pattern boundaries. These overcuring effects are commonly observed in photopolymer resins that are not purpose-engineered for additive manufacturing. In this study, the PEG-PUA resin was initially developed for photopatterning and was not optimized for 3D printing, which likely contributed to this behavior. Nonetheless, such limitations may be mitigated by optimizing the resin composition and photopolymerization characteristics.
Patterned nanoporous surfaces featuring letter-shaped (JoVE) and graphical (maze, gear) designs were successfully fabricated with the DLP process (Figure 5A). After completing all surface modification steps-including silanization, UV-ozone activation, PDMS grafting, and silicone oil infusion-the patterns became optically transparent (Figure 5B). This transition results from the refractive index mismatch between air (na = 1.0) and the polymer matrix (np = 1.5), which causes scattering in the unfilled porous structures. After infiltration with silicone oil (ns = 1.4), the refractive index contrast was reduced, yielding a visibly transparent surface with transmittance exceeding 90% (Figure 5C). When water-containing ink was applied, the droplets selectively migrated toward untreated hydrophilic regions (e.g., the PET film), avoiding the slippery domains (Figure 5D), thereby forming well-defined liquid patterns (Figure 5E). These results demonstrate that the protocol enables the effective spatial control of surface wettability.
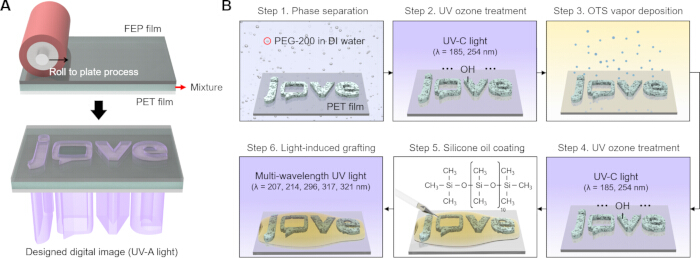
Figure 1: Schematic of the fabrication process for a digitally patterned slippery surface built on a silane-coated nanoporous structure. (A) Roll-to-plate process for uniformly coating PEG-PUA resin between a PET film and an FEP film, followed by light-induced patterning with a DLP projection system. (B) Fabrication sequence of the slippery surface: (step 1) formation of a nanoporous surface by phase separation; (step 2) UV ozone treatment to generate hydroxyl groups on the nanoporous surface; (step 3) OTS vapor deposition to form a hydrophobic SAM; (step 4) second UV ozone treatment to introduce hydroxyl groups on the SAM surface; (step 5) silicone oil infiltration; (step 6) light-induced surface grafting to form a PDMS brush layer. Abbreviations: PEG-PUA = Polyethylene glycol-Polyurethane acrylate; PET = Polyethylene terephthalate; FEP = Fluorinated ethylene propylene; DLP = Digital light processing; OTS = Octadecyltrichlorosilane; SAM = Self-assembled monolayer; PDMS = Polydimethylsiloxane. Please click here to view a larger version of this figure.
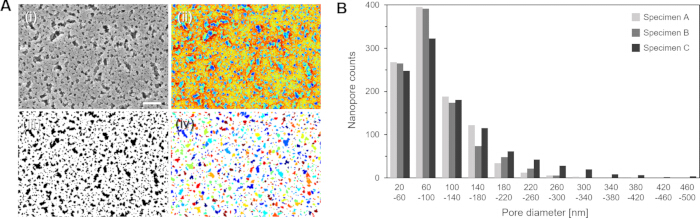
Figure 2: Fabricated nanoporous surface. (A) SEM image and image processing steps for nanopore size analysis: (i) original SEM image; (ii) depth map showing relative pore depth with a pseudocolor scale derived from brightness; (iii) binarized image for pore region segmentation; (iv) pore labeling, where each pore is assigned a distinct color. Scale bar = 500 nm. (B) Size distribution of the nanopores. Please click here to view a larger version of this figure.
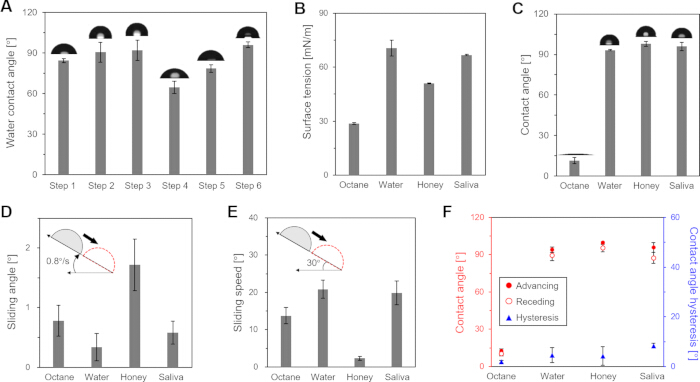
Figure 3: Surface wettability analysis. (A) Water contact angle measurements (5 µL) after each fabrication step: porous surface (step 1), UV ozone-treated surface (step 2), OTS-coated surface (step 3), UV-ozone-treated SAM (step 4), silicone oil-coated surface (step 5), and light-grafted surface (step 6). (B) Surface tension of various liquids: octane (28.7 ± 0.5 mN/m), water (70.6 ± 4.4 mN/m), honey (51.0 ± 0.2 mN/m), artificial human saliva (66.7 ± 0.4 mN/m) (C) Static contact angle, (D) Sliding angle (5 µL), (E) Sliding speed (5 µL), and (F) Contact angle hysteresis (CAH) measured for the droplets of these liquids. All experiments were performed at room temperature and a relative humidity of 40 ± 5%. Bars and points represent mean values, and error bars indicate mean ± SD (n = 5 independent experiments). Please click here to view a larger version of this figure.
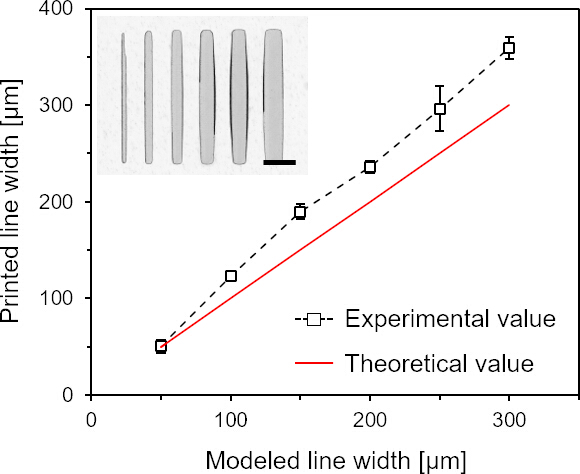
Figure 4: Microline structures printed for resolution testing of the DLP system, with linewidths measured at the midpoint of each line (five repetitions). Scale bar = 500 µm. Points represent mean values, and error bars indicate mean ± SD (n = 5 independent experiments). Please click here to view a larger version of this figure.
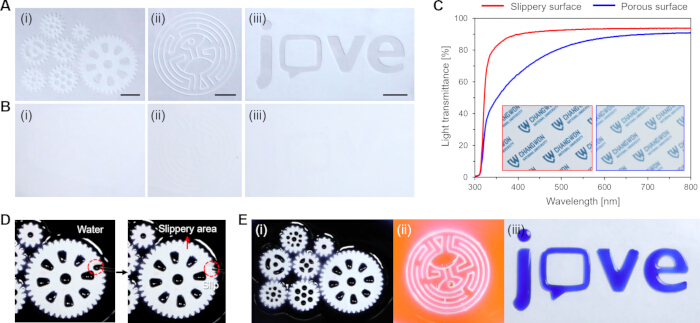
Figure 5: Patterned surfaces fabricated from digitally designed images via DLP projection. (A) Nanoporous surfaces before silicone oil infiltration, showing opacity. Patterns: (i) gear, (ii) maze, (iii) JoVE text. Scale bar: 10 mm. (B) Slippery surfaces after silicone oil infiltration, appearing transparent. Patterns: (i) gear, (ii) maze, (iii) JoVE text. (C) Optical transmittance comparison between the slippery and porous surfaces. (D) Selective removal of water droplets steered to designated hydrophilic regions (PET film) on the slippery surface. (E) Liquid-guided patterning with water droplets on the slippery surface. Patterns: (i) gear, (ii) maze, (iii) JoVE text. Please click here to view a larger version of this figure.
Discussion
A critical step in this protocol is the formation of a nanoporous structure via polymerization-induced phase separation during DLP-based UV curing. Blending PEG-200 with a photocurable PUA resin and subsequently irradiating the mixture with patterned UV light yields cross-linked porous networks and spatially defined structures that effectively retain lubricants1. To enable the subsequent grafting of a PDMS brush layer11-forming the foundation of a stable slippery interface-UV-ozone treatment was performed twice during the process: first, to introduce hydroxyl groups onto the porous polymer surface prior to silanization, and second, to reactivate the silanized surface before PDMS grafting.
Caution is required during both UV-ozone steps, as exposure to high-energy conditions-such as short-wavelength UV light and elevated temperatures-may damage the polymer substrate or deform the surface structure25. Following the second UV-ozone step, silicone oil was deposited on the activated surface. Subsequent multi-wavelength UV exposure initiates the grafting of PDMS chains. While the reaction is primarily driven by UV light, the accompanying thermal energy supports molecular interactions and promotes robust surface bonding. This grafting process leads to the formation of a covalently anchored PDMS brush layer, resulting in stable slippery interfaces characterized by low sliding angles, low CAH, and fast sliding speed. However, insufficient hydroxylation during either UV-ozone step can result in poor grafting and reduced slippery performance. Additionally, if the UV intensity used during the curing step for fabricating the nanoporous surface falls below the recommended value, the surface tends to become excessively rough and the pore size highly irregular, and the nanoporous layer may even delaminate from the PET substrate during rinsing23. Moreover, although nanoporous surfaces can be fabricated by increasing the PEG-200 content above 50 wt%, the resulting structures often exhibit enlarged pores and increased surface roughness, which can hinder slippery behavior as droplets become pinned within the large pores. Therefore, the fabrication parameters should be carefully maintained within the prescribed ranges.
A limitation of this protocol concerns the fabrication of large or fully 3D (millimeter-scale) slippery structures using transparent resin formulations in additive manufacturing. Because of the high optical transmittance of the PEG-PUA resin, UV light may penetrate beyond the intended exposure layer and initiate curing in recessed or concave regions. This may cause unintended solidification and a loss of structural fidelity, particularly within internal cavities. Thus, extending this method to volumetric slippery 3D architectures remains challenging without further tuning of the optical absorbance properties of the resin23.
Despite this limitation, the protocol offers clear advantages over conventional SLIPS fabrication methods. Unlike FDM-based approaches22, which are limited by low resolution and slow, point-by-point deposition, or anodization and gelation techniques20, which require multistep procedures and rigid templates, the proposed DLP-based method enables the direct fabrication of lubricant-infused porous substrates through a single-step, maskless, and digitally programmable projection process. This approach not only reduces fabrication time but also simplifies the procedure and substantially increases patterning throughput, enabling the efficient production of patterned surfaces. Moreover, the process is compatible with flexible substrates such as PET films. Additionally, the light-induced phase separation strategy provides high resolution, patterning flexibility, and simplified formation of porous scaffolds capable of retaining lubricants. The use of photoinduced processes also facilitates integration with patterned substrates, allows selective slipperiness, and supports the scalable fabrication of multiscale structures. Taken together, these advantages make the method particularly well-suited for applications such as directional droplet transport, open-channel microfluidics, antifouling coatings8, and water harvesting systems13,14, where precise spatial control of surface wettability is essential.
Disclosures
The authors have no conflicts of interest to declare.
Acknowledgements
This work received support from National Research Foundation of Korea (NRF) grants funded by the Korean government (MSIT) (No. 2023R1A2C3006499 and RS-2023-00238462). This research was also supported by the LAMP (Global Learning & Academic Research Institution for Master's and PhD Students and Postdocs) initiative of the National Research Foundation of Korea (NRF) grant funded by the Ministry of Education (No. RS-2024-00444460).
Materials
| Name | Company | Catalog Number | Comments |
|---|---|---|---|
| 365 nm UV LED system | Lichtzen | LZL-FL-220220-C | UV curing equipment |
| Artificial Saliva | TMABIO | TB0924 | Artificial human saliva (a biofluid mimic; commercial synthetic solution) |
| Carima Slicer | CARIMA | V2.0 | Slicing software |
| CATIA | Dassault systems | V5R20 | CAD software |
| Deionized (DI) water | KOREA CLEANUP CHEM | KCU-PW3 | Rinsing and porogen removal |
| DLP 3D printer (365 nm UV) | CARIMA | IMD-C | Digital patterning equipment |
| Fluorinated ethylene propylene (FEP) film | ALPHAFLON | FEP0250 | Release film |
| Glove box | MADE LAB | G801 | Used for handling hazardous materials safely |
| Hot-plate stirrer | Corning | PC-420D | Hot plate & magnetic stirrer equipment (5" x 7") |
| Multi-wavelength UV lamp system | Raynics | RX-H1000S | Light-induced grafting equipment |
| Octadecyltrichlorosilane (OTS) | Sigma-Aldrich | 104817 | Hydrophobic surface coating |
| Oven | SH Scientific | SH-VDO-30NH | Used for drying samples |
| Photo-curable resin | Minuta technology | MINS-311RM | Polyurethane acrylate (PUA) based resin |
| Polyethylene glycol (PEG) 200 | Tokyo Chemical Industry | P0840 | Porogen |
| Polyethylene terephthalate (PET) film | Blue DP | Substrate for imprinting | |
| Silicone oil | Shin-Etsu Polymer | KF-96-10CS | 10cS |
| SmartDrop | Femtobiomed | Contact angle measurement | |
| UV ozone cleaner | Jaesung Engineering | UVC-30 | UV ozone treatment equipment |
| UV-visible/NIR spectrophotometer | Jasco | V-770 | Light transmittance measurement |
References
- Wong, T. S., et al. Bioinspired self-repairing slippery surfaces with pressure-stable omniphobicity. Nature. 477 (7365), 443-447 (2011).
- Yao, X., et al. Adaptive fluid-infused porous films with tunable transparency and wettability. Nat Mater. 12 (6), 529-534 (2013).
- Kreder, M. J., Alvarenga, J., Kim, P., Aizenberg, J. Design of anti-icing surfaces: smooth, textured or slippery. Nat Rev Mater. 1 (1), 1-15 (2016).
- Latthe, S. S., Terashima, C., Nakata, K., Fujishima, A. Superhydrophobic surfaces developed by mimicking hierarchical surface morphology of lotus leaf. Molecules. 19 (4), 4256-4283 (2014).
- Xiang, T., et al. Slippery liquid-infused porous surface for corrosion protection with self-healing property. Chem Eng J. 345, 147-155 (2018).
- Lee, S. H., et al. Implementation of a large-area slippery surface using a transparent organogel. Mater Today Chem. 39, 102187(2024).
- Wang, X., Zhuang, Z., Li, X., Yao, X. Droplet manipulation on bioinspired slippery surfaces: from design principle to biomedical applications. Small Methods. 8 (4), 2300253(2024).
- Tesler, A. B., et al. Extremely durable biofouling-resistant metallic surfaces based on electrodeposited nanoporous tungstite films on steel. Nat Commun. 6 (1), 8649(2015).
- Yuan, Y., et al. Self-repairing performance of slippery liquid infused porous surfaces for durable anti-icing. Adv Mater Interfaces. 9 (10), 2101968(2022).
- Eder, T., et al. Transparent PDMS surfaces with covalently attached lubricants for enhanced anti-adhesion performance. ACS Appl Mater Interfaces. 16 (8), 10942-10952 (2024).
- Zhao, X., et al. Macroscopic evidence of the liquidlike nature of nanoscale polydimethylsiloxane brushes. ACS Nano. 15 (8), 13559-13567 (2021).
- Dai, X., et al. Hydrophilic directional slippery rough surfaces for water harvesting. Sci Adv. 4 (3), eaaq0919(2018).
- Lv, P., Zhang, Y. L., Han, D. D., Sun, H. B. Directional droplet transport on functional surfaces with superwettabilities. Adv Mater Interfaces. 8 (12), 2100043(2021).
- Lian, Z., et al. Recent progress in bio-inspired macrostructure array materials with special wettability-from surface engineering to functional applications. Int J Extreme Manuf. 6 (1), 012008(2023).
- Yin, J., et al. Self-cleaning and antibiofouling enamel surface by slippery liquid-infused technique. Sci Rep. 6 (1), 25924(2016).
- Ucuncuoglu, R., Erbil, H. Y. Water drop evaporation on slippery liquid-infused porous surfaces (SLIPS): effect of lubricant thickness, viscosity, ridge height, and pattern geometry. Langmuir. 39 (18), 6514-6528 (2023).
- Zhang, P., Zhang, L., Chen, H., Dong, Z., Zhang, D. Surfaces inspired by the Nepenthes peristome for unidirectional liquid transport. Adv Mater. 29 (45), 1702995(2017).
- Song, T., et al. Fabrication of super slippery sheet-layered and porous anodic aluminium oxide surfaces and its anticorrosion property. Appl Surf Sci. 355, 495-501 (2015).
- Yoon, S. M., et al. Photo-induced liquid-based slippery materials for highly efficient particle aggregation. Appl Surf Sci. 682, 161638(2025).
- Mahmut, T. A. S., Memon, H., Xu, F., Ahmed, I., Hou, X. Electrospun nanofibre membrane based transparent slippery liquid-infused porous surfaces with icephobic properties. Colloids Surf A Physicochem Eng Asp. 585, 124177(2020).
- Mazzanti, V., Malagutti, L., Mollica, F. FDM 3D printing of polymers containing natural fillers: a review of their mechanical properties. Polymers. 11 (7), 1094(2019).
- Shams, H., Basit, K., Khan, M. A., Mansoor, A., Saleem, S. Scalable wear-resistant 3D printed slippery liquid-infused porous surfaces (SLIPS). Addit Manuf. 48, 102379(2021).
- Quan, H., et al. Photo-curing 3D printing technique and its challenges. Bioact Mater. 5 (1), 110-115 (2020).
- Belgardt, C., Graaf, H., Baumgärtel, T., Borczyskowski, C. V. Self-assembled monolayers on silicon oxide. Phys Status Solidi C. 7 (2), 227-231 (2010).
- Tesler, A. B., et al. A one-pot universal approach to fabricate lubricant-infused slippery surfaces on solid substrates. Adv Funct Mater. 31 (27), 2101090(2021).
- Huang, W. P., et al. Patterned slippery surface through dynamically controlling surface structures for droplet microarray. Chem Mater. 31 (3), 834-841 (2019).
- Sun, L., et al. Tailoring materials with specific wettability in biomedical engineering. Adv Sci. 8 (19), 2100126(2021).
- Kim, W. Y., et al. Quasi-seamless stitching for large-area micropatterned surfaces enabled by Fourier spectral analysis of moiré patterns. Nat Commun. 14 (1), 2202(2023).
- Pupillo, D., et al. Corrosion resistance of biodegradable zinc surfaces enhanced by UV-grafted polydimethylsiloxane coating. ACS Biomater Sci Eng. 10 (8), 4891-4900 (2024).
Reprints and Permissions
