This protocol describes a live-cell imaging method for monitoring lysosomal membrane permeabilization during necroptosis, utilizing fluorescent probes that detect changes in lysosomal membrane integrity and acidification.
Method Article
Live-cell Imaging of Lysosomal Membrane Permeabilization During Necroptosis
In This Article
Summary
Abstract
Necroptosis, a form of regulated necrosis, culminates in cell membrane rupture. Our lab and others have discovered that lysosomal membrane permeabilization (LMP) is an early and crucial event in this process, preceding membrane rupture. Rapid LMP releases potent lysosomal enzymes, particularly proteases, into the cytosol, actively promoting cell death. Live-cell imaging provides an invaluable tool for detecting LMP during necroptosis in real-time. Several fluorescent dyes are highly effective: (1) pH-sensitive LysoTracker dyes track changes in lysosomal pH. A decrease in fluorescence signal indicates a loss of the lysosomal pH gradient, a primary sign of lysosomal dysfunction, which may be a precursor or direct consequence of LMP. (2) Fluorescein-labeled dextran beads are internalized and accumulate in lysosomes. Their release into the cytosol signals complete LMP and cargo leakage. Here, we observed a progressive loss of Lysotracker fluorescence, with diffusing Dextran fluorescence into the cytosol after necroptosis induction. Thus, the live-cell imaging methodology enables researchers to precisely track the timing and extent of lysosomal dysfunction, contributing to a more comprehensive understanding of necroptosis mechanisms and illuminating potential therapeutic interventions.
Introduction
Necroptosis is a caspase-independent form of regulated cell death implicated in many inflammatory diseases, neurodegenerative disorders, pulmonary, hepatic, and cardiac diseases1,2,3. This pathway is mediated by a complex cascade of reactions that culminate in the activation of receptor-interacting protein kinase 1 (RIPK1), which interacts with receptor-interacting protein kinase 3 (RIPK3) via their homotypic RIP interaction motif (RHIM) domains4,5,6. RIPK3, in turn, recruits mixed lineage kinase-like protein (MLKL) to form the necrosome7,8. Phosphorylation of MLKL by RIPK3 leads to its oligomerization and subsequent polymerization. MLKL polymers then translocate to the cellular membranes, eventually leading to cell membrane rupture and cell death9,10,11. However, the mechanisms by which MLKL polymers translocate to the membrane compartments and induce membrane disruption are not fully understood.
Lysosomes are organelles responsible for the degradation and recycling of cellular materials. In its lumen, there are proteases, lipases, nucleases, and hydrolases that are responsible for digesting macromolecules, thereby maintaining cellular homeostasis12,13. Therefore, the maintenance of lysosomal integrity and proper function is essential for ensuring effective cellular clearance, adaptations to stress, and overall cell survival14,15,16. Recent studies indicate an association between necroptosis and lysosomal membrane permeabilization (LMP)17,18,19.
Our recent observations have shown that LMP is an early and significant event in the necroptosis process, preceding the final rupture of the cell membrane19. Specifically, MLKL polymerization on the lysosomal membrane induces rapid LMP to release potent lysosomal enzymes, particularly proteases, including cathepsin B, into the cytosol. These proteases then cleave vital proteins to promote cell death. Importantly, inhibiting CTSB activity strongly protects against cell death19,20. This data suggests that LMP is a crucial modulator of the necroptosis pathway. Therefore, monitoring the timing of LMP during necroptosis is essential for understanding the molecular mechanisms and identifying potential therapeutic targets.
Many conventional LMP detection methods, such as immunostaining, transmission electron microscopy (TEM), or flow cytometry, require fixed samples or otherwise provide only endpoint information21,22,23, failing to capture the dynamic process of lysosomal disruption, particularly in the context of rapid necroptosis progression. In contrast, the live-cell imaging method enables high-resolution, real-time visualization of LMP during necroptosis. In this protocol, we combined two complementary lysosomal markers and induced necroptosis in HT-29 cells to analyze lysosomal membrane integrity in real-time19. This technique provides a robust and adaptable platform for studying LMP not only in necroptosis but also potentially in other forms of cell stress where lysosomal integrity is compromised, particularly in the context of diseases or the use of lysosome-targeting therapeutics24,25,26.
Protocol
1. Cell culture - day 0
- Plate 5,000 cells in 2 mL of DMEM (Dulbecco's Modified Eagle Medium) supplemented with 10% Fetal Bovine Serum (FBS) and 1% Penicillin and Streptomycin (P/S) in a sterile glass-bottom dish.
- Incubate the cells at 37 °C with 5% CO2 overnight.
2. Dextran bead loading - day 1
- Dilute dextran green beads to 25 µg/mL in fresh DMEM supplemented with 10% FBS and 1% P/S by adding 20 µL of the 2.5 mg/mL stock solution.
- Remove the old medium and replace it with 2 mL of bead-containing DMEM supplemented with 10% FBS and 1% P/S.
- Incubate the cell for 24 h at 37 °C with 5% CO2 to allow internalization of beads into lysosomes.
3. Lysotracker staining - day 2 (experiment day)
- Prepare staining medium by adding 2 µL of 1 mM Lysotracker stock solution to 2 mL of fresh DMEM supplemented with 10% FBS and 1% P/S to obtain a final concentration of 1 µM. Replace the old medium with this staining solution.
- Incubate at 37 °C with 5% CO2 for 2 h, following the recommended incubation time (30 min to 2 h) provided in the Guidelines for Use from Molecular Probes by Life Technologies27. In our experiments, 2 h of incubation in HT-29 cells resulted in robust puncta staining with strong colocalization with dextran beads, indicating stable dye fluorescence.
NOTE: Turn on the confocal microscope 30 min before live-cell imaging.
4. Confocal microscope setup
- Turn on the Confocal system components in the following order: PC microscope; scanner power; laser power; laser emission; Leica power.
- Turn on the environmental controls: The Cube - temperature controller; The Brick - CO2 gas mixer controller. Open CO2 and O2 supply.
- Set gas parameters:
- Set the temperature controller (the cube) to 37 °C.
- Set the gas and humidity controller (the brick) to 5% CO2 and 95% humidity.
- Assemble the imaging chamber as shown in Figure 1.
- Set up the confocal objective:
- Use a 63x/1.40 NA oil immersion objective.
- Set the excitation lasers to 488 nm (green fluorophore) and 555 nm (red fluorophore).
- For the 488 nm laser, select a Hybrid (HyD) detector, and for the 555 nm laser, select a PMT detector.
NOTE: Fluorescence crosstalk was minimized by using predefined gates in the confocal software, which confirmed no crosstalk between the channels.
5. Post-staining preparation (after LysoTracker incubation)
- Wash the cells carefully three times with 2 mL of PBS.
- Add 2 mL of fresh DMEM supplemented with 10% FBS and 1% P/S.
- Apply one drop of immersion oil onto the objective lens before imaging.
- Mount the dish on the microscope stage.
- Adjust laser intensity and background.
- Adjust the laser intensity up to 3%, but no more than 5%.
- Adjust the detector gain in the microscope software to optimize the signal.
- To minimize the background, adjust the contrast bar.
- Acquire baseline images of untreated cells (before T/S/Z addition), which serve as the control condition.
- Return the plate to the laminar flow hood and add 1 mL of DMEM supplemented with 10% FBS and 1% P/S, containing 100 ng/mL of TNF-α (T), 500 nM of SMAC mimetic (S), and 100 µM of Z-VAD-FMK (Z).
- Continue imaging on the confocal microscope.
NOTE: T/S/Z were intentionally added at higher concentrations than the standard protocols. This choice was made to accelerate LMP and cell death, allowing early events to be captured more reliably in real-time imaging.
6. Image acquisition settings
- In the acquisition software, set parameters as follows: mode: xyt; format: 512 x 512; speed: 400; zoom: 3; line average: 1; line accumulation: 3; frame accumulation: 1; time interval: 3 min; duration: 8 h; enable autofocus.
- Click Start to begin time-lapse acquisition.
Results
The procedures described in this protocol enable the acquisition of live-cell images using confocal microscopy to monitor LMP in real time. Figure 1 illustrates a schematic representation of the experimental protocol, from cell plating to image acquisition. On Day 0, 5,000 HT-29 cells were plated and incubated for 24 h at 37 °C and 5% CO2. After 24 h (Day 1), the cells were incubated with fluorescein-labeled dextran beads (25 µg/mL) for an additional 24 h under the same conditions. These beads are internalized by endocytosis and traffic to the lysosomes, where they accumulate and appear as bright puncta. On Day 2 (Experiment Day), the cells were treated with pH-sensitive LysoTracker dye (1 µM) for 2 h at 37 °C and 5% CO2. LysoTracker concentrates and exhibits strong fluorescence within acidic compartments, such as late endosomes and lysosomes. Thirty minutes before imaging, the confocal microscope system was powered on and stabilized, including temperature, gas, and humidity controllers, as described in step 4 of the protocol. The imaging chamber was assembled, as demonstrated in Figure 2. The 488 nm (green) and 555 nm (red) lasers were used.
After incubation with LysoTracker, the cells were carefully washed three times with PBS, and 2 mL of fresh DMEM supplemented with 10% FBS and 1% P/S was added. The plate was transferred to the microscope, and one drop of immersion oil was applied on the 63x/1.40 NA oil immersion objective. The laser intensity and background levels were then adjusted to optimize imaging conditions, as described in step 5.5. of the protocol. Our initial images confirmed the presence of stable puncta of the Lysotracker and fluorescein-labeled dextran, indicating intact lysosomes (Figure 3). The baseline images were acquired before T/S/Z and used as a control. No vehicle was applied.
After establishing the initial imaging and microscopy settings, the plate was returned to the laminar flow hood, and 1 mL of DMEM supplemented with 10% FBS and 1% P/S, containing 100 ng/mL TNF-α (T), 500 nM SMAC mimetic (S), and 100 µM Z-VAD-FMK (Z) was added. Imaging continued on the confocal microscope using the imaging acquisition parameter outlined in step 6 of the protocol. As shown in Figure 3, Supplementary movie S1, and Supplementary movie S2, the progressive decrease in LysoTracker fluorescence in T/S/Z-treated cells served as an early indicator of lysosomal change. This loss was followed by, and occasionally occurred simultaneously with, the efflux of fluorescein-labeled dextran from the lysosomes into the cytosol (punctate-to-diffuse shift), indicating LMP. At 8 h, almost all Lysotracker signal disappeared, however, many cells still retained green puncta with cytosolic green signal, suggesting loss of lysosomal pH gradient precedes complete LMP and cargo release.
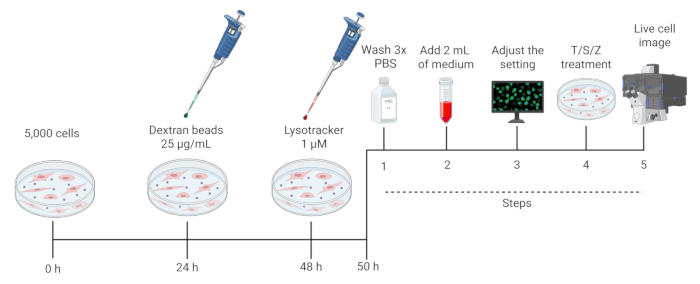
Figure 1: Schematic representation of the experimental protocol. (Created in BioRender.com) Initially, 5,000 cells were plated (0 h) and incubated for 24 h; after that, Dextran beads (25 µg/mL) were added and incubated for an additional 24 h. At 48 h, LysoTracker (1 µM) was added and incubated for 2 h. The cells were washed three times with PBS (step 1), followed by the addition of 2 mL of fresh DMEM supplemented with 10% FBS and 1% P/S (step 2). Microscopy settings were adjusted (step 3), and the cells were treated with TNF-α (T), SMAC mimetic (S), and pan-caspase inhibitor Z-VAD-FMZ (Z) (step 4), before live-cell image acquisition (step 5). Please click here to view a larger version of this figure.
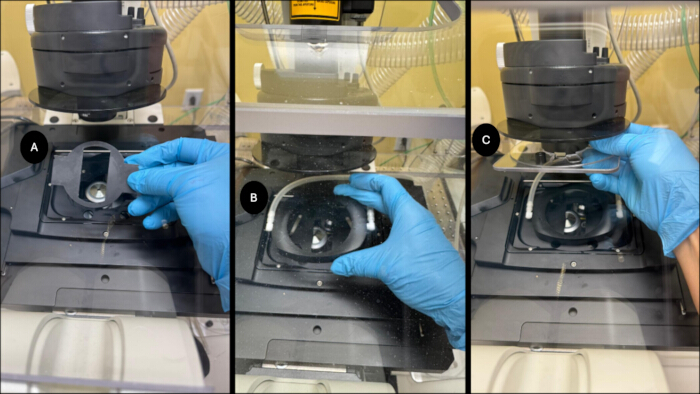
Figure 2: Diagram of the imaging chamber setup. (A) The sample holder, (B) the gas incubation chamber, and (C) the top lid. Please click here to view a larger version of this figure.
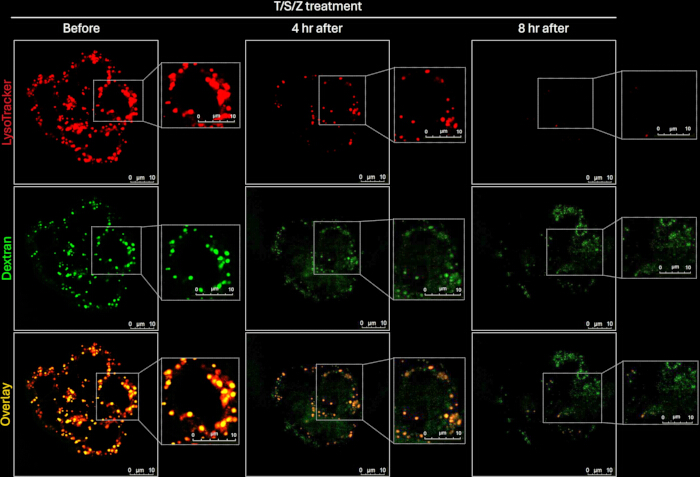
Figure 3: Representative images of HT29 cells before and after T/S/Z treatment. Cells were stained with Lysotracker red and Dextran green beads and treated with TNF-α (T), SMAC mimetic (S), and pan-caspase inhibitor Z-VAD-FMZ (Z). Scale bar: 10 µm. Please click here to view a larger version of this figure.
Supplementary Movie S1: Time-lapse of HT29 cells incubated with Dextran green beads and treated with T/S/Z. The cells were monitored for over 6 h to assess the cellular response. Please click here to download this Movie.
Supplementary Movie S2: Time-lapse of HT29 cells incubated with LysoTracker red and treated with T/S/Z. The cells were monitored for over 6 h to assess the cellular response. Please click here to download this Movie.
Discussion
This protocol demonstrated that the combination of both LysoTracker and fluorescein-labeled dextran beads enables simultaneous monitoring of lysosomal pH and cargo release in real-time. The representative results (Figure 3, Supplementary movie S1, and Supplementary movie S2) confirm that untreated cells maintain a stable puncta signal for both markers. In contrast, T/S/Z treatment indicates a progressive loss of Lysotracker intensity and a shift of dextran from puncta to diffuse cytosolic distribution, consistent with LMP.
A critical first step in this protocol is selecting the cells for image acquisition. Our previous data demonstrate that T/S/Z treatment causes the death of approximately 80% of HT-29 cells within 24 h, with the remaining 20% surviving19. Since LMP is not present at the start of the experiment, cells are initially selected based on morphology and their dual positive signal for both LysoTracker and Dextran beads. Although this method cannot predict which specific cells will undergo LMP, we consistently observed that approximately 60% of the monitored population eventually exhibits LMP during the 8 h imaging period. Another challenge stems from the inherent nature of sequential imaging. A slight drift in the cell's Z-position, which occurs during image acquisition every 3 min, prevents continuous tracking of the same puncta signal over the entire experiment. In addition, the cells migrate and undergo morphological changes in response to T/S/Z-treatment28. Consequently, it is impossible to follow the dynamics of individual lysosomes throughout the imaging period. In long-term live-cell imaging, the potential contribution of phototoxicity as a mediator of cell death is an important consideration. Continuous excitation during extended sessions can generate reactive oxygen species and impair cell viability29, potentially interfering with the genuine necroptotic response. To minimize this effect, we applied low laser power and short exposure times. In addition, five-time concentration of T/S/Z was administered to speed up the cell death process. However, we cannot entirely exclude the contribution of light-induced stress to the observed lysosomal changes.
An important advantage of this live-cell imaging protocol is its ability to monitor lysosomal pH change and LMP in real-time, capturing dynamic events that are missed by endpoint analyses, such as TEM, flow cytometry, and immunostaining. While TEM offers high-resolution structural insight, it cannot capture the temporal progression of LMP. Alternative live-cell methods, such as acridine orange relocation assays30 or galectin-puncta formation31, are also valuable tools for monitoring lysosomal integrity, but each has limitations when used in isolation. The acridine orange assay reports the redistribution of dye from acidic organelles to the cytosol, which is influenced by both lysosomal pH changes and membrane permeabilization, and therefore does not correlate directly with cargo release. Similarly, galectin-puncta formation reflects the exposure of luminal glycans to the cytosol and thus marks lysosomal membrane damage31,32, but it does not discriminate between partial permeabilization and complete lysosomal rupture.
The core strength of this protocol lies in combining LysoTracker and dextran beads, which enables the simultaneous investigation of lysosomal acidification and cargo leakage. This provides a unique, dual readout on both lysosomal functionality and structural integrity. LysoTracker fading acts as an indicator of a change in lysosomal pH, while dextran release directly reports the physical leakage of lysosomal content. By using these two markers together, we significantly enhance the detection of both partial and complete LMP. Therefore, this live-cell imaging strategy is broadly applicable. Researchers can adapt it for use with other cell types and different fluorescent probes to study lysosomal integrity under various experimental conditions, including pharmacological or genetic perturbations. This capability is key to advancing our understanding of necroptosis mechanisms and identifying potential therapeutic interventions.
Disclosures
The authors declare no conflict of interest.
Acknowledgements
Research in Dr. Zhigao Wang's lab is supported by NIH grants R35GM158455 and R01GM147474.
Materials
| Name | Company | Catalog Number | Comments |
|---|---|---|---|
| HT-29 cells | ATCC | HTB-38 | Colon Cancer Cells |
| 35 mm glass-bottom dish | MatTek Corporation | P35G-1.5-14-C-GRD | |
| CO2 Incubator | PHCBI | MCO-170AICUVL | |
| Confocal Microscope | Leica | SP8WLL | |
| Dextran green beads | ThermoFisher | D1820 | Dextran, Fluorescein, 10,000 MW, Anionic, Lysine Fixable |
| Dulbecco`s Modified Eagle Medium (DMEM) | Corning | 10-013-CV | |
| Fetal Bovine Serum (FBS) | Cytiva | SH30910.03 | |
| LysoTracker Red DND-99 | Invitrogen | L7528 | |
| Oil Immersion Type HF | Electron Microscopy Sciences | 16915-01 | |
| Penicillin and Streptomycin (P/S) | Sigma-Aldrich | P4333 | |
| Phosphate Buffered Saline (PBS) | Corning | 21-040-CV | |
| Smac mimetic (S) | BV6, ApexBio, Catalog | B4653 | Final concentration, 1 mM |
| The Brick | Life imaging services | 13685 | Gas Mixer CO2 Controller |
| The Cube | Life imaging services | CBO2A | Temperature control Chamber microscopes |
| Tumor Necrosis Factor alpha (TNF-α - T) | Peprotech | 30001A100UG | Final concentration, 20 ng/ml |
| z-VAD-FMK (Z) | ApexBio | A1902 | Final concentration, 20 mM |
References
- Shan, B., Pan, H., Najafov, A., Yuan, J. Necroptosis in development and diseases. Genes Dev. 32, 327-340 (2018).
- Kang, K., Park, C., Chan, F. K. Necroptosis at a glance. J Cell Sci. 135 (17), jcs260091(2022).
- Ai, Y., Meng, Y., Yan, B., Zhou, Q., Wang, X. The biochemical pathways of apoptotic, necroptotic, pyroptotic, and ferroptotic cell death. Mol Cell. 84, 170-179 (2024).
- Zhang, D. W., et al. RIP3, an energy metabolism regulator that switches TNF-induced cell death from apoptosis to necrosis. Science. 325, 332-336 (2009).
- He, S., et al. Receptor interacting protein kinase-3 determines cellular necrotic response to TNF-α. Cell. 137 (6), 1100-1111 (2009).
- Cho, Y. S., et al. Phosphorylation-driven assembly of the RIP1-RIP3 complex regulates programmed necrosis and virus-induced inflammation. Cell. 137 (6), 1112-1123 (2009).
- Sun, L., et al. Mixed lineage kinase domain-like protein mediates necrosis signaling downstream of RIP3 kinase. Cell. 148, 213-227 (2012).
- Zhao, J., et al. Mixed lineage kinase domain-like is a key receptor interacting protein 3 downstream component of TNF-induced necrosis. Proc Natl Acad Sci U S A. 109 (14), 5322-5327 (2012).
- Chen, X., et al. Translocation of mixed lineage kinase domain-like protein to plasma membrane leads to necrotic cell death. Cell Res. 24 (1), 105-121 (2014).
- Cai, Z., et al. Plasma membrane translocation of trimerized MLKL protein is required for TNF-induced necroptosis. Nat Cell Biol. 16, 55-65 (2014).
- Liu, S., et al. MLKL forms disulfide bond-dependent amyloid-like polymers to induce necroptosis. Proc Natl Acad Sci U S A. 114, E7450-E7459 (2017).
- Lawrence, R. E., Zoncu, R. The lysosome as a cellular centre for signalling, metabolism and quality control. Nat Cell Biol. 21, 133-142 (2019).
- Ballabio, A., Bonifacino, J. S. Lysosomes as dynamic regulators of cell and organismal homeostasis. Nat Rev Mol Cell Biol. 21, 101-118 (2020).
- Aits, S., Jaattela, M. Lysosomal cell death at a glance. J Cell Sci. 126, 1905-1912 (2013).
- Repnik, U., Hafner Cesen, M., Turk, B. Lysosomal membrane permeabilization in cell death: concepts and challenges. Mitochondrion. 19 (Pt A), 49-57 (2014).
- Alu, A., et al. The role of lysosome in regulated necrosis. Acta Pharm Sin B. 10 (10), 1880-1903 (2020).
- Werneburg, N. W., Guicciardi, M. E., Bronk, S. F., Gores, G. J. Tumor necrosis factor-α-associated lysosomal permeabilization is cathepsin B dependent. Am J Physiol Gastrointest Liver Physiol. 283, G947-G956 (2002).
- Vanden Berghe, T., et al. Necroptosis, necrosis and secondary necrosis converge on similar cellular disintegration features. Cell Death Differ. 17, 922-930 (2010).
- Liu, S., et al. MLKL polymerization-induced lysosomal membrane permeabilization promotes necroptosis. Cell Death Differ. 31, 40-52 (2024).
- Guicciardi, M. E., Miyoshi, H., Bronk, S. F., Gores, G. J. Cathepsin B knockout mice are resistant to tumor necrosis factor-α-mediated hepatocyte apoptosis and liver injury: implications for therapeutic applications. Am J Pathol. 159, 2045-2054 (2001).
- Aits, S., Jaattela, M., Nylandsted, J. Methods for the quantification of lysosomal membrane permeabilization: a hallmark of lysosomal cell death. Methods Cell Biol. 126, 261-285 (2015).
- Barral, D. C., et al. Current methods to analyze lysosome morphology, positioning, motility and function. Traffic. 23, 238-269 (2022).
- Huang, K., Jiang, X., Du, J., Zeng, H. Protocol for detecting lysosome quantity and membrane permeability in acute myeloid leukemia cell lines. STAR Protoc. 5, 103309(2024).
- Ferrari, V., et al. Lysosome quality control in health and neurodegenerative diseases. Cell Mol Biol Lett. 29, 116(2024).
- Otoda, T., Aihara, K. I., Takayama, T. Lysosomal stress in cardiovascular diseases: therapeutic potential of cardiovascular drugs and future directions. Biomedicines. 13, (2025).
- Cao, M., Luo, X., Wu, K., He, X. Targeting lysosomes in human disease: from basic research to clinical applications. Signal Transduct Target Ther. 6, 379(2021).
- Fisher, T. LysoTracker and LysoSensor probes. Thermo Fisher Scientific. , https://documents.thermofisher.com/TFS-Assets/LSG/manuals/mp07525.pdf (2013).
- Wang, Z., Jiang, H., Chen, S., Du, F., Wang, X. The mitochondrial phosphatase PGAM5 functions at the convergence point of multiple necrotic death pathways. Cell. 148 (1-2), 228-243 (2012).
- Kiepas, A., Voorand, E., Mubaid, F., Siegel, P. M., Brown, C. M. Optimizing live-cell fluorescence imaging conditions to minimize phototoxicity. J Cell Sci. 133 (4), jcs242834(2020).
- Eriksson, I., Vainikka, L., Persson, H. L., Ollinger, K. Real-time monitoring of lysosomal membrane permeabilization using acridine orange. Methods Protoc. 6 (4), 72(2023).
- Aits, S., et al. Sensitive detection of lysosomal membrane permeabilization by lysosomal galectin puncta assay. Autophagy. 11, 1408-1424 (2015).
- Hoyer, M. J., Swarup, S., Harper, J. W. Mechanisms controlling selective elimination of damaged lysosomes. Curr Opin Physiol. 29, 100590(2022).
Reprints and Permissions
