This protocol enables purification, characterization and culture of primary HLA-G+ extravillous trophoblasts (EVT) from the decidua basalis and chorionic membrane of human term placentas. Primary EVT cultures maintain viability for 96 h, allowing co-culture with sample matched maternal immune cells and subsequent flow cytometric and molecular analysis of their interactions.
Method Article
Purification of HLA-G+ Extravillous Trophoblasts from Human Term Placental Tissues for Phenotyping and Functional Analysis
In This Article
Summary
Abstract
The human maternal-fetal interface represents a unique immunological environment where maternal immune cells and fetal extravilllous trophoblasts (EVT) engage in direct cellular contact to establish and maintain immune tolerance. EVT exhibit a distinct immunophenotype characterized by the expression of tolerogenic molecules, including HLA-G, PD-L1, and PD-L2, which play pivotal roles in modulating maternal immune responses. In addition, human EVT express HLA-C that can be directly recognized by maternal NK and T cells and promotes their activation. Importantly, no orthologues of HLA-C or HLA-G are present in animal models used for research, and murine trophoblast lack MHC expression. Thus, investigating the phenotypic and functional properties of human EVT from placental tissues, under both physiological and pathological conditions, is essential for elucidating the mechanisms underlying pregnancy maintenance and pathophysiology of placental inflammation associated with preeclampsia, preterm birth, fetal growth restriction, and placenta accreta. This protocol outlines a comprehensive methodology for the isolation and characterization of primary human EVT from healthy term placental tissue as well as after preterm birth and preeclampsia. It includes: (1) dissection of placental and chorionic membrane tissues; (2) enzymatic digestion and the preparation of single cell suspensions; (3) EVT purification by FACS sort; (4) Phenotypic characterization by high-dimensional flow cytometry; and (5) short-term in vitro culture and co-culture with maternal immune cells for up to 96 h. Emphasis is placed on obtaining highly pure and viable EVT suitable for downstream applications such as immunological functional assays, protein and gene expression analysis. The implementation of this protocol enables a robust and reproducible platform for advancing understanding of EVT and maternal immune cell interactions and its implications in both healthy and complicated pregnancies.
Introduction
The human placenta contains four broad categories of trophoblast types, trophoblast stem cells, syncytiotrophoblasts, villous cytotrophoblasts, and extravillous trophoblasts (EVT), each with distinct functions and phenotypic characteristics. Among them, EVT exhibit unique immunological features, including high expression of immunosuppressive molecules, such as HLA-G, PD-L1, PD-L2, and members of the B7 family, as well as polymorphic HLA-C1,2,3,4,5,6. EVT invade deeply into maternal decidual tissue, spiral arteries, and the myometrium, placing them in direct contact with maternal immune cells7. EVT are characterized by prominent expression of polymorphic HLA-C, a key mediator of interactions with maternal T and NK cells that must be controlled to preserve immune tolerance during pregnancy. As the only classical MHC molecule expressed by EVT, HLA-C also enables antigen presentation to maternal memory T cells and supports immune protection8. However, several studies have shown that EVT directly increase regulatory CD4 T cells and tolerogenic states of CD8 T cells and NK cells to protect themselves from cytotoxicity and immune rejection9,10,11,12,13. In addition, some studies reported immunological changes in maternal immune cells and EVT of placentas obtained after preeclampsia, preterm delivery, or miscarriage compared to healthy controls14,15,16,17,18,19,20,21. Several possibilities may underly these immunological changes, including i) pre-existing maternal T cell abnormality; ii) impaired immunosuppressive functions of EVT; or iii) disrupted interactions between the two cell types. To clarify the underlying mechanistic drivers, ex vivo experimental modeling systems that allow evaluation of maternal immune cells and EVT interactions are essential.
The methods and approaches as presented here have several benefits over existing methods that utilize classical trophoblast lines, trophoblast stem cell models, or organoids. Most importantly, classical trophoblast cell lines and trophoblast stem cell models do not recapitulate essential features of primary EVT, including their MHC expression profiles3,5,22,23. Secondly, the complex medium requirements of human trophoblast stem cell (hTSC) and organoid cultures that include several molecular inhibitors directly affect immune cell functions and phenotype, preventing adequate assessment of EVT and immune cell interactions22,24,25,26,27. Lastly, the cellular diversity of hTSC cultures after differentiation and the inside-out nature of the placental organoid structures, allow immune interactions with trophoblast types that lack in vivo relevance, reducing the clarity of the studies22,27.
Here, we describe methods to purify primary HLA-G+ EVT from human term placental tissues, enabling culture for up to 96 h in the presence or absence of immune cell populations. The medium lacks molecular inhibitors that affect EVT and immune cell functions while maintaining their viability. This approach provides a valuable platform for directly ex vivo studies of EVT and immune cell interactions in healthy and complicated pregnancies. It is expected to contribute to the discovery of key drivers of maternal-fetal immune tolerance and identify therapeutic targets to resolve placental inflammation.
Protocol
The institutional review board at the Cincinnati Children's Hospital approved this research protocol (Approval #2021-0336), which meets requirements for bioethical considerations, handling of personal information, infectious pathogens, and informed consent procedures in accordance with U.S. law. Each laboratory should obtain approval that complies with national research guidelines before commencing the experiment.
This protocol focuses on culturing primary HLA-G+ EVT that maintain viability up to 96 h for secondary functional assay by improving our previous protocol2,28. Refer to Hamilton et al.2 for establishing HLA-G+ EVT-like cell line and Ikumi et al.28 for involving matched maternal decidual lymphocytes.
1. Set up the laboratory (day 0).
NOTE: Use a class II biosafety (BSL2) cabinet for handling samples.
- Set up two water baths at 39 °C and 37 °C. Set up a humidified CO2 incubator at 37 °C.
- Prepare 1x PBS, Wash Medium A, Wash Medium B, EVT culture Medium A, B, and C (Table 1 and Table 2).
- Thaw 15 mL of 10 mg/mL DNase I solution (Table 1) and 500 mL of 0.25% Trypsin/EDTA in a water bath at 37 °C.
- Place a container filled with biocidal/virucidal solution (e.g., 10% bleach) in the BSL2 cabinet for liquid waste collection. Set up a waste container with a biohazard bag in the BSL2 cabinet for solid waste.
- Prepare absorbent pads, sterile dissection tools (curved tip tweezers and 6 ½" scissors), sterile metal filters, tube racks, and sterile 50 mL conical tubes in the BSL2 cabinet.
- Prepare three 50 mL conical tubes (two with 1x PBS each and one with Wash Medium A for the collection of placental tissue pieces during dissection.
2. Sample collection (day 0)
NOTE: Use human placentas with membranes obtained via cesarean section between 24 to 42 weeks of gestation. A placenta delivered vaginally may yield fewer EVT.
- Begin processing the placenta immediately in a BSL2 cabinet, ideally within 1-2 h of delivery, to maximize the yield of viable cells. Maintain the placenta at room temperature at all times.
- Inspect the placenta and, if necessary, record its size, weight, and gross morphological appearance.
3. Tissue dissection (day 0)
- Membrane dissection
- Place the placenta facing the fetal side upwards (cord insertion part visible). Remove the amnion, which is the membrane layer closest to the fetal side, by manually peeling from the lateral membrane towards the umbilical cord insertion site; cut and discard the amnion.
- Cut the choriodecidual membrane into 2 inch strips starting from the base of the placenta upwards, while leaving the membrane strip attached to the placenta.
- Place the choriodecidual membrane strip on the two fingers facing decidual side upwards and gently scrape the maternal decidua parietalis from the chorion using the sterile curved tip forceps.
NOTE: Work efficiently and do not let the chorionic membrane dry out. - Collect the chorionic membrane into a 50 mL conical tube with 20 mL of Wash Medium A.
- Collect decidua parietalis for decidual lymphocyte isolation in the 50 mL conical tube with 20 mL of PBS and follow the protocol described by Ikumi et al. for lymphocyte isolation28.
- Cut the chorionic membrane with scissors in the 50 mL tube until it becomes small pieces of <2 mm2.
NOTE: The total amount of the settled membrane is ideally 30 mL after cutting. - Discard the Wash Medium A and wash with PBS several times until the supernatant becomes clear.
- Placenta dissection
- Place the placenta facing the maternal side up and remove blood clots. Cut the pieces of placenta basal plate (length 2 cm, width 2 cm, depth 0.5 cm) using sterile scissors, avoiding the necrotic, calcified, or ischemic parts.
- Place the piece of decidua basalis on the fingers facing the villi (fetal side) upwards. Carefully remove the villi from the decidua basalis with scissors to obtain 2-3 mm of membrane with only a thin layer of villi remaining on the decidua basalis.
- Collect decidua basalis tissue into the 50 mL conical tube with 20 mL of PBS. Chop the decidua basalis until they become small pieces of <2 mm2.
NOTE: The total amount of the settled tissue is ideally 15 mL after chopping. - Discard the PBS and wash the decidual basalis with PBS several times until the supernatant becomes clear without visible blood.
- Split 15 mL of tissue suspension into two 50 mL conical tubes (7.5 mL in each tube).
NOTE: The protocol of lymphocyte isolation from decidua basalis is distinct from this protocol. Refer to the protocol provided in Hamilton et al.2.
4. Tissue digestion (day 0)
- After the final wash of chorionic membrane and decidua basalis in section 3, fill all tubes with 1x PBS, centrifuge them at 200 × g for 1 min, and pour off the supernatant.
- Prepare the Tissue Digestion Enzyme Cocktail (Table 1). Add 150 mL of warm Tissue Digestion Enzyme Cocktail to a 300 mL glass bottle, then add 30 mL of chorionic membrane to the bottle.
- Add 20 mL of warm DMEM/F20 and 80 mL of warm Tissue Digestion Enzyme Cocktail to two glass 300 mL bottles and then add 7.5 mL of decidua basalis into each bottle.
- Incubate the bottle with chorionic membrane in the 39 °C water bath and the two bottles with decidua basalis in the 37 °C water bath. During the 15 min incubation, shake all bottles every 3-4 min (first digestion).
- After digestion, filter the digested tissue through metal sieves (mesh size 40). Add Wash Medium B to the tissues to rinse and to dissolve gelatinous substance.
- Filter the cell suspensions over a 100 µm filter into 50 mL tubes labeled with tissue type and digestion number.
- Proceed with the second digestion by transferring the undigested tissue back into the 300 mL medium bottles, add Tissue Digestion Enzyme Cocktail as described in step 4.2, and repeat steps 4.2-4.6.
NOTE: All decidua basalis tissues are transferred into one 300 mL bottle. Keep cells obtained after the first digestion and the second digestion separate. - Spin the cell suspension at 650 × g for 8 min and discard the supernatant.
- Combine the pellets (but keep the first digestion and second digestion separate) of the same tissue type and digestion number into one tube. Fill with Wash Medium B up to 25 mL.
5. Ficoll density gradient (day 0)
- Prepare four 50 mL conical tubes labeled with tissue type and digestion number. Pour 12 mL of Ficoll into the tubes.
- Carefully load the cell suspensions onto the Ficoll. Centrifuge the tubes at 800 × g for 20 min (room temperature) without brake.
- Carefully transfer the cell layer at the Ficoll-medium interface into clean 50 mL conical tubes labeled by tissue type and digestion number after centrifugation.
NOTE: Carefully collect the layer without disturbing the interface using a sterile transfer pipette. - Fill the tubes up with Wash Medium B, and centrifuge at 650 × g for 8 min.
- Discard the supernatant and resuspend the cell pellets with the remaining medium (approximately 0.5 mL). If necessary, keep approximately 10% of the cell suspension separate for phenotyping and use 90% for cell sorting. Count the cells to determine cell number and viability.
6. Sorting of EVT (day 0)
- Place the resuspended cell pellets into sterile FACS tubes labeled with tissue type and digestion number. Add anti-CD45-BV785 (1:100), anti-HLA-G-APC (1:125), and anti-EGFR1-BV711(1:160) (Table 3). Incubate the tubes for 20 min at room temperature in the dark.
- Add 1 mL of Wash Medium B and centrifuge them at 650 × g for 8 min.
- Discard the supernatant and resuspend the cell pellets with Wash Medium B to make approximately 1 × 10⁶ cells / mL cell suspension.
- Filter the cells through a 40 µm cell strainer, directly before cell sorting, and sort CD45-HLA-G+EGFR+ EVT into tubes with 1 mL of EVT Culture Medium A according to the gating strategy described in Figure 1A.
NOTE: For optimal trophoblast viability, a jet-in-air cell sorter (e.g., Bigfoot or MoFlo) should be used with a 100 µm Nozzle. Fluidics-based sorters (e.g., DB S6 or Sony Nano) may reduce trophoblast viability, whereas magnetic cell sorting strategies (e.g., Easysep or MACS) may preserve viability but have low purity, resulting in stomal cell overgrowth in the cultures. - Centrifuge the FACS tubes with sorted cells, discard the supernatant, and resuspend the cell pellets with EVT Culture Medium B.
NOTE: Proceed next section to prepare culture plates while sorting cells.
7. Primary HLA-G+ EVT culture for secondary assay (days 0 - 1)
- Coat the wells of flat-bottom 96-well cell culture plates with 50 µL of 20 µg/mL fibronectin (Table 2) at room temperature for 45 min.
- Remove the fibronectin and add the cell suspension with EVT Culture Medium B to the wells. Aim for 0.5 × 10⁵ basalis EVT cells/200 µL of medium/well and 1.0 × 10⁵ chorionic EVT cells/200 µL of medium/well. Incubate the cell culture plates for 12-18 h in the humidified CO2 incubator at 37 °C (day 0 incubation).
- On day 1, remove medium B, gently wash the cells with 1x PBS, and add EVT Culture Medium C with or without T cells for further (co)-culture (refer to section 8).
8. Co-culture of primary HLA-G+ EVT with activated T cells (days 0 - 4)
- Stimulation of CD8+T cells from 3rd party donor (days 0-1)
- During the sorting of HLA-G+ EVT (day 0), isolate peripheral blood immune cell populations from either sample-paired maternal blood or unrelated blood donors, using the referenced human CD8+ T Cell enrichment Cocktail (see the Table of Materials) followed by Ficoll density gradient centrifugation or FACS sort.
- Prestimulate T or NK cells with anti CD3/28 beads or cytokines (e.g., IL2, IL15, IL12, or IL18) in the Lymphocyte Cell Culture Medium as desired.
- Co-culture EVT with activated T cells (days 1-4)
- Count the number of lymphocytes and make cell suspensions with Lymphocyte Cell Culture Medium at a concentration of 0.5 × 10⁶ / mL. Add 1 × 10⁵ lymphocytes to the primary EVT wells (the volume of EVT Culture Medium C : Lymphocyte Cell Culture Medium = 1:1). Incubate the plates for 24-72 h in a humidified CO2 incubator at 37 °C.
- Harvest lymphocytes for the flow cytometry analysis and collect supernatants for cytokine analysis.
- Harvest EVT using trypsinization and collect EVT into the FACS tubes for the flow cytometry analysis on day 4 (refer to section 9).
9. Phenotyping of primary HLA-G+ EVT
NOTE: Proceed with flow cytometric staining immediately and keep EVT and all solutions needed at room temperature at all times.
- Centrifuge the FACS tubes with primary EVT at 650 × g for 7 min and discard the supernatant.
- Add the caspase 3/7 staining solution (Table 3) to the cell pellets and gently mix them.
- Stain the cells with antibodies (Table 3), gently mix them, and incubate for an additional 20 min (total 30 min incubation).
- Add 1 mL of EVT Culture Medium C, centrifuge the tubes at 650 × g for 7 min, and discard the supernatant.
- Resuspend the cell pellet with 0.4 mL of cell EVT Culture Medium C. Add 7-AAD staining solution (5 µL/cell suspension) into the tubes and analyze immediately on a flow cytometer.
Results
Expected cell yields
From 15 mL of decidua basalis, the expected HLA-G+ EVT yields 0.1-0.3 × 10⁶ cells from the first digestion and 0.1-0.6 × 10⁶ cells from the second digestion (total 0.2-0.8 × 10⁶ cells). From 30 mL of chorionic membrane, the expected HLA-G+ EVT yields are 0.4-1.0 × 10⁶ cells from the first digestion and 0.4-1.5 × 10⁶ cells from the second digestion (total 0.8-2.5 × 10⁶ cells). The proportion of caspase 3/7- 7-AAD- live EVT in the isolates is expected to be 90-95%.
Primary HLA-G+ EVT culture
The flow cytometry analysis of lineage markers (HLA-G, HLA-C, EGFR) and cell death markers showed that this protocol provides viable primary EVT culture until day 4 (96 h after plating the sorted EVT) (Figure 1B-D). Representative light microscopy images of primary chorionic and d.basalis HLA-G+ EVT are shown after 24, 48, and 72 h of culture (Figure 2A-F).
Co-culture of primary HLA-G+ EVT with T cells
This protocol enhanced the viability of primary EVT 96 h after isolation from the placenta, an improvement compared to our previous report1,2,10. Therefore, it enables the analysis of EVT responses following co-culture with pre-stimulated lymphocytes, which mimics acute inflammation at the maternal-fetal interface. EVT express polymorphic HLA-C as well as immunosuppressive co-inhibitory molecules, such as PD-L1, PD-L2, PVR (also known as CD155), B7H3, and HLA-E as determined by extracellular flow cytometry staining (Figure 3A,B). EVT increased the expression of HLA-C, as well as PD-L1, PD-L2, and HLA-E, but did not increase the expression of PVR and B7H3 when co-cultured with activated lymphocytes for 72 h according to the protocol section 8 (Figure 4A,B). In addition, no increase in EVT death was observed as shown by 7AAD and caspase 3/7 staining (Figure 4C,D).
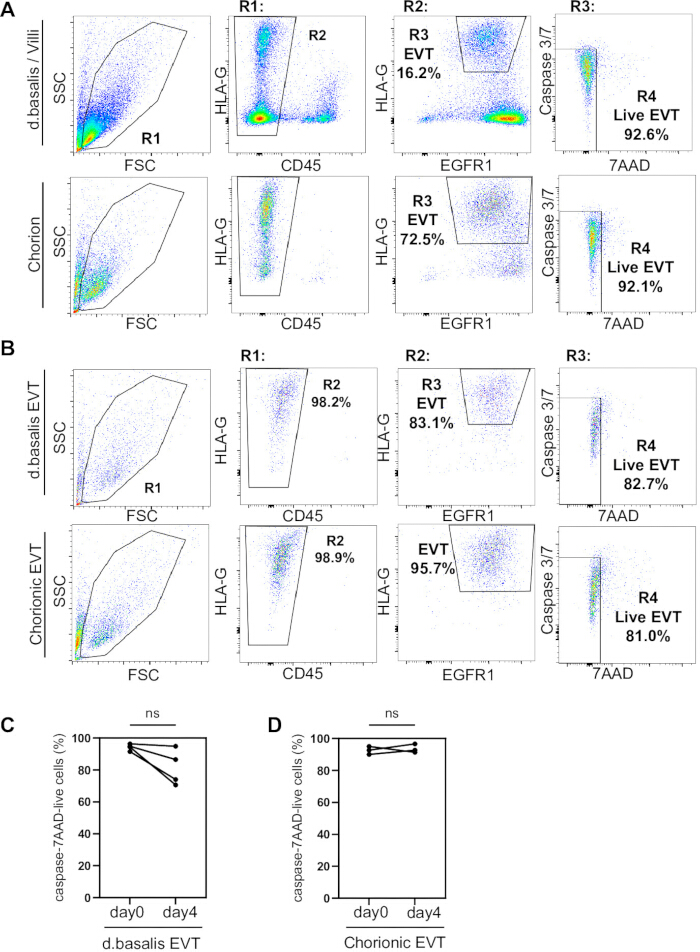
Figure 1. The gating strategy for EVT cell sorting and flow cytometry plots after culturing sorted EVT. (A) The representative gating strategy for sorting decidua basalis EVT and chorionic EVT. R1 is the live cell gate in the Forward-Side Scatter plot. R2 is the gate for exclusion of CD45+ leukocytes. R3 is the HLA-G+EGFR+EVT gate. R4 is the 7-AAD-caspase3/7- live EVT. Although R4 gate is not necessarily needed for sorting, it is shown here to demonstrate the viability of primary EVT. (B) Representative flow cytometry plots of sorted HLA-G+EGFR+EVT, following 96 h of in vitro culture. (C,D) Frequencies of caspase 3/7- 7-AAD- live EVT during the sort (day 0) and 96 h of culturing (day 4). Please click here to view a larger version of this figure.
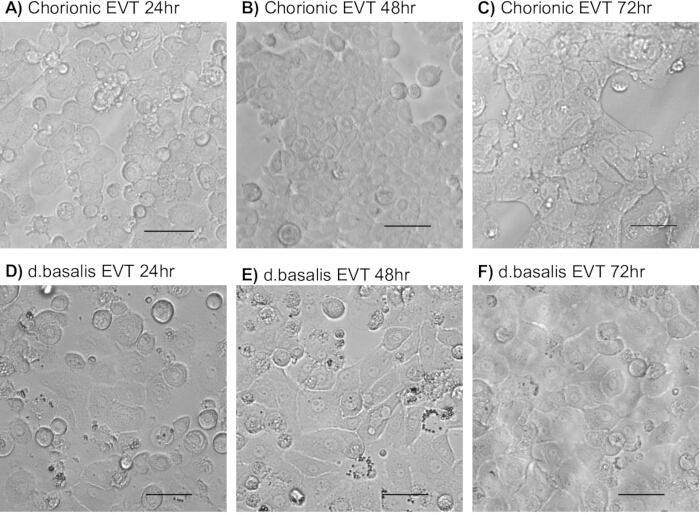
Figure 2. The morphology of EVT during in vitro culture. Representative light microscopy images of Chorionic EVT after (A) 24 h, (B) 48 h, and (C) 72 h of culture and decidua basalis EVT after (D) 24 h, (E) 48 h, and (F) 72 h of culture. Scale bar = 50 µm. Please click here to view a larger version of this figure.
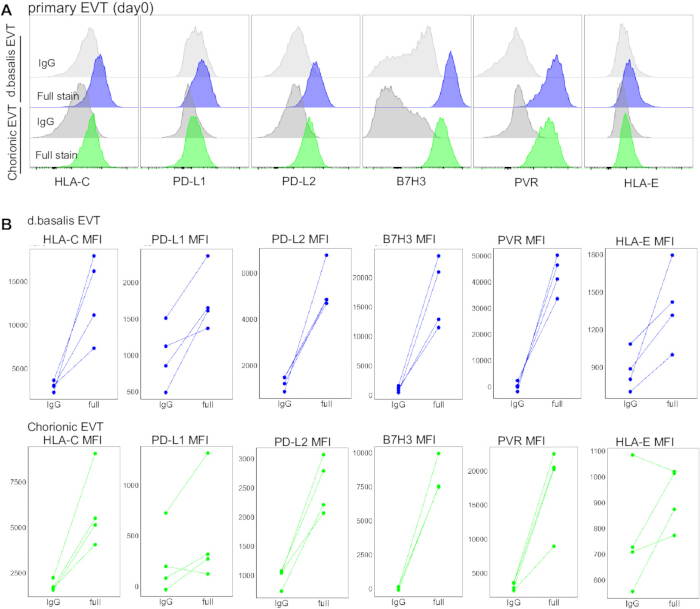
Figure 3. Immunological phenotypes of primary EVT. (A) The representative flow plots of HLAs and co-inhibitory molecules on primary EVT as determined by extracellular flow cytometry staining (day 0). (B) Paired line plots show raw MFI of IgG control and full stain of each marker from d. basalis EVT (blue) and chorionic EVT (green) on day 0. Please click here to view a larger version of this figure.
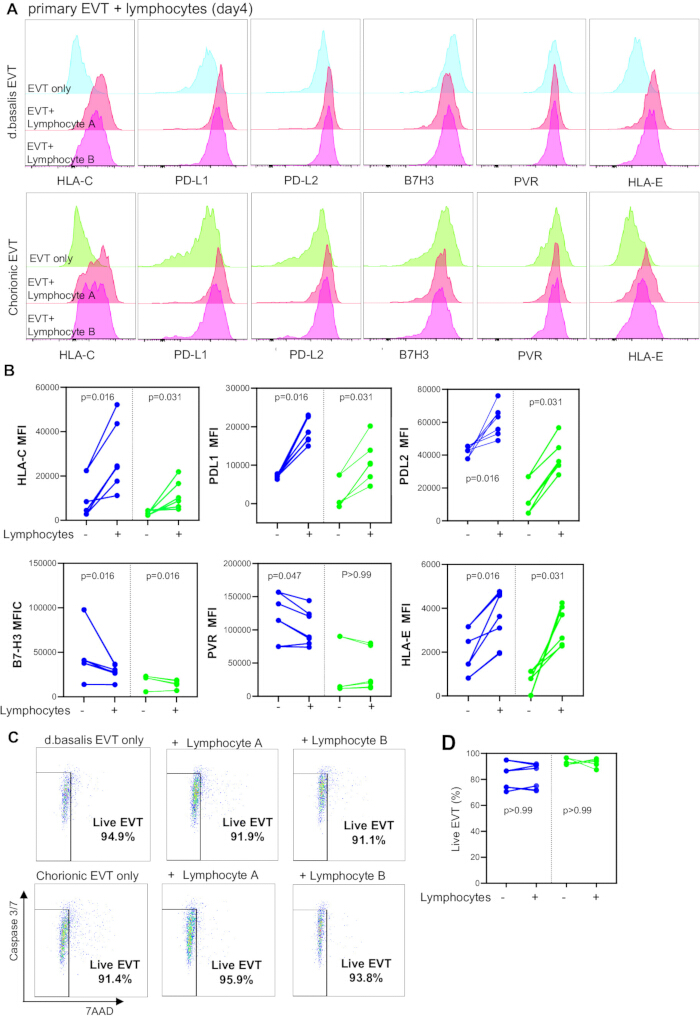
Figure 4. Immunological phenotypes of primary EVT with or without activated lymphocytes (day 4). (A) Representative flow plots of EVT following the 72-h culture (day 4) with or without activated third-party lymphocytes. (B) Paired line plots show MFI of EVT with or without activated third-party lymphocytes. Blue plots represent decidua basalis EVT, and green plots represent chorionic EVT. (C) Representative flow cytometry plots for caspase 3/7- 7-AAD- live EVT with or without activated third-party lymphocytes on day 4. (D) Paired line plots show frequencies of caspase 3/7- 7-AAD- live EVT with or without activated third-party lymphocytes. Blue plots represent decidua basalis EVT, and green plots represent chorionic EVT. Please click here to view a larger version of this figure.
Table 1. Key reagents for the tissue dissection and digestion. See also1,2,24. Please click here to download this Table.
Table 2. Key reagents for the EVT culture and co-culture with T cells. See also1,2,24. Please click here to download this Table.
Table 3. Key antibodies and reagents for sorting and flow cytometry analysis. Please click here to download this Table.
Discussion
Critical steps in the protocol
To obtain viable EVT, it is crucial to start cell isolation from the placenta immediately after delivery, and perform all procedures from isolation to sorting at room temperature. Since EVT are larger and more adhesive compared to lymphocytes, the following precautions should be taken for sorting to avoid clogging: i) pass cell suspension through a 40 µm cell strainer before sorting, ii) use a medium containing DNase for cell suspension, iii) avoid overconcentrating the cell suspensions (ideally ~1 × 10⁶ cells/mL), and iv) use a nozzle size of at least 100 µm. A Jet-in-Air sorter (e.g., Bigfoot, MoFlo) achieves a higher viable EVT yield compared to fluidics-based cell sorters (e.g., BD sorters, Sony Nano).
Modifications and troubleshooting of the method
Over or under-digested after the first digestion of decidua basalis EVT
Digestion efficiency of decidua basalis tissue varies between placentas. Overdigested tissues form large, sticky aggregates that are difficult to pass through the metal sieve. Typically, adding 10-30 mL of Wash Medium B helps to disperse these aggregates during filtration. If this does not resolve the problem, add 1-2 mL of DNase directly to the tissues. If the first digestion results in over-digestion, reduce the concentration of the Tissue Digestion Enzyme Cocktail from 80% to 70% for the second digestion. After the filtration of the first digestion, the residual tissue volume should be reduced to approximately less than half. If the residual tissue volume remains unchanged, increase the concentration of Tissue Digestion Enzyme Cocktail from 80% to 90-100% for the second digestion. Chorionic membrane tissues are consistently digested across placentas. Therefore, adjusting the concentration of the Tissue Digestion Enzyme cocktail is generally unnecessary.
For digestion of larger tissue volumes than those described in the protocol above
For digestions of more than 30 mL of chorionic membrane or more than 15 mL of decidua basalis tissue, use additional bottles with the Tissue Digestion Enzyme Cocktail. Increasing the tissue volume in a single bottle tends to result in underdigestion.
Limitations of the method
Lower EVT yields are expected from placentas delivered vaginally. EVT cannot be cryopreserved before or after sorting, as they are sensitive to freeze-thaw stress, which significantly limits their viability and function. Thus, this protocol does not include any stopping point.
The significance of the method with respect to existing methods
We previously reported the protocol for establishing HLA-G+ EVT-like cell lines from term placentas using Tissue Culture Medium B and collagen-coated plates. However, several inhibitors in the medium and collagen potentially affect T cell function in the co-culture system2. Other previous report that did not use Tissue Culture Medium B allowed for the evaluation of T cells in co-culture, but not of EVT due to the cell variability1,10. The advantage of the present protocol is that it minimizes the influence of culture medium while enabling the culture of viable primary EVT. This protocol provides an experimental platform to investigate the immunological function of EVT and their functional changes in response to surrounding immune cells-an area that has been underinvestigated.
Disclosures
There is no conflict of interest related to this study.
Acknowledgements
We would like to thank Sherry Thornton and the Research Flow Cytometry Core in the Division of Rheumatology at Cincinnati Children's Hospital Medical Center for all their help with flow cytometry and cell sorting; All nurses and physicians of participating hospitals for their efforts collecting placental materials; All Tilburgs lab members and CCHMC immunology faculty for their helpful discussions; This work was supported by NIH R01HD116852 (T.T.); Cincinnati Children's Research Foundation (T.T.); Burroughs Wellcome Fund Next Gen Pregnancy Award #NGP10115 (T.T.); and the March of Dimes Ohio collaborative grant (T.T.). S.T. is supported by JSPS KAKENHI Grant Numbers 22KK0287 and 25K12697.
Materials
| Name | Company | Catalog Number | Comments |
|---|---|---|---|
| 0.25% Trypsin/EDTA | Gibco | 25200-072 | |
| 15 mL Centrifuge tubes | Thermo Fisher | 14-955-238 | |
| -20 °C freezer | any supplier | ||
| 37 °C 5% CO2 Incubator | any supplier | ||
| 4 °C fridge | any supplier | ||
| 50 mL Conical Centrifuge tubes | Thermo Fisher | 14-955-240 | |
| 55 mM β-Mercaptoethanol | Gibco | 21985-023 | |
| 6 ½” scissors | any supplier | ||
| 7-AAD Viability Staining Solution | Biolegend | 420403 | |
| -80 °C freezer | any supplier | ||
| A83-01 | REPROCELL | 04-0014 | |
| AF700, mouse, IgG1 k Isotype Control | Biolegend | 400144 | |
| APC/Cy7 Rat IgG2a, κ Isotype Control | Biolegend | 400524 | |
| B7H3 PE/Dazzle594 | Biolegend | 351012 | |
| BD FACSymphony A5 SE Cell Analyzer | BD Biosciences | ||
| Bigfoot Spectral Cell Sorter | Thermo Fisher | ||
| Bovine Serum Albumin (BSA) | Sigma-Aldrich | A3294 | |
| BSL2 biosafety cabinet | any supplier | ||
| BV605 Mouse IgG1, κ Isotype Control | BD Biosciences | 562652 | |
| BV750 Mouse IgG1, κ isotype Control | Biolegend | 400105 | |
| BV785 Mouse IgG1, κ Isotype Cotrol | Biolegend | 400170 | |
| CD45 BV785 | Biolegend | 304048 | |
| Cell dissociation sieve | Millipore Sigma | CD1-1KT (mesh size 60) | |
| Cell strainers 40µm, 70µm, 100µm | Thermo Fisher | 22363547; 22363548; 22363549 | |
| CellEvent caspase-3/7 Green Detection Reagent | invitrogen | C10423 | |
| Centrifuge | any supplier | ||
| CHIR99021, 3mM | Sigma-Aldrich | SML 1046-5MG | |
| Curved tip tweezers | any supplier | ||
| Dimethyl Sulfoxide (DMSO) | VWR Life Science | 97063-136 | |
| DMEM/F12 | ThermoFisher | 11320-033 | |
| DNAse I | Sigma-Aldrich | DN25 | |
| Dynabeads Human T-Activator CD3/CD28 for T Cell Expansion and Activation | Thermo Fisher Scientific | 11131D | |
| EGF, Human, Recombinant, Animal Free | PeproTech | AF-100-15-1MG | |
| EGFR1 BV711 | Biolegend | 352920 | |
| FACS DIVA software | BD Biosciences | https://www.bdbiosciences.com/ja-jp/products/software/instrument-software/bd-facsdiva-software | |
| Ficoll Paque Plus | Cytivia | 17144003 | |
| FlowJo Software | FlowJo | https://www.flowjo.com/ | |
| HLA-C PE | BD Biosciences | 566372 | |
| HLA-E PE/Cy7 | Biolegend | 342608 | |
| HLA-G APC | abcam | AB40915 | |
| Human AB serum | Corning | 35060CI | |
| Human chorionic gonadotropin (hCG) (2500IU/mL) | Sigma-Aldrich | C1063 | |
| Human fibronectin (1mg/mL) | Corning | 354008 | |
| Human recombinant IL-2 | PeproTech | 200-02 | |
| Insulin-Transferrin-Selenium, 100x (ITS-G) | Thermo Fisher Scientific | 41400-045 | |
| ITGA6 APC/cy7 | Biolegend | 313627 | |
| L-Ascorbic Acid | Sigma-Aldrich | A0278 | |
| magnet separator | promega | Z5342 | |
| Newborn Calf Serum (NCS) | gibco | 16010-159 | |
| PD-L1 AF700 | invitrogen | 56-5983-42 | |
| PD-L2 BV750 | Biolegend | 345528 | |
| PE/Cy7 mouse, IgG1 k, Isotype Control | Biolegend | 400126 | |
| PE/Dazzle594 Mouse IgG1, κ Isotype Cotrol | Biolegend | 400176 | |
| Penicillin and Streptomycin | Gibco | 15140-122 | |
| Phosphate Buffered Saline 10X Solution | ThermoFisher | BP399-4 | |
| PVR BV605 | BD Biosciences | 748276 | |
| Research grade FBS | Thermo Fisher Scientific | FB12999102 | |
| RosetteSep Human CD8+ T Cell Enrichment Cocktail | Stem Cell | 15023 | |
| SB431542. 10 mM | Apex-Bio | A8249 | |
| Shaking water bath 37 °C | any supplier | ||
| Tryple Express 1x No Phenol Red | Thermo Fisher Scientific | 12604013 | |
| VPA | Sigma-Aldrich | P4543 | |
| X-VIVO 10 Serum-free Hematopoietic Cell Medium | Lonza | 04-380Q | |
| Y27632 | Sigma-Aldrich | 688000-1MG |
References
- Papuchova, H., et al. Three types of HLA-G+ extravillous trophoblasts that have distinct immune regulatory properties. Proc Natl Acad Sci U S A. 117 (27), 15772-15777 (2020).
- Hamilton, I., Ikumi, N. M., Kshirsagar, S., Goodman, W. A., Tilburgs, T. Utilizing primary HLA-G+ extravillous trophoblasts and HLA-G+ EVT-like cell lines to study maternal-fetal interactions. STAR Protoc. 4 (2), 102276(2023).
- Tilburgs, T., et al. Human HLA-G+ extravillous trophoblasts: Immune-activating cells that interact with decidual leukocytes. Proc Natl Acad Sci U S A. 112 (23), 7219-7224 (2015).
- Yu, J., et al. Progestogen-driven B7-H4 contributes to onco-fetal immune tolerance. Cell. 187 (17), 4713-4732.e19 (2024).
- Apps, R., et al. Genome-wide expression profile of first trimester villous and extravillous human trophoblast cells. Placenta. 32 (1), 33-43 (2011).
- Apps, R., Gardner, L., Hiby, S. E., Sharkey, A. M., Moffett, A. Conformation of human leucocyte antigen-C molecules at the surface of human trophoblast cells. Immunology. 124 (3), 322-328 (2008).
- Moffett, A., Loke, C. Immunology of placentation in eutherian mammals. Nat Rev Immunol. 6 (8), 584-594 (2006).
- Papúchová, H., Meissner, T. B., Li, Q., Strominger, J. L., Tilburgs, T. The dual role of HLA-C in tolerance and immunity at the maternal-fetal interface. Front Immunol. 10, 2730(2019).
- Vander Zwan, A., et al. Mixed signature of activation and dysfunction allows human decidual CD8+ T cells to provide both tolerance and immunity. Proc Natl Acad Sci U S A. 115 (2), 385-390 (2018).
- Salvany-Celades, M., et al. Three types of functional regulatory T cells control T cell responses at the human maternal-fetal interface. Cell Rep. 27 (9), 2537-2547.e5 (2019).
- Mahajan, S., et al. Antigen-specific decidual CD8+ T cells include distinct effector memory and tissue-resident memory cells. JCI Insight. 8 (17), e171806(2023).
- Crespo, ÂC., Strominger, J. L., Tilburgs, T. Expression of KIR2DS1 by decidual natural killer cells increases their ability to control placental HCMV infection. Proc Natl Acad Sci U S A. 113 (52), 15072-15077 (2016).
- Burton, G. J., Redman, C. W., Roberts, J. M., Moffett, A. Pre-eclampsia: Pathophysiology and clinical implications. BMJ. 366, 12381(2019).
- Inada, K., Shima, T., Nakashima, A., Aoki, K., Ito, M., Saito, S. Characterization of regulatory T cells in decidua of miscarriage cases with abnormal or normal fetal chromosomal content. J Reprod Immunol. 97 (1), 104-111 (2013).
- Tsuda, S., et al. Clonally expanded decidual effector regulatory T cells increase in late gestation of normal pregnancy but not in preeclampsia. Front Immunol. 9, 1934(2018).
- Tsuda, S., et al. CD4+ T cell heterogeneity in gestational age and preeclampsia using single-cell RNA sequencing. Front Immunol. 15, 1401738(2024).
- Pique-Regi, R., et al. Single-cell transcriptional signatures of the human placenta in term and preterm parturition. eLife. 8, e52004(2019).
- Yang, J., et al. Single-cell RNA-seq reveals developmental deficiencies in placentation and decidualization in late-onset preeclampsia. Front Immunol. 14, 1142273(2023).
- Morita, K., et al. Analysis of TCR repertoire and PD-1 expression in decidual and peripheral CD8+ T cells reveals distinct immune mechanisms in miscarriage and preeclampsia. Front Immunol. 11, 1082(2020).
- Sasaki, Y., et al. Proportion of peripheral blood and decidual CD4+ CD25bright regulatory T cells in pre-eclampsia. Clin Exp Immunol. 149 (1), 139-145 (2007).
- Sasaki, Y. Decidual and peripheral blood CD4+CD25+ regulatory T cells in early pregnancy and spontaneous abortion. Mol Hum Reprod. 10 (5), 347-353 (2004).
- Shannon, M. J., et al. Single-cell assessment of primary and stem cell-derived human trophoblast organoids as placenta-modeling platforms. Dev Cell. S1534-5807, 00043-00051 (2024).
- Apps, R., Murphy, S. P., Fernando, R., Gardner, L., Ahad, T., Moffett, A. HLA expression of primary trophoblast cells and placental cell lines. Immunology. 127 (1), 26-39 (2009).
- Okae, H., et al. Derivation of human trophoblast stem cells. Cell Stem Cell. 22 (1), 50-63.e6 (2018).
- Shimizu, T., et al. CRISPR screening in human trophoblast stem cells reveals shared and distinct aspects of placental development. Proc Natl Acad Sci U S A. 120 (51), e2311372120(2023).
- Hori, T., et al. Trophoblast stem cell-based organoid models of the human placental barrier. Nat Commun. 15 (1), 962(2024).
- Wang, M., et al. Single-nucleus multi-omic profiling of human placental syncytiotrophoblasts. Nat Genet. 56 (2), 294-305 (2024).
- Ikumi, N. M., Koenig, Z., Mahajan, S., Gray, C. M., Tilburgs, T. Purification of primary human placental leukocytes. STAR Protoc. 4 (2), 102277(2023).
Reprints and Permissions
