Polyglutamine spinocerebellar ataxias are caused by CAG expansions producing aggregation-prone proteins. This protocol describes vector production, stereotaxic delivery, and analysis of inclusions and neuronal marker loss, providing a controlled platform to investigate mechanisms and evaluate targeted therapies for neurodegenerative diseases.
Method Article
Lentiviral-Induced Striatal Pathology as a Preclinical Model of Polyglutamine Spinocerebellar Ataxias
In This Article
Summary
Abstract
Polyglutamine spinocerebellar ataxias are a group of six neurodegenerative diseases caused by a mutation in the trinucleotide CAG tract within the coding region of each causative gene. This mutation leads to an abnormally expanded polyglutamine stretch in the protein, making it prone to aggregation and leading to the formation of intraneuronal inclusions, which are a hallmark of these diseases. The molecular mechanisms underlying the pathogenesis of these diseases are complex and not fully understood. So far, these diseases remain incurable. Understanding molecular mechanisms in vulnerable brain regions is essential for therapeutic development. Flexible, region-specific experimental platforms are needed to rapidly test mechanisms and interventions without the time and cost of generating multiple transgenic lines, even though not addressing selective vulnerability. In recent years, we and others have developed several lentiviral-based models to study the impact of expanded protein expression in specific regions of the brain. These models show neuropathological and behavioral features that mimic some disease features, highlighting their importance in understanding the pathogenesis and in the development of new therapeutic strategies. In this paper, we describe the development of a striatal model using SCA2 as an example. We highlight lentiviral vector development and production, and the stereotaxic injection of the vectors expressing the expanded form of ataxin-2 (the disease-causing protein). Lastly, we characterize two main neuropathological hallmarks: the formation of inclusions and the loss of neuronal markers. By providing a controlled platform that reproduces these key pathological features, this model offers a valuable tool to dissect region-specific mechanisms of neurodegeneration and to evaluate targeted therapeutic interventions.
Introduction
Polyglutamine spinocerebellar ataxias (polyQ SCAs) are a group of six autosomal dominant neurodegenerative disorders caused by CAG trinucleotide repeat expansions in various causative genes, resulting in toxic polyglutamine (polyQ) tracts within encoded proteins1. Among them, the most frequent polyQ SCAs are SCA3/Machado-Joseph disease and SCA22. These disorders primarily affect neuronal cells in specific brain regions, including the cerebellum and brainstem, as well as the striatum and other areas. Consequently, they cause progressive motor incoordination, gait disturbances, severe neurodegeneration, and premature death3.
Multiple animal models have been developed to study polyQ SCAs and to test therapeutic approaches. Transgenic mice, knock-in lines, and conditional expression mouse models have been used to elucidate the molecular basis of disease progression and the cellular pathways involved4,5. However, generating a new disease animal model is time-consuming and costly, and it is often not suitable for studying brain regional involvement in disease pathogenesis6.
Lentiviral (LV)-based mouse models offer a complementary alternative to conventional models, with reduced cost and the possibility to study specific regions of the brain7,8. Lentivirus vectors allow the delivery of large transgenes (up to 8 kb), leading to a rapid induction of pathology in defined brain regions without the need for germline modification, and they can be used in animals of different ages. The direct injection of lentiviral vectors into the target brain region can achieve region-specific expression of pathogenic or therapeutic genes with reduced immunogenicity compared to other viral vectors4. Moreover, postnatal delivery avoids developmental compensation to investigate disease mechanisms under conditions that more closely resemble human onset9. Expression levels can be titrated by adjusting viral dose, producing phenotypes of controlled severity and facilitating modeling of graded disease progression. Additionally, this method allows cell-type-specific expression dependent on the chosen promoter4,7.
Several studies have shown the practicality and usefulness of LV-based mouse models for the modeling of polyQ SCAs10,11,12,13. We and others have developed LV-based models for SCA111, SCA212, SCA311,12, and SCA714, constituting platforms for rapid, region-specific expression or silencing of disease genes while reproducing key aspects of neuropathology.
In summary, the lentiviral approach described here provides a versatile and efficient tool for modeling the pathogenesis of polyQ SCAs. By overcoming some of the major drawbacks of current animal models, this method accelerates proof-of-concept studies and provides greater control over disease onset, localization, and severity - features that make it highly suitable for therapeutic screening and the study of molecular mechanisms. Here, we describe a reproducible method to generate and characterize a striatal lentiviral model of polyglutamine spinocerebellar ataxia, enabling detailed analysis of early pathogenic events and evaluation of candidate therapeutics.
Protocol
All animal experiments were conducted in accordance with the Animal Research: Reporting of In Vivo Experiments (ARRIVE) guidelines and the National Institutes of Health Guide for the Care and Use of Laboratory Animals. The present study was approved by the Direção-Geral da Alimentação e Veterinária (DGAV). C57BL/6J mice were used in this study and were group housed in standard cages under a 12 h light/12 h dark cycle, with food and water provided ad libitum.
NOTE: Materials used in this protocol are described further in the Table of Materials.
1. Packaging of lentiviral vectors
NOTE: All procedures involving lentiviral vectors must be conducted in a BSL-2 laboratory following the institution’s safety guidelines. We used the 4-plasmid transfection system due to its higher biosafety compared to other lentiviral producing systems (see Figure 1 for the details on the transfer plasmid).
- Thaw HEK 293T cells in a water bath and seed them in a T75 flask using Dulbecco's Modified Eagle Medium (DMEM) supplemented with 2 mM L-glutamine, 10% FBS, and 1% Pen-Strep. This complete DMEM medium was used in all steps of the protocol. Use cells at passage number ≤10 to ensure high viral titers and consistent results.
NOTE: Always check for mycoplasma contamination before proceeding. - When cells reach 80%-90% confluency, expand them into 2 T175 flasks by splitting the initial culture 1:2. Seed 20 100-mm culture dishes with 3.8 x 10⁶ cells per dish (final volume 10 mL) and incubate them for 24 h at 37 °C in a humidified incubator with 5% CO₂. Count cells by trypan blue exclusion using a Neubauer hemocytometer.
NOTE: Consider excluding Pen-Strep from the medium to reduce cell stress and, consequently, maximize cell transfection. - The next day, prepare the transfection mix as described in Table 1. Vortex and briefly spin down to homogenize. Incubate the mixture at room temperature for 10–20 min to allow DNA: PEI complexes to form.
- After the DNA: PEI complexes were allowed to form for 15 min at room temperature, adjust the mixture to 5 mL with complete DMEM.
Remove 5 mL of medium from each culture dish (half of the total volume) and replace it with the 5 mL of transfection mixture. This maintains the final culture volume at 10 mL during transfection. - Transfect the cells with the three packaging plasmids and the transfer plasmid as described in Table 1.
NOTE: All plasmids used for lentiviral production should be prepared using endotoxin-free purification kits. Moreover, the plasmid integrity should be verified by restriction enzyme analysis to confirm the correctness of the LTR regions and the transgene cassette prior to transfection. - Add 5 mL of the transfection mix dropwise to each plate and incubate for 6 h. Aspirate all the medium and replace it with 10 mL of fresh medium. Incubate for 48 h.
NOTE: To increase the viral titer, collect the medium at 48 h, add 10 mL of fresh medium to each plate, and collect again after 24 h. The previously collected medium can be stored at 4 °C for up to 24 h. This will allow for a concentration of twice the volume and increase the viral titer. - Filter all conditioned medium containing lentiviral vectors using a 0.22 µm filter unit.
2. Purification and titration of lentiviral vectors
- Transfer the filtered supernatant into appropriate conical ultracentrifuge tubes and centrifuge at 65,000 x g for 1 h 30 min at 4 °C, using, for example, a swinging-bucket rotor.
- Carefully discard the supernatant and resuspend each pellet in 400 µL of 1% BSA diluted in 1x PBS, avoiding bubble formation. Incubate on ice for at least 1 h.
- After 1 h of incubation, gently mix each tube to ensure the pellets are fully resuspended and homogeneous, then pool all resuspended pellets into a single tube.
- Fill the tube with 1% BSA/PBS until at least two-thirds full to prevent collapse during centrifugation.
- Centrifuge again at 65,000 x g for 1 h 30 min at 4 °C to pellet the lentiviral vectors. Carefully discard the supernatant and dry the rim of the tube with sterile paper.
- Resuspend the pellet containing the lentiviral vectors in 45 µL of 1% BSA/PBS, avoiding bubbles. Seal the tube with transparent film and incubate at 4 °C for 24 h.
- On the following day, prepare 10 µL aliquots of the lentiviral vectors. Keep a 10 µL aliquot for titration: 5 µL for the p24 ELISA kit and 2 µL for the qPCR kit. Titrate the lentiviral vectors using ELISA and qPCR according to the manufacturer’s instructions.
NOTE: The choice of titration method depends on the experimental needs, for example, a rapid assessment or precise quantification of infectious units. ELISA based on p24 quantifies the capsid protein and therefore measures total physical particles; it is rapid, less expensive than other methods, and highly reproducible. However, it does not distinguish infectious from non-infectious particles, which can lead to overestimation of functional titer. The titration based on qPCR measures the number of viral genomes (vg) packaged into particles, providing a more accurate estimate of genome-containing virions and allowing direct comparison between vector preparations. However, it still cannot assess the effective infectivity of the viral particles. Finally, infectivity-based assays, such as flow cytometry for fluorescent vectors or antibiotic-resistance colony formation, directly measure functional transducing units (TU/ml) and are the most biologically relevant, though they are more labor-intensive, cell-type dependent, time-consuming, and more expensive15,16.
3. Stereotaxic surgery for bilateral lentiviral delivery in the mouse striatum
- Animal preparation
- Weigh the animal and calculate the required anesthesia dose. Administer anesthesia intraperitoneally at a dose of 10 µL/g body weight using a ready-mix solution. This solution is prepared by combining 7.5 mL of 0.9% NaCl, 500 µL of medetomidine (1.0 mg/mL), 1.0 mL of midazolam (5.0 mg/mL), and 1.0 mL of fentanyl (0.05 mg/mL), for a final volume of 10 mL. Allow approximately 10 min for full induction of anesthesia.
- Confirm anesthesia depth (e.g., toe pinch reflex). Apply ophthalmic ointment to both eyes and shave the scalp.
- Place the animal in the stereotaxic frame on a heating pad. Position the head using the ear bars and bite bar.
NOTE: The number of animals to inject and the timeline are experiment-dependent and should be determined by a priori statistical power analysis based on the specific hypotheses and expected effect sizes. As an example, in our previous study12, the injected brains were analyzed at 4, 8, and 12 weeks post-injection to evaluate the progression of neuropathological changes.
- Syringe preparation and viral loading
- Use the standard Hamilton needle for loading and a 26G blunt-tip needle for injection. Load 2 µL of lentiviral vector solution into the syringe. Ensure the viral dose per injection site is 400 ng of p24 antigen/mL, or 5 x 10⁹ IU/mL10,12,17.
- Mount the syringe into the automated microinjection pump (e.g., Stoelting). Prime the syringe in infusion mode until a drop of liquid appears at the needle tip. Ensure the bevel is facing forward.
- Set the pump parameters - speed: 0.25 µL/min, volume per hemisphere: 2 µL, syringe type: appropriate to what is being used.
NOTE: The volume to inject depends on the rodent species and the target brain area to be transduced. Injections of 1 µL will lead to a focal expression, while larger total volumes (up to 10 µL) need very slow injection rates and carry a higher risk of tissue disruption or reflux.
- Striatal targeting and injection
- Prepare the surgical site using alternating applications of povidone-iodine or chlorhexidine-based scrub and 70% alcohol, repeated three times, before making the incision. During survival surgery, place a sterile drape or approved sterile barrier to maintain the sterile field and provide a sterile surface for suture handling during incision closure. Make a midline incision (~1–1.5 cm) using a sterile scalpel blade from between the ears to the eyes.
- Expose and clean the skull, removing the periosteum with cotton swabs. Locate Bregma and record the stereotaxic zero point (manually or digitally).
- Determine injection coordinates relative to Bregma (for a mouse with 8-12 weeks of age with approximately 18-20 g): Antero-posterior (AP) +0.6 mm; Medio-lateral (ML) ±1.8 mm; Dorso-ventral (DV): –3.3 mm.
- Drill carefully at the marked AP/ML coordinates. Proceed slowly to avoid penetrating the brain. Alternatively, stop once the bone is sufficiently thinned - this is indicated by visualization of blood vessels in the dura mater through the skull. Carefully perforate the dura mater with a small needle.
- Test that the hole is in the right position by lowering the injection needle. Test for needle clogging by injecting a portion of the solution until a drop is clearly visible.
- Lower the injection needle slowly to the DV coordinate. Inject 2 µL of viral solution per hemisphere at 0.25 µL/min. After injection, wait 5 min before slowly retracting the needle to avoid reflux.
- Inject lentivirus encoding for the wild-type protein (ATXN2WT or ATXN3WT) into one hemisphere and lentivirus encoding for the mutant/expanded protein (ATXN2MUT or ATXN3MUT) into the contralateral side (randomized or predefined)12,13.
NOTE: Using the mouse brain atlas18, virtually all brain regions can be targeted stereotaxically beyond the striatum, including cortex, hippocampus, substantia nigra, and cerebellum. Because the cerebellum is the primary site of pathology in SCAs, it represents a particularly relevant target for vector delivery. For the development of this cerebellar SCA3 mouse model, we used coordinates 1.6 mm rostral to lambda, 0 mm from the midline, and 1 mm ventral to the skull surface, with the mouth bar set at −3.3, ensuring precise targeting of the cerebellar cortex12,15.
- Monitoring during surgery
- Monitor whisker movement and reflexes. If movement is observed, administer a supplemental anesthesia dose (one-third of the initial volume).
- Wound closure and recovery
- Close the incision with 3–5 interrupted 5-0 nylon sutures. Administer a mixture of antagonistic drugs subcutaneously at a dose of 10 µL/g body weight to reverse the effects of the initial anesthetics. This solution is prepared by combining 1.5 mL of 0.9% NaCl, 500 µL of atipamezole (5.0 mg/mL), 5.0 mL of flumazenil (0.1 mg/mL), and 3.0 mL of naloxone (0.4 mg/mL), for a final volume of 10 mL.
- Place the animal in a clean recovery cage over a heating pad and monitor it overnight.
NOTE: The injection room should ideally be equipped with a biological safety cabinet for vector handling. Researchers must wear appropriate personal protective equipment (PPE), including a lab coat, gloves, and eye protection. All waste (e.g., needles, syringes, and contaminated materials) must be disposed of in biohazard containers according to institutional and national regulations. Administer peri-operative analgesia according to the approved institutional veterinary protocol, ensuring that the drug reaches effective levels before anesthetic reversal. In models where neuroinflammation is a relevant disease-associated outcome, analgesics with anti-inflammatory activity may confound inflammatory readouts; therefore, the analgesic regimen should be selected with veterinary oversight and justified in the animal protocol.
4. Tissue collection, preparation, and processing
- Preparation
- Prepare all dissection instruments and required solutions for mouse euthanasia and tissue collection (e.g., anesthesia, 4% paraformaldehyde [PFA] in PBS).
- Prepare 4% PFA in advance, store it frozen, and thaw no more than 24 h before use. Ensure the solution is thoroughly chilled prior to perfusion.
CAUTION: PFA is toxic. Handle only inside a fume hood with appropriate personal protective equipment (PPE) and training. - Administer a lethal dose of pentobarbital (100–200 mg/kg, intraperitoneally) to anesthetize the animal. Confirm deep anesthesia by the absence of the toe-pinch reflex; if the reflex persists, administer an additional dose.
- Transcardial perfusion
- Position and secure the animal in the dissection apparatus. Using forceps, lift the abdominal skin and make an ascending vertical incision with scissors (Figure 2A, pink arrow).
- Lift the superficial fascia and make a superior incision until the liver is visible, avoiding injury to abdominal organs.
- Cut the diaphragm horizontally, then extend the incision toward the axilla (Figure 2A, white arrow). Reflect and pin back the thoracic wall.
- Insert a perfusion needle into the apex of the left ventricle, ensuring it does not pierce the ventricular wall. Make a small incision in the right atrium with fine scissors (Figure 2B).
- Begin transcardial perfusion using 50 mL of ice-cold 4% paraformaldehyde (PFA) at a flow rate of 1-2 mL/min.
NOTE: Often, the cold solution causes tail curling and muscle twitching, which is an indicator of good perfusion.
- Brain dissection
- Prepare a tube containing sufficient PFA 4% to fully submerge the brain. Decapitate the mouse with large scissors. Dispose of the body in a sealed biohazard bag for incineration.
- Reflect the scalp to expose the skull. Identify the foramen magnum and begin removing the skull by cutting laterally with fine scissors, parallel to the brain (Figure 2C).
- Repeat on the contralateral side, then cut the skull between the eyes above the olfactory bulbs.
- Lift the skull from the cerebellum toward the olfactory bulbs to expose the brain. Using a spatula, remove the brain carefully from posterior to anterior and immerse it in 4% PFA for no longer than 24 h at 4 °C.
- Replace the embedding solution with 20%-30% sucrose in PBS and incubate at 4 °C until infiltration is complete. The brain will initially float and then sink once fully infiltrated, typically within 24 h. If it remains afloat, extend the incubation until it settles at the bottom of the tube.
NOTE: This cryoprotection step minimizes freezing artifacts by reducing tissue water content.
Gently dry the brain and tube, then store at -80 °C until further use.
- Cryosectioning and free-floating tissue collection
- Prior to sectioning, set the cryostat at -20 °C and the desired thickness.
NOTE: For the striatum, coronal sections with a thickness of 20-25 µm offer an ideal compromise between structural preservation and antibody penetration, producing sections that are robust enough for handling while maintaining high staining quality and spatial resolution. Cryosectioning conditions should also be specified for other brain regions, as optimal thickness can vary with cytoarchitecture. For the cerebellum, sagittal sections of 25–35 µm are generally recommended, as this thickness preserves the layered organization of the cerebellar cortex. - Transport the brain on dry ice and allow it to equilibrate inside the cryostat for 5-10 min. This step is important to prevent tissue damage.
- Remove the olfactory bulbs with a scalpel; they should be soft and easy to cut. Apply a pea-sized drop of fresh O.C.T. onto the specimen disk and place the cerebellum in contact (Figure 1D). Position the brain for coronal sectioning. Once frozen, add additional O.C.T. to embed the entire brain.
NOTE: O.C.T. is transparent at room temperature and becomes opaque white when fully frozen; if it remains shiny, allow more freezing time in the cryostat. - Mount the specimen disk in the holder and trim until the striatum (two white circles in each hemisphere) is visible. If hemispheres received different treatments, pierce one hemisphere with a needle to maintain orientation. Record this for later analysis.
- Switch to sectioning mode and collect free-floating sections in a 48-well plate using a fine brush or a fire-polished glass Pasteur pipette.
NOTE: The free-floating method improves antibody penetration, reduces background, allows long-term storage, and ensures evenly spaced sections for complete striatal coverage. - Fill wells with PBS containing 0.05% sodium azide.
CAUTION: Sodium azide is toxic - handle with PPE and dispose of waste appropriately. - Place the first section in well A1, the second in A2, and continue sequentially. When the plate is full, either continue in a new plate or return to well A1 and proceed until the entire striatum is sectioned (~3 full 48-well plates). Seal plates with transparent film and store at 4 °C until use.
NOTE: For whole-striatum analysis, selecting one column from the plate yields evenly spaced sections representative of the entire region.
- Prior to sectioning, set the cryostat at -20 °C and the desired thickness.
5. Immunohistochemistry with DAB staining
- Wash sections 3x in PBS to remove residual sodium azide. Incubate in phenylhydrazine solution (0.2 - 0.3 mg/mL in PBS) for 30 min at 37 °C.
CAUTION: Phenylhydrazine is carcinogenic - perform this step in a fume hood and dispose of waste as hazardous. - Wash 3x in PBS for 5 min, 10 min, 10 min sequentially. Block the tissue for 1 h at RT in PBS containing 10% normal goat serum (NGS) and 0.1% Triton X-100.
- Incubate overnight at 4 °C with primary antibody in the recommended dilution (e.g., mouse anti-ataxin-2, 1:1000 in blocking solution) under gentle agitation. Wash 3x in PBS for 5 min, 10 min, 10 min sequentially.
- Incubate with biotinylated secondary antibody (1:200 in blocking solution) for 2 h at RT under gentle agitation. Wash 3x in PBS for 5 min, 10 min, 10 min sequentially.
- Incubate in ABC complex for 30–40 min at RT. Wash 3x in PBS for 5 min, 10 min, 10 min sequentially.
- Prepare DAB solution fresh: for 2.5 mL of ultrapure water, add 1 drop buffer and vortex; add 2 drops DAB and vortex; add 1 drop H₂O₂ and vortex again.
CAUTION: DAB is carcinogenic - handle in a fume hood and discard waste properly. - Develop sections in DAB solution individually until the desired staining intensity is reached (typically 1–10 min). Stop the reaction immediately by transferring to PBS.
NOTE: DAB reactivity decreases over time; work efficiently. If more than one section is in the well at a time, ensure they are not in contact, as it will influence the staining process. - Wash 3x in PBS for 5 min, 10 min, 10 min sequentially. Mount sections on gelatin-coated slides and allow them to dry completely. Do not label slides with a graphite pencil, as it may interfere with imaging.
- Dehydrate, clear, and coverslip as follows: Immerse in distilled water for 30 s, dehydrate through ethanol series: 75%, 96%, 100% (3 min each). Clear in xylene substitute for 5 min and air dry. Apply coverslip using a quick-hardening mounting medium and allow it to cure inside the fume hood for at least 24 h before imaging or storing.
6. Quantification of DARPP-32-depleted volume in the mouse striatum using FIJI (ImageJ)
- Image acquisition
- Capture images of coronal brain sections spanning the entire striatum (approximately Bregma +1.0 to –0.5 mm). Maintain consistent illumination, magnification (e.g., 10x), and resolution. Save images in TIFF format with sequential filenames (e.g., Striatum_Bregma_+0.5.tif).
- Image preparation in FIJI
- Open each image in FIJI. Calibrate the pixel size: Go to Analyze > Set Scale. Use a known scale from a micrometer or the image metadata (e.g., 1 pixel = 1 µm).
- Convert images to 8-bit: Image > Type > 8-bit. Adjust brightness/contrast if necessary for optimal visualization of the depleted area (avoid thresholding at this step).
- ROI selection of depleted areas
- Use the Polygon, Freehand, or Brush tool to outline the DARPP-32-depleted region (usually lighter or absent staining in the striatum). Go to Analyze > Measure to record the area in µm2.
- Save the ROI by going to ROI Manager > Add > More > Save or use the Multi-measure function for batch analysis.
- Repeat for all relevant brain sections.
- Calculation of depleted volume
- Multiply the depleted area in each section by the distance between sections (typically 120 – 240 µm, depending on section thickness and spacing).
Volume per section (mm3) = Depleted area (mm2) × Section interval (mm) - Sum the volume across all sections:
Total depleted volume (mm3) = Σ (area × interval) - Optional: Overlay for visualization. Use Image > Overlay > From ROI to visualize the depleted regions across sections. Export a summary image or animation for figures.
- Multiply the depleted area in each section by the distance between sections (typically 120 – 240 µm, depending on section thickness and spacing).
- Always check alignment with the mouse brain atlas for accurate rostro-caudal mapping. Analyze each hemisphere separately to distinguish unilateral effects (e.g., WT vs mutant injection).
7. Quantification of protein aggregates in the mouse striatum
- Manual quantification using FIJI
- Load and calibrate the image. Open the image in FIJI. Calibrate pixel size (skip this step if using images with metadata).
- Go to Analyze > Set Scale, enter the known distance (e.g., 1 pixel = 0.5 µm). In FIJI, go to Plugins > Analyze > Cell Counter > Cell Counter. Click Initialize, then select the image.
- Choose a marker type (e.g., Type 1) for aggregates. Manually click on each visible aggregate to label it. Record Data: FIJI will display the count in the Cell Counter panel. Record counts for each image/section. Export counts manually or use a macro to compile results.
- Semi-automated quantification using IHCAggreCount
- Upload and process images. Open IHCAggreCount and click Upload Image (Supplementary Figure 1).
NOTE: The IHCAggreCount application was developed by our laboratory as a standalone scientific tool designed to streamline and standardize the quantification of cell aggregates from microscopy images. The software was built entirely in Python using a modular architecture that separates image handling, processing, selection corrections, measurement calculation, and others. IHCAggreCount is fully compatible with Windows 10 and Windows 11, as well as macOS 13 Ventura and macOS 14 Sonoma, and has been tested successfully on both platforms. Compared with conventional manual image-inspection methods, the software provides significant analytical advantages: it reduces user subjectivity, eliminates repetitive manual steps, accelerates image processing, ensures reproducible measurements, enables consistent region-of-interest extraction, and allows batch processing of multiple environments. Overall, the application provides a faster, more objective, and more robust workflow for globule detection and quantification than the traditional manual approach. The application is available from the authors upon reasonable request. - The image will appear in the Original Image Display. Navigate to the Processing Tab. Apply HiLo to enhance aggregates/background contrast (see Supplementary Figure 2). Apply a brightness threshold to filter aggregates from the background (Supplementary Figure 3). Use the Min Size Filter to remove small particles (noise) (Supplementary Figure 4). Optionally apply Roundness Threshold to exclude non-aggregate shapes (Supplementary Figure 5).
- For IHC aggregate detection, go to the General Tab and click Calculate Total Aggregates and Calculate Aggregate Area. All detected aggregates are highlighted and listed in the Matrix Table (ID, area, mean size; Supplementary Figure 6).
- Upload and process images. Open IHCAggreCount and click Upload Image (Supplementary Figure 1).
- Manual corrections (optional)
- Go to the correction tab, use Smart Add to auto-detect aggregates in selected regions (Supplementary Figure 8). Use manual add to manually label aggregates. Use Smart Delete to remove unwanted labels. (Highlighted aggregates are displayed for visual inspection; Supplementary Figure 7).
- Exporting results
- Click Export CSV to export the current image data. Click Export All to batch-export data from multiple analyzed images. Always analyze images under the same brightness/contrast settings and other parameters (e.g., threshold) across experimental groups in IHCAggreCount.
Results
This study successfully identified the expression of ataxin-2 and DARPP-32 using the present protocol. Following stereotaxic injection of lentiviral vectors into the striatum of C57BL/6J mice, robust expression of both wild-type and mutant ataxin-2 was detected after 12 weeks. We showed previously12 that these constructs are specific to neurons, effectively transducing an average of 20,000 neurons per mm3. Under our experimental conditions, immunostaining for ataxin-2 revealed a diffuse cytoplasmic distribution of wild-type ataxin-2 without forming discrete inclusions (22Q; Figure 3A, yellow arrows). In contrast, mutant ataxin-2 (104Q) exhibited cytoplasmic aggregates with a distinct spherical morphology (Figure 3B, red arrows). These aggregates appeared as well-defined, high-intensity puncta clearly distinguishable from the homogeneous cytoplasmic staining observed in the wild-type condition and typically ranged from approximately 1–5 µm in diameter. The presence of these discrete inclusions was used as an operational criterion to define successful pathological expression of mutant ataxin-2, and indicates that the lentiviral-based protocol effectively induces polyglutamine-dependent aggregation in the targeted brain region.
Immunolabeling with DARPP-32, a marker for medium spiny neurons19, demonstrated that both wild-type and mutant ataxin-2 were expressed within the striatal neuronal population (Figure 3C,D). While wild-type ataxin-2 expression did not alter the gross morphology of DARPP-32–positive neurons, the mutant protein produced neuronal marker loss (red area).

Figure 1: Schematic representation of the lentiviral transfer vector containing the human ATXN2 gene. The vector contains: a 5′ long terminal repeat (LTR); a central polypurine tract (cPPT) that enhances nuclear import of the reverse-transcribed viral genome; the internal PGK promoter that drives expression of the transgene (human ATXN2 with 22 or 104 glutamines); the Woodchuck Hepatitis Virus post-transcriptional regulatory element (WPRE) that increases transcript stability and export; and, finally, the 3′ LTR contains the ΔU3 SIN modification that is duplicated during reverse transcription, ensuring promoter inactivation in the integrated provirus. Please click here to view a larger version of this figure.
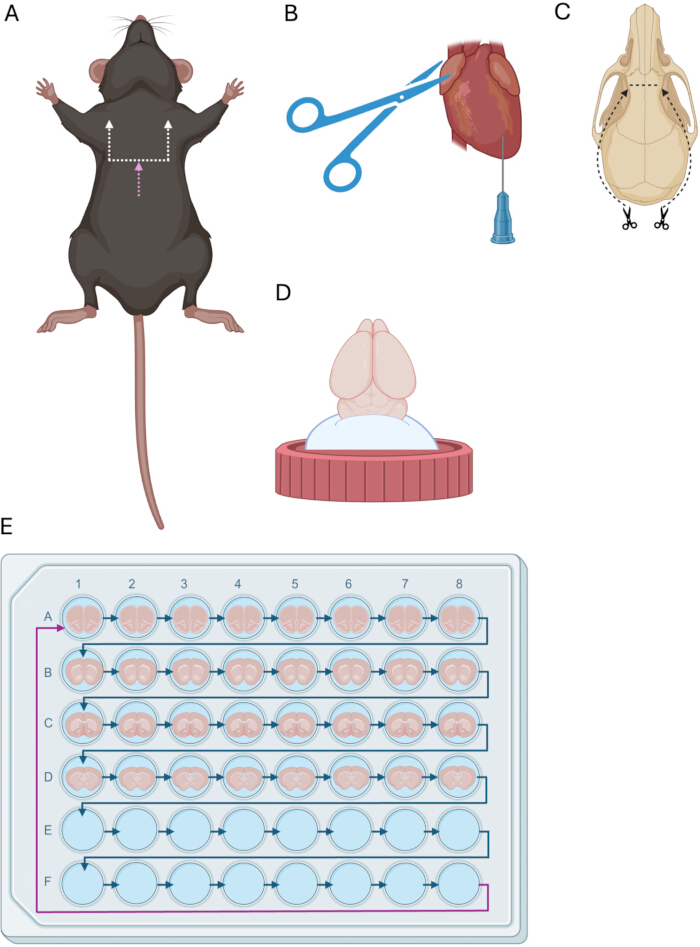
Figure 2: Brain tissue collection and processing illustration. (A) Diagram representing the transcardial perfusion procedure. Cut the abdominal wall as indicated by the pink arrow. Proceed with two lateral incisions into the thoracic cavity (white arrows). (B) Starting the transcardial perfusion by inserting the syringe from the heart apex into the left ventricle. Cut the right atrium and start infusing the perfusion solution. (C) Two lateral incisions parallel to the skull are made from the foramen magnum to the olfactory bulbs. Cut the frontal bone. (D) Mount the brain in a specimen disk using O.C.T. (E) Brain section collection using the free-floating method. In a 48-well plate, starting in well A1, add a brain section and continue throughout the plate until all wells are complete. Continue cutting into different plates or continue in the same plate until the striatal region is collected. Adapted from Biorender. Please click here to view a larger version of this figure.
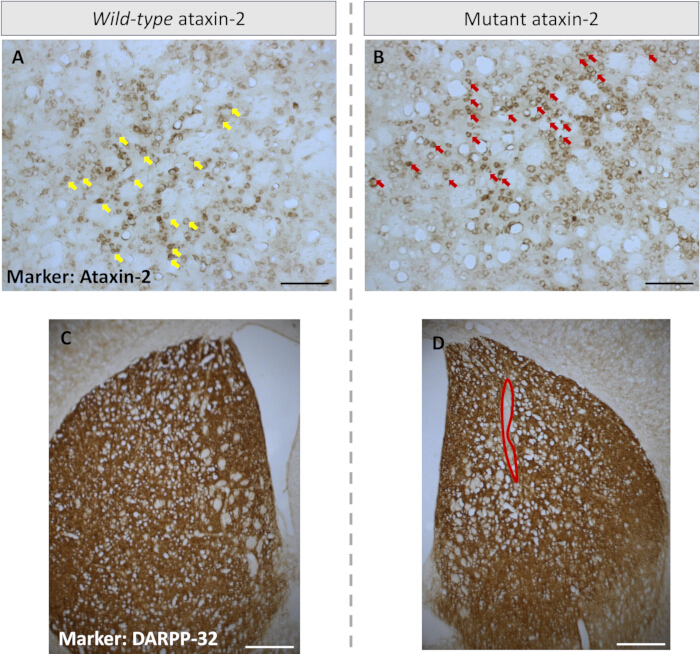
Figure 3: Lentiviral delivery of wild-type and mutant ataxin-2 into the striatum of C57BL/6J mice. (A) Representative coronal section of the left striatum injected with lentivirus encoding wild-type ataxin-2 (22Q) immunolabeled with anti-ataxin-2 antibody. (B) Representative coronal section of the right striatum injected with lentivirus encoding mutant ataxin-2 (104Q), immunolabeled with anti-ataxin-2 antibody. Wild-type ataxin-2 presented a diffuse cytoplasmic labeling (yellow arrows), while the mutant ataxin-2 formed dark cytoplasmic spherical aggregates (indicated by red arrows). 20x magnification, Scale bar = 100 µm. (C) Representative section of striatum expressing wild-type ataxin-2, immunolabeled with anti-DARPP-32 antibody to identify medium spiny neurons. (D) Representative section of striatum expressing mutant ataxin-2, immunolabeled with anti-DARPP-32 antibody. 20x magnification, Scale bar = 200 µm. Images are representative of at least three biological replicates. Please click here to view a larger version of this figure.
| Reagent | Amount/plate | Amount (20 plates) |
| PBS without Ca++ and Mg++, pH 7.0 | 120 µl | 2400 µl |
| pRSV-Rev (Addgene, plasmid #12253) | 549.6 ng | 10,991 ng |
| pCMV delta R8.2 (Addgene, plasmid #12263) | 2381.4 ng | 47,628 ng |
| pMD2.G (Addgene, plasmid #12259) | 687.0 ng | 13,740 ng |
| Transfer plasmid (your gene of interest) | 2381.4 ng | 47,628 ng |
| PEI (1 mg/mL) | 40 µl | 800 µl |
| DMEM (+10% FBS, +1% Pen-Strep) | up to 5 mL | up to 100 mL |
| Total | 5 mL | 100 mL |
Table 1: Transfection reagents for the generation of lentiviral vectors.
Supplementary Figure 1: Image upload. Example of an immunohistochemistry image uploaded into the IHCAggreCount software. The image is displayed in the Original Image panel before processing. Please click here to download this file.
Supplementary Figure 2: HiLo display. HiLo filter applied to enhance contrast between aggregates and background in IHCAggreCount. Please click here to download this file.
Supplementary Figure 3: Threshold mask. Brightness thresholding to separate aggregates from the background signal. Please click here to download this file.
Supplementary Figure 4: Size-based cleaning. Application of minimum size filtering to remove small particles (noise). Please click here to download this file.
Supplementary Figure 5: Roundness filtering. Exclusion of non-aggregate shapes based on the roundness parameter. Please click here to download this file.
Supplementary Figure 6: Aggregate calculation. Automatic detection and calculation of total aggregates and aggregate area. Please click here to download this file.
Supplementary Figure 7: Highlighted aggregates. Visualization of detected aggregates with highlighted outlines. Please click here to download this file.
Supplementary Figure 8: Smart Add tool. Example of the Smart Add function to detect additional aggregates in selected regions. Please click here to download this file.
Discussion
This article describes the generation of a striatal lentiviral mouse model for a polyQ SCA. It also describes the production of high-titer lentiviral vectors encoding the wild-type and expanded form of the causative protein, and the bilateral injection of the LVs into the mouse striatum by stereotaxic surgery. Additionally, it describes the brain collection procedure, the histological processing, and the image-based quantification of disease hallmarks. Together, these methods enable the creation of a lentiviral polyQ SCA mouse model showing protein aggregates and neuronal marker loss in the striatum, which can also be applied to other brain regions. Although the primary objective of this protocol is the characterization of neuropathological hallmarks as essential components for disease modelling20, behavioral alterations may arise depending on the targeted brain region17. The lentiviral-mediated expression of mutant Ataxin-2 in the striatum led to increased locomotor activity and anxiety-like behaviour in the open field test in mice injected with mutant Ataxin-2 compared to animals injected with wild-type Ataxin-2 or non-injected controls12. Importantly, this model is not intended to reproduce classical cerebellar ataxia, but rather to dissect region-specific pathological mechanisms associated with polyglutamine toxicity. In the same line, for a SCA3 lentiviral model13, the unilateral expression of mutant ataxin-3 in the substantia nigra of adult rats resulted in significant apomorphine-induced rotational asymmetry, reflecting nigrostriatal dysfunction rather than cerebellar impairment.
Several critical steps in this protocol are essential for ensuring reproducible outcomes. First, the quality of HEK293T cells during viral packaging is critical; using low-passage, mycoplasma-free cells (<10 passages) maximizes transfection efficiency and viral yield. Also critical is the integrity of plasmids, which must be carefully analyzed through restriction enzyme analysis. Also, avoid repeated freeze-thaw cycles of the lentiviral vectors produced, as it will reduce their titer. During stereotaxic surgery, accurate targeting of the striatum using coordinates referenced to Bregma and an infusion rate of ≤0.25 µL/min is essential to prevent tissue damage and off-target delivery. In the brain processing, successful perfusion with fresh and cold 4% PFA is necessary for optimal fixation and tissue preservation, while proper cryoprotection with sucrose avoids the formation of crystals that damage the tissue.
The most common problems can be troubleshooted with simple experiments and analysis. If high viral titers are not achieved, several steps can be done, such as optimization of PEI:DNA ratio, testing plasmid integrity by restriction enzyme analysis, and testing the functionality of lentiviral vectors by applying them to the cells. In the immunohistochemistry, high background staining can be reduced by increasing the blocking serum concentration or including additional washes with PBS containing 0.3% Triton X-100.
In the present study, LVs were selected primarily for practical considerations. The combined size of the full-length ATXN2 cDNA and the promoter used in this construct exceeds the optimal AAV packaging capacity. AAVs are also suitable for the development of local brain models for neurodegenerative diseases21,22, and have been used for the development of models for SCA323,24. In addition, LVs enable robust local expression following stereotaxic injection, and provide stable expression in dividing and non-dividing cells25, which is advantageous for region-specific modeling. However, the integration into the host genome mediated by lentivirus involves the risk of insertional mutagenesis26. The risk of insertional mutagenesis of third-generation self-inactivating lentiviral vectors is significantly reduced compared to earlier vectors, particularly when targeting non-dividing cells27.
Stereotaxic surgery is precise; however, not all the neurons in the target region will be transduced. Moreover, the levels of transgene expression will be different among transduced neurons. The striatal lentiviral model allows the analysis of neuropathology, and some patterns of behavior related to the local brain region. This lentiviral, region-specific expression approach is particularly powerful when rapid, hypothesis-driven experimentation is needed. As it can be implemented within weeks rather than months or years, it is well-suited for rapid screening of constructs or therapeutic candidates, as well as for testing region-specific interventions in defined brain regions17,28. It also offers a cost-effective platform for mechanistic studies, enabling controlled spatial and temporal manipulation of gene expression. However, when the research question centers on natural disease progression, multi-system pathology, or complex behavioral outcomes, alternative models (e.g., transgenic or knock-in SCA2 mouse models) with more physiological expression profiles are preferable29. Strategically, these approaches should be viewed as complementary rather than competing. Lentiviral models can serve as an efficient first-stage discovery and mechanistic platform, with key findings subsequently validated in models that better capture organism-level disease features. Additionally, DAB-based staining, while robust and permanent, limits multiplex labeling compared to fluorescence-based methods.
Regarding vector trafficking, lentiviral vectors are not known to undergo significant long-range diffusion or trans-synaptic spread after stereotaxic injection. Their distribution is generally restricted to the injection site, with limited local diffusion depending on injection volume and tissue properties8. Moreover, the lentiviral vectors used are replication-incompetent and present restricted diffusion8,30, which contributes to the low or even negligible probability of trafficking from one hemisphere to the contralateral side.
The described protocol integrates both classical histopathological staining and modern semi-automated image quantification, offering a balance between reproducibility and precision. While other tools provide 3D visualization, the combination of cryosectioning, DAB immunohistochemistry, and FIJI-based analysis is cost-effective and compatible with most neuroscience laboratories without requiring specialized imaging infrastructure.
In conclusion, this method is highly applicable to studying the potential of both therapeutic strategies and disease mechanisms in polyQ SCAs10,12,13,19. Besides these disorders, the lentiviral approach can be extended to other neurodegenerative diseases, enabling rapid preclinical testing of gene-targeted or pharmacological therapies. Additionally, the use of tools for image analysis, optimized for quantifying aggregates and neuronal marker loss, can be readily adapted to diverse applications in neuroscience research. Although this model is primarily designed to analyze neuropathological hallmarks rather than behavioral impairments, it can be effectively used in combination with complementary in vivo models to evaluate functional outcomes and improvements in key pathological features. In fact, several well-established SCA2 transgenic models exist that can provide important complementary insights31.
Disclosures
The authors declare no competing interests.
Acknowledgements
Clévio Nóbrega's laboratory is funded by the Cure CSB project, by the Viljem Julijan Association for Children with Rare Diseases (Slovenia), and by the Algarve Biomedical Center Research Institute (ABC-Ri). Some of the authors of this paper have a PhD fellowship funded by Fundação para a Ciência e Tecnologia (FCT), with the following references: Tiago Moreira-Gomes (2022.11008.BD), Inês T Afonso (2022.10161.BD), and Rafael G Costa (2022. 11973.BD).
Materials
| Name | Company | Catalog Number | Comments |
|---|---|---|---|
| 0.9% NaCl | Local supplier | — | Used for preparation of anesthesia and antagonist mixes |
| 100 mm tissue culture dishes | SPL Life Sciences | 11090 | |
| ABC kit (Avidin-Biotin Complex) | VECTASTAIN Elite | ||
| Atipamezole (5.0 mg/mL) | Local supplier | — | Antagonist of medetomidine |
| Benchtop centrifuge | - | - | |
| Biosafety cabinet, Class II (BSL-2 compliant) | - | - | |
| Biotinylated secondary antibody | - | - | |
| Bovine Serum Albumin (BSA) | NZYTech | MB47002 | |
| Brain sections (e.g., 30–40 µm coronal sections) immunostained for DARPP-32 | - | - | |
| Cell Counter plugin (FIJI) | Built-in / ImageJ | — | Tool for manual aggregate counting |
| CO2 incubator (37 °C, 5% CO2, humidified) | - | - | |
| Computer workstation | Local supplier | — | Used for image processing and software execution |
| Conical ultracentrifuge tubes | Beckman Coulter | 358126 | |
| Cotton swabs | Local supplier | — | Used for periosteum removal |
| Cryostat with specimen disk holder | - | - | |
| DAB (Diaminobenzidine) | - | - | |
| Digital stereotaxic coordinate reader | Stoelting/WPI | 51725 | Digital display for coordinate measurement |
| Dulbecco’s Modified Eagle Medium (DMEM, high glucose) | Gibco/Thermo Fisher | 11-965-092 | |
| Ethanol 70, 96 and 100% | - | - | |
| Ethanol, 70% | Local supplier | — | For scalp disinfection |
| Fentanyl (0.05 mg/mL) | Local supplier | — | Anesthetic component |
| Fetal Bovine Serum (FBS), heat-inactivated | Gibco/Thermo Fisher | 10500064 | |
| FIJI (ImageJ distribution) | NIH / ImageJ | https://fiji.sc/ | Open-source software for manual quantification of aggregates |
| Fine forceps (for toe pinch) | Local supplier | — | For anesthesia depth monitoring |
| Flumazenil (0.1 mg/mL) | Local supplier | — | Antagonist of midazolam |
| Forceps and scalpel | Local supplier | — | For periosteum removal and skull exposure |
| Hamilton 700/1700 Series Microliter/Gastight Syringes | Hamilton / Fisher Sci. | 7653-01/10550203 | For viral solution loading |
| Hamilton Small Hub Removable Needles (26G) | Hamilton / Fisher Sci. | 7804-03/ 10698205 | For viral delivery |
| Heating pad (for rodents) | Kent Scientific / SOMNI | e.g. 04-777-177 | For maintaining body temperature |
| HEK 293T cells (≤ passage 10, mycoplasma-free) | ATCC or equivalent | CRL-3216 | |
| Hydrogen peroxide | - | - | |
| IHCAggreCount software | Supplied upon demand | N/A | Proprietary in-house software for semi-automated detection and quantification of aggregates |
| Inverted microscope (for cell confluency) | - | - | |
| Laboratory vortex mixer | - | - | |
| Lentiviral vectors (WT and mutant) | In-house / Core facility | N/A | Viral solution for injection |
| L-glutamine (200 mM) | Gibco/Thermo Fisher | 25030081 | |
| Light microscope with camera (brightfield) | - | - | |
| Medetomidine (1.0 mg/mL) | Local supplier | — | Anesthetic component |
| Micro-drill (stereotaxic compatible) | Stoelting / Local supplier | — | For craniotomy |
| Microinjection pump (e.g., Stoelting) | Stoelting/WPI | 53210 | Automated infusion pump for viral injections |
| Micropipette (P1000, P200, P10) and tips | - | - | |
| Microscopy images (IHC sections) | Generated in-house | N/A | Immunohistochemistry images to be analyzed |
| Microtome blades (low-profile, disposable) | - | - | |
| Midazolam (5.0 mg/mL) | Local supplier | — | Anesthetic component |
| Mounting medium | - | - | |
| Naloxone (0.4 mg/mL) | Local supplier | — | Antagonist of fentanyl |
| Needle holder and fine dissecting needles | - | - | |
| Normal Goat Serum (NGS) | - | - | |
| O.C.T. compound | Tissue-Tek | ||
| Ophthalmic ointment (Bepanthen Eye and Nose Ointment, 5% Dexpanthenol) | Bayer | 11568-0053 | Prevents corneal drying during surgery |
| Orbital mixer | - | - | |
| p24 ELISA kit | ZeptoMetrix | 0801111 | |
| Parafilm | - | - | |
| Paraformaldehyde (PFA) | - | - | |
| PBS | - | - | |
| PBS without Ca2+/Mg2+, pH 7.0 | Gibco/Thermo Fisher | 10-010-031 | |
| pCMV-dR8.2 | Addgene | Plasmid #12263 | |
| Penicillin-Streptomycin (100×) | Gibco/Thermo Fisher | 15140122 | |
| Pentobarbital | - | - | |
| Phenylhydrazine | - | - | |
| pMD2.G | Addgene | Plasmid #12259 | |
| Polyethylenimine (PEI), 1 mg/mL | Polysciences | 23966 | |
| Primary antibody | - | - | |
| pRSV-Rev | Addgene | Plasmid #12253 | |
| qPCR Lentivirus Titration Kit | abm | LV900 | |
| Smooth brush or fire-polished glass Pasteur pipettes (rounded tip) | - | - | |
| Sodium azide | - | - | |
| Spatula (brain lifter) | - | - | |
| Stereotaxic frame (for mice) | Stoelting/WPI | 51730 | For accurate targeting of brain regions |
| Stericup 0.22 µm filter unit | MilliporeSigma | SCGPU02RE | |
| Sucrose | - | - | |
| Sutures (e.g., nylon 5-0) | Ethicon / Local supplier | 1664G | For wound closure |
| T75 and T175 cell culture flasks | SPL Life Sciences | 70075/71175 | |
| Transfer plasmid (gene of interest) | - | - | |
| Triton X-100 | - | - | |
| Ultracentrifuge with JS-24.38 rotor | Beckman Coulter | JS-24.38 | |
| Vortex mixer | - | - | |
| Water bath (37 °C) | - | - | |
| Xylene substitute | - | - |
References
- Afonso-Reis, R., Afonso, I. T., Nóbrega, C. Current Status of Gene Therapy Research in Polyglutamine Spinocerebellar Ataxias. Int J Mol Sci. 22 (8), 4249(2021).
- Durr, A. Autosomal dominant cerebellar ataxias: polyglutamine expansions and beyond. Lancet Neurol. 9 (9), 885-894 (2010).
- McIntosh, C. S., Li, D., Wilton, S. D., Aung-Htut, M. T. Polyglutamine Ataxias: Our Current Molecular Understanding and What the Future Holds for Antisense Therapies. Biomedicines. 9 (11), 1499(2021).
- Henriques, C., et al. Viral-based animal models in polyglutamine disorders. Brain. 147 (4), 1166-1189 (2024).
- Doyle, A., McGarry, M. P., Lee, N. A., Lee, J. J. The Construction of Transgenic and Gene Knockout/Knockin Mouse Models of Human Disease. Transg Res. 21 (2), 327-349 (2012).
- Tello, J. A., Williams, H. E., Eppler, R. M., Steinhilb, M. L., Khanna, M. Animal Models of Neurodegenerative Disease: Recent Advances in Fly Highlight Innovative Approaches to Drug Discovery. Front Mol Neurosci. 15, 883358(2022).
- Moreira-Gomes, T., Nóbrega, C. Development of a gene therapy with lentiviral vectors for spinocerebellar ataxias. Methods Mol Biol. 2974, 215-225 (2026).
- Parr-Brownlie, L. C., et al. Lentiviral vectors as tools to understand central nervous system biology in mammalian model organisms. Front Mol Neurosci. 8, 14(2015).
- Zwi-Dantsis, L., Mohamed, S., Massaro, G., Moeendarbary, E. Adeno-Associated Virus Vectors: Principles, Practices, and Prospects in Gene Therapy. Viruses. 17 (2), 239(2025).
- Moreira-Gomes, T., Nóbrega, C. From the disruption of RNA metabolism to the targeting of RNA-binding proteins: The case of polyglutamine spinocerebellar ataxias. J Neurochem. 168 (8), 1442-1459 (2024).
- Matsuzaki, Y., Oue, M., Hirai, H. Generation of a neurodegenerative disease mouse model using lentiviral vectors carrying an enhanced synapsin I promoter. J Neurosci Meth. 223, 133-143 (2014).
- Marcelo, A., et al. Autophagy in Spinocerebellar ataxia type 2, a dysregulated pathway, and a target for therapy. Cell Death Dis. 12 (12), 1117(2021).
- Alves, S., et al. Striatal and nigral pathology in a lentiviral rat model of Machado-Joseph disease. Human Mol Genet. 17 (14), 2071-2083 (2008).
- Alves, S., et al. Lentiviral vector-mediated overexpression of mutant ataxin-7 recapitulates SCA7 pathology and promotes accumulation of the FUS/TLS and MBNL1 RNA-binding proteins. Mol Neurodegenerat. 11 (1), 58(2016).
- Geraerts, M., Willems, S., Baekelandt, V., Debyser, Z., Gijsbers, R. Comparison of lentiviral vector titration methods. BMC Biotechnol. 6 (1), 34(2006).
- Arrasate, A., et al. Establishment and Characterization of a Stable Producer Cell Line Generation Platform for the Manufacturing of Clinical-Grade Lentiviral Vectors. Biomedicines. 12 (10), 2265(2024).
- Nóbrega, C., et al. Overexpression of Mutant Ataxin-3 in Mouse Cerebellum Induces Ataxia and Cerebellar Neuropathology. Cerebellum. 12 (4), 441-455 (2013).
- Paxinos, G., Franklin, K. B. J. The Mouse Brain in Stereotaxic Coordinates. , Compact Second Edition, Gulf Professional Publishing. (2004).
- Bateup, H. S., et al. Distinct subclasses of medium spiny neurons differentially regulate striatal motor behaviors. Proc Natl Acad Sci U S A. 107 (33), 14845-14850 (2010).
- Nóbrega, C., et al. Molecular hallmarks of neurodegeneration in polyglutamine spinocerebellar ataxias. Cell Death Dis. 16 (1), 826(2025).
- Murakami, Y., et al. AAV-based gene therapy ameliorated CNS-specific GPI defect in mouse models. Mol Ther Meth Clin Dev. 32 (1), 101176(2024).
- Wada, H., et al. AAV-based gene therapy ameliorates neurological deficits in a mouse model of childhood-onset neurodegeneration with cerebellar atrophy. Mol Ther J Am Soc Gene Ther. 33 (11), 5829-5839 (2025).
- Konno, A., Shinohara, Y., Hirai, H. Production of Spinocerebellar Ataxia Type 3 Model Mice by Intravenous Injection of AAV-PHP.B Vectors. Int J Mol Sci. 25 (13), 7205(2024).
- Jansen-West, K., et al. Plasma PolyQ-ATXN3 Levels Associate With Cerebellar Degeneration and Behavioral Abnormalities in a New AAV-Based SCA3 Mouse Model. Front Cell Dev Biol. 10, 863089(2022).
- Nóbrega, C., Mendonça, L., Matos, C. A. A Handbook of Gene and Cell Therapy. , Springer International Publishing. Cham. (2020).
- Thomas, C. E., Ehrhardt, A., Kay, M. A. Progress and problems with the use of viral vectors for gene therapy. Nat Rev Genet. 4 (5), 346-358 (2003).
- Schambach, A., Zychlinski, D., Ehrnstroem, B., Baum, C. Biosafety Features of Lentiviral Vectors. Human Gene Ther. 24 (2), 132-142 (2013).
- de Almeida, L. P., Ross, C. A., Zala, D., Aebischer, P., Déglon, N. Lentiviral-Mediated Delivery of Mutant Huntingtin in the Striatum of Rats Induces a Selective Neuropathology Modulated by Polyglutamine Repeat Size, Huntingtin Expression Levels, and Protein Length. J Neurosci. 22 (9), 3473-3483 (2002).
- Fisher, E. M. C., Bannerman, D. M. Mouse models of neurodegeneration: Know your question, know your mouse. Sci Transl Med. 11 (493), eaaq1818(2019).
- Bii, V. M., Collins, C. P., Hocum, J. D., Trobridge, G. D. Replication-incompetent gammaretroviral and lentiviral vector-based insertional mutagenesis screens identify prostate cancer progression genes. Oncotarget. 9 (21), 15451-15463 (2018).
- Alves-Cruzeiro, J. M. D. C., Mendonça, L., Pereira de Almeida, L., Nóbrega, C. Motor Dysfunctions and Neuropathology in Mouse Models of Spinocerebellar Ataxia Type 2: A Comprehensive Review. Front Neurosci. 10, 572(2016).
Reprints and Permissions
