Here, a standardized protocol to visualize tunneling nanotubes between human epidermal keratinocytes and dermal fibroblasts using membrane and F-actin labeling with z-stack confocal imaging is shown, with optional α-tubulin co-staining, enabling reproducible detection and cytoskeletal characterization for tissue-engineering applications.
Method Article
Standardized Method to Detect Tunneling Nanotubes in Human Skin Cells for Tissue Engineering Applications
In This Article
Summary
Abstract
Tunneling nanotubes (TNTs) are thin, actin-based intercellular conduits that enable long-range transfer of organelles and signaling cargo. Although widely reported across multiple cell types, their presence in human skin cells has not been well described. This article describes a standardized protocol to detect and characterize TNTs in vitro between human epidermal keratinocytes and dermal fibroblasts. The method involves preparing a co-culture of primary cells, gentle fixation to preserve fragile TNTs, membrane labeling with wheat germ agglutinin, F-actin staining with phalloidin, and systematic z-stack imaging by inverted confocal microscopy to distinguish TNTs suspended above the substratum from adherent filopodia. Optional immunostaining for α-tubulin allows assessment of microtubule incorporation. TNTs are defined by three features: thin, straight protrusions connecting two or more cells, the presence of F-actin, and continuity across cell pairs in serial optical sections. Representative results demonstrate TNTs linking dermal-dermal, epidermal-epidermal, and dermal-epidermal pairs, with variable cytoskeletal composition (F-actin alone or F-actin plus α-tubulin). Critical steps include gentle fixation, use of fresh reagents, and acquisition of sufficient z-planes to avoid misclassification, while common artifacts include TNT breakage and incomplete staining. Together, these optimized steps enable reproducible TNT detection in skin cell systems and offer a methodological basis for future investigation of TNT-mediated communication in skin biology and regeneration.
Introduction
Tunneling nanotubes (TNTs) are nanoscale, actin-based channels that enable direct intercellular transfer of organelles and signaling molecules. They are typically 6-100 µm in length and 50-500 nm in diameter, with some reaching up to 700nm thick1. Unlike empty membrane protrusions, TNTs contain cytoskeletal filaments, most commonly F-actin, which provides structural rigidity and supports mitochondrial transport2,3,4. In two-dimensional culture, TNTs are defined by three features: thin (20-700 nm), straight protrusions suspended above the substratum that connect two or more cells; the presence of F-actin filaments; and the ability to transfer cargo.
Since their first identification in PC-12 cells by Rustom et al.5, TNTs have been studied in multiple systems, including the cardiovascular6, immune7, and respiratory8 systems, corneal epithelium9, tumors10, and the nervous system11,12. They contribute to physiological and pathological processes such as immune signaling, apoptosis, material transport, and angiogenesis13,14,15. TNTs can mediate long-range transfer of diverse cargos, including mitochondria, endoplasmic reticulum, nucleic acids, ions, and even viruses5,16,17.
The skin is a structurally complex organ, with the epidermis and dermis relying on constant communication for homeostasis, wound healing, and appendage regeneration18,19,20. Although TNTs have been described in many tissues, including the immune system, the neuronal system, and the corneal epithelium7,9,12, their presence in human skin cells has not been reported in the published literature. Building on the methodological framework described by Sáenz-de-Santa-María et al.21, we present a standardized and optimized protocol for detecting TNTs between epidermal keratinocytes and dermal fibroblasts22 using immunofluorescence staining combined with inverted confocal microscopy.
Compared with alternative TNT-detection approaches, this protocol offers a practical balance between sensitivity and accessibility. Live-cell imaging can capture TNT dynamics but is limited by phototoxicity and the short-lived nature of TNTs1,23. Electron microscopy provides ultrastructural detail yet often fails to preserve long TNT spans and is not practical for routine analysis of primary skin cells24,25. Reporter-based nanotube systems enable real-time tracking but require genetic manipulation, which is typically inefficient in primary keratinocytes and fibroblasts24,26. In contrast, the present protocol uses standard immunofluorescence and confocal microscopy, allowing reproducible TNT detection across independently prepared skin cell cultures while maintaining compatibility with fragile primary cells.
This method is particularly suitable for fixed-sample analysis where cytoskeletal composition and TNT prevalence are of interest. As TNTs are highly fragile, fixation and handling steps remain key limitations, and the approach cannot capture real-time TNT dynamics. Nevertheless, for laboratories working with primary human skin cells, this standardized workflow provides an accessible and consistent way to visualize TNTs and supports downstream studies of their potential functions in tissue engineering and regeneration.
Protocol
All skin cells used in this study were previously frozen primary cells isolated from human skin tissues obtained as discarded foreskin samples from circumcision procedures, and were fully de-identified22. The acquisition of human skin samples was conducted at the Department of Urology, Ningbo University Affiliated People's Hospital, and the study protocol was approved by the institutional ethics committee (Protocol No. 2024104; approval date: October 30, 2024).
1. Identification of TNTs in human primary skin epidermal keratinocytes and dermal fibroblasts
- Solution preparation
- Prepare fixative solution 1 (200 µL) by adding 4% PFA (100 µL), 2.5% glutaraldehyde (4 µL), 1 M HEPES (40 µL), and 1x PBS (56 µL). Prepare fresh and prewarm to 37 °C before use.
- Prepare fixative solution 2 (200 µL) by adding 8% PFA (100 µL), 1 M HEPES (0.4 µL), 1x PBS (99.6 µL). Prepare fresh and prewarm to 37 °C before use.
- Prepare fixative solution 3 (200 µL) by adding 8% PFA (100 µL), 2.5% glutaraldehyde (4 µL), 1x PBS (96 µL). Prepare fresh and prewarm to 37 °C before use.
- Cell culture
- Thaw and culture human epidermal keratinocytes and dermal fibroblasts in 60 mm dishes using the appropriate growth medium. Supplement keratinocyte cultures with Y-27632 at a final concentration of 5 µM during resuscitation. Maintain cultures at 37 °C in a humidified incubator until cells reach ~80% confluency.
- Remove the medium and briefly wash the cells with 1 mL of 1x PBS (used to maintain physiological pH and osmolarity during washing). Aspirate the PBS.
- Add 1 mL of 0.05% trypsin-EDTA, distribute evenly, and incubate at 37 °C for 1.5-2.5 min.
- Gently resuspend cells by pipetting. Add 2 mL of growth medium, transfer to a 15 mL tube, and centrifuge at 200 x g for 5 min at room temperature.
- Discard the supernatant and resuspend the pellet in 1-2 mL of medium. Count cells using an automated counter.
- Seed 12,000 dermal fibroblasts or 20,000 keratinocytes in each well of an 8-well chamber slide in a final volume of 400 µL. After seeding, cross-shake the chamber well to distribute the cells evenly. Incubate for ~24 h at 37 °C.
- Following approximately 24 h of incubation, observe the cell confluence under a microscope. If it reaches ~80%, proceed to the subsequent fixation steps.
- Fixation
- When cultures reach ~80% confluency, gently add several drops of Fixative Solution 1 directly to the chamber well to pre-fix the cells. Incubate for 4 min at room temperature. Ensure the fixative spreads evenly without disturbing the cells.
CAUTION: Handle carefully to avoid disruption of TNTs. Because the fixative solutions contain toxic components like PFA and glutaraldehyde, always wear protective gloves, protective clothing, and a mask, and handle them in a fume hood. Be sure to wash hands thoroughly afterwards. Collect PFA and glutaraldehyde fixative waste separately in labeled containers for hazardous chemical disposal. - Aspirate the pre-fixative and replace it with 140 µL of fresh Fixative Solution 1, ensuring the entire well is covered. Incubate for 15 min at 37 °C.
- Remove Fixative Solution 1 and add 140 µL of Fixative Solution 2. Incubate for 15 min at 37 °C. Make sure the solution fully covers the cells to maintain uniform fixation.
- Remove the fixative, then add 140 µL of 100 mM NH₄Cl to quench residual aldehydes. Incubate for 10-30 min at room temperature.
- Rinse the samples 3x with 1x PBS for 30 s each at room temperature, pipetting gently along the chamber wall to avoid washing away cells or breaking TNTs.
- When cultures reach ~80% confluency, gently add several drops of Fixative Solution 1 directly to the chamber well to pre-fix the cells. Incubate for 4 min at room temperature. Ensure the fixative spreads evenly without disturbing the cells.
- Membrane and cytoskeletal staining
- Incubate cells with 140 µL of 1:300 (v/v) WGA (Wheat Germ Agglutinin)-Alexa Fluor conjugate, which labels plasma membrane glycoproteins for visualization of membrane-derived TNTs, in 1x PBS for 20 min in the dark at room temperature.
NOTE: The subsequent steps need to be carried out in a dark environment. - Wash 3x with 1x PBS (30 s each). Incubate with 140 µL of phalloidin conjugate diluted 1:250 (v/v) in 1% BSA for 30 min in the dark at room temperature.
- Wash 3x with 1x PBS (30 s each). Incubate with 140 µL of DAPI solution for 5 min at room temperature in the dark.
- Wash 3x with 1× PBS. Add 2-3 drops of mounting medium, incubate for 20 min at room temperature, and store at least 20 min at 4 °C in the dark until imaging.
- Incubate cells with 140 µL of 1:300 (v/v) WGA (Wheat Germ Agglutinin)-Alexa Fluor conjugate, which labels plasma membrane glycoproteins for visualization of membrane-derived TNTs, in 1x PBS for 20 min in the dark at room temperature.
- Imaging
- Acquire images using an inverted confocal microscope with a 40x objective. Select random fields and collect Z-stacks (10-20 layers) from the bottom to the top of the cells. The specific microscope parameters used for image acquisition are listed below:
Confocal laser scanning microscope: ZEISS LSM 900
Laser lines: Track 1 (561 nm, 4.0%), Track 2 (488 nm, 16.0%), Track 3 (405 nm, 60.0%)
Detector gain: 525 V
Z-step size: 20 optical sections (total depth: 5.32 µm)
- Acquire images using an inverted confocal microscope with a 40x objective. Select random fields and collect Z-stacks (10-20 layers) from the bottom to the top of the cells. The specific microscope parameters used for image acquisition are listed below:
2. Co-culture of epidermal and dermal cells
- Prepare keratinocytes and fibroblasts as in steps 1.2.1-1.2.5.
- Seed 10,000 keratinocytes and 6,000 fibroblasts per chamber well in 400 µL of medium. After seeding, cross-shake the chamber well to distribute the cells evenly. Incubate for 24 h at 37 °C.
- Following approximately 24 h of incubation, observe the cell confluence under a microscope. If it reaches ~80%, proceed to the subsequent fixation steps.
- Fix and stain membranes as described in steps 1.3-1.4.
- Permeabilize cells with 0.1% Triton X-100, to allow antibody access to intracellular targets, for 3 min at room temperature, then wash 3x with 1x PBS.
NOTE: 0.1% Triton X-100 should be freshly prepared before use.
CAUTION: Triton X-100, harmful to aquatic life, must also be disposed of as chemical waste and never poured down the drain. - Block with 140 µL of 2% BSA in PBS to reduce non-specific antibody binding for 20 min at room temperature.
NOTE: 2% BSA should be freshly prepared before use. - Incubate overnight at 4 °C with anti-cytokeratin 5 antibody diluted 1:200 (v/v) in 2% BSA.
- Wash 3x with 1x PBS, then incubate with Alexa Fluor 594-conjugated secondary antibody for 1-2 h at room temperature in the dark.
- Wash 3x with 1× PBS. Stain nuclei with DAPI and image as in steps 1.4.5-1.5.2.
3. Identification of cytoskeletal components of TNTs
- Cell culture
- Culture and fix cells as in steps 1.2-1.3. Permeabilize with 0.1% Triton X-100 for 3 min at room temperature, then wash with 1x PBS.
- Block with 2% BSA for 20 min at room temperature. Incubate overnight at 4 °C with anti-α-tubulin antibody.
- Wash 3x with 1x PBS and incubate with Alexa Fluor-conjugated secondary antibody for 1-2 h at room temperature in the dark.
NOTE: The subsequent steps need to be carried out in a dark environment. - Wash 3x with 1x PBS. Label F-actin with phalloidin and image as in steps 1.4.3-1.5
- Co-culturing of cells
- Prepare co-cultures as in steps 2.1-2.2. Fix with fixative solution 3 for 15 min at room temperature.
- Replace with 140 µL of 100 mM NH4Cl and incubate for 10-30 min at room temperature. Wash 3x with 1x PBS.
- First, identify epidermal cells by performing permeabilization, blocking, and CK5 immunostaining exactly as described in steps 2.4-2.8.
- Next, perform α-tubulin immunostaining following steps 3.1.2-3.1.4.
- Finally, stain F-actin with phalloidin and proceed with imaging as described in steps 1.4.2-1.5.2.
Results
Using this standardized protocol, tunneling nanotubes (TNTs) were successfully identified in human skin cells under both single-culture and co-culture conditions. To validate antibody specificity, both positive and negative control staining were performed for all antibodies prior to the experimental analyses, as shown in Supplementary Figure 1, Supplementary Figure 2, Supplementary Figure 3, and Supplementary Figure 4. Representative images demonstrate the reproducible detection of TNTs as thin, actin-containing channels connecting cells.
Detection of TNTs in single-cell populations
In dermal fibroblast cultures, TNTs were observed as long, thin projections bridging adjacent cells. Membrane staining with WGA (green) and F-actin labeling with phalloidin (red) confirmed their identity, with TNTs suspended above the substratum and highlighted by yellow arrowheads (Figure 1). To further distinguish TNTs from substrate-attached filopodia and improve reproducibility, a three-dimensional (3D) reconstruction was generated from z-stack images (Supplementary Figure 5). Similarly, in epidermal keratinocyte cultures, comparable TNT structures were observed, showing characteristic F-actin-positive protrusions connecting neighboring cells (Figure 2).
For quantitative assessment, TNTs were counted across representative imaging fields. On average, approximately 0.52 TNTs per dermal fibroblast and 0.21 TNTs per epidermal keratinocyte were detected. These findings provide evidence of TNT formation in both dermal and epidermal skin cell populations.
TNTs between dermal fibroblasts and epidermal keratinocytes
When fibroblasts and keratinocytes were co-cultured, TNTs were also identified between the two cell types. Dual labeling with WGA (green) for cell membranes and cytokeratin 5 (CK5, red) for epidermal cells enabled the clear distinction of cell types within co-cultures. TNTs were consistently detected spanning fibroblasts and keratinocytes, indicating that TNTs mediate heterotypic cell-to-cell communication in human skin (Figure 3).
Cytoskeletal components of TNT
Further characterization revealed heterogeneity in the cytoskeletal composition of TNTs. In dermal fibroblasts, TNTs contained only F-actin (Figure 4A), both F-actin and α-tubulin (Figure 4B), or partial α-tubulin labeling (Figure 4C). Similarly, in epidermal keratinocytes, TNTs were observed with only F-actin (Figure 5A), with both cytoskeletal components (Figure 5B), or with low levels of α-tubulin (Figure 5C). Heterotypic TNTs connecting dermal fibroblasts and epidermal keratinocytes also showed variable composition, including F-actin-only structures (Figure 6A), TNTs containing both filaments (Figure 6B), partial α-tubulin incorporation (Figure 6C), or low α-tubulin levels (Figure 6D). Together, these findings indicate that TNTs in skin cells are primarily supported by F-actin but can also recruit microtubules, suggesting functional diversity in cargo transport and structural stability.
Representative outcomes, success criteria, and troubleshooting
Across multiple experimental repeats, TNTs were consistently observed in ~70%-80% of confluent cultures under optimized fixation and staining conditions. A successful experiment should show clearly identifiable TNTs in the majority of fields (~70-80%), with continuous F-actin-positive protrusions that span between cells and remain suspended above the substratum. Fail criteria include widespread TNT truncation, discontinuous F-actin signal, or the inability to distinguish TNTs from filopodia.
Disruption of TNTs occurred if fixation steps were performed too harshly, highlighting the importance of gentle handling. TNT breakage was most commonly associated with rapid aspiration or pipetting, over-fixation, or abrupt washing steps. Incomplete or patchy staining was typically linked to insufficient permeabilization, expired reagents, or inadequate antibody incubation time. Correct identification required Z-stack imaging to distinguish TNTs from filopodia or substrate-adherent protrusions. Representative positive outcomes include TNTs clearly suspended above the substratum and double-positive staining for both membrane and F-actin (Figure 1, Figure 2, Figure 3). Suboptimal outcomes include partial staining loss or TNT breakage, which typically result in truncated or ambiguous structures.
Together, these results confirm that this protocol enables reproducible visualization of TNTs in human dermal fibroblasts, epidermal keratinocytes, and across dermal-epidermal interactions, while also allowing assessment of their cytoskeletal organization. This standardized approach provides a methodological basis for studying TNT-mediated intercellular communication in skin biology and tissue engineering applications.
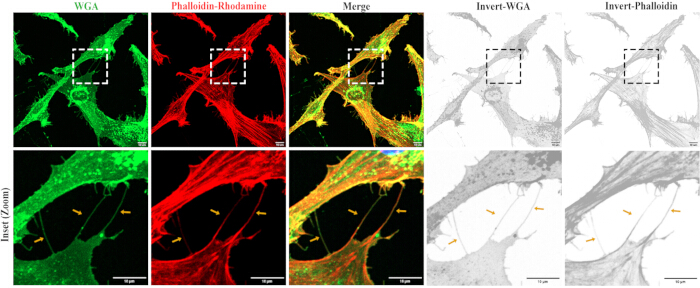
Figure 1: Tunneling nanotubes between dermal fibroblasts. Dermal cells were stained with WGA (green) for membranes and phalloidin (red) for F-actin. The upper panels display the individual fluorescence channels, their merged image, and an inverted monochrome view of the WGA and Phalloidin image. The lower panel shows a magnified view of the boxed region in the upper panel. Yellow arrowheads indicate TNTs. Scale bar = 10 µm. Please click here to view a larger version of this figure.
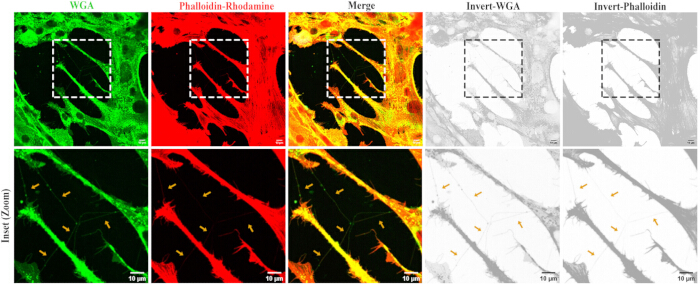
Figure 2: Tunneling nanotubes between epidermal keratinocytes. Epidermal cells were stained with WGA (green) for membranes and phalloidin (red) for F-actin. The upper panels display the individual fluorescence channels, their merged image, and an inverted monochrome view of the WGA and Phalloidin image. The lower panel shows a magnified view of the boxed region in the upper panel. Yellow arrowheads indicate TNTs. Scale bar = 10 µm. Please click here to view a larger version of this figure.
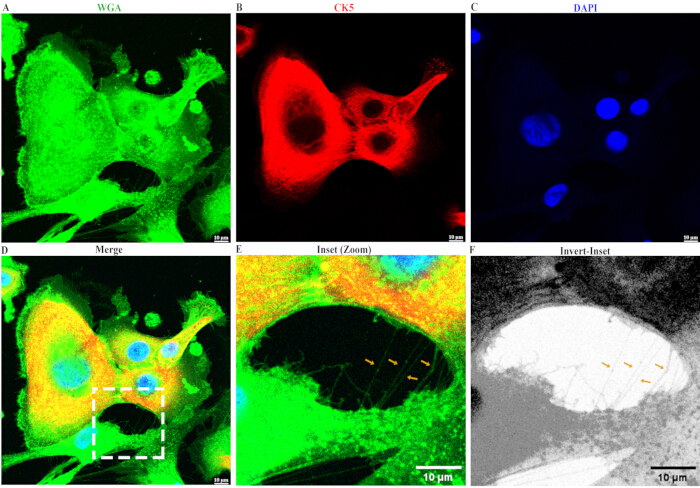
Figure 3: Tunneling nanotubes between dermal fibroblasts and epidermal keratinocytes. (A-C) Individual fluorescence channels showing cells stained with WGA (green, membrane) and epidermal cells stained for CK5 (red). Nuclei are counterstained with DAPI (blue). (D) Merged image of channels A-C. (E) Magnified view (inset) of the boxed region in D, highlighting cellular TNTs. (F) Inverted monochrome view of the inset shown in E. Yellow arrowheads in E, F indicate representative TNTs. Scale bars = 10 µm. Please click here to view a larger version of this figure.
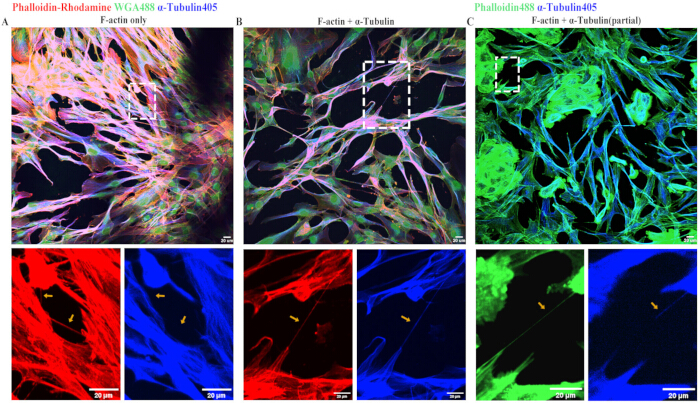
Figure 4: Cytoskeletal composition of TNTs in dermal fibroblasts. (A) TNT containing only F-actin (phalloidin, red). (B) TNT containing both F-actin (red) and α-tubulin (blue). (C) TNT partially containing α-tubulin (blue). Membranes were stained with WGA (green) in (A, B). Yellow arrowheads indicate TNTs. Scale bar = 20 µm. Please click here to view a larger version of this figure.
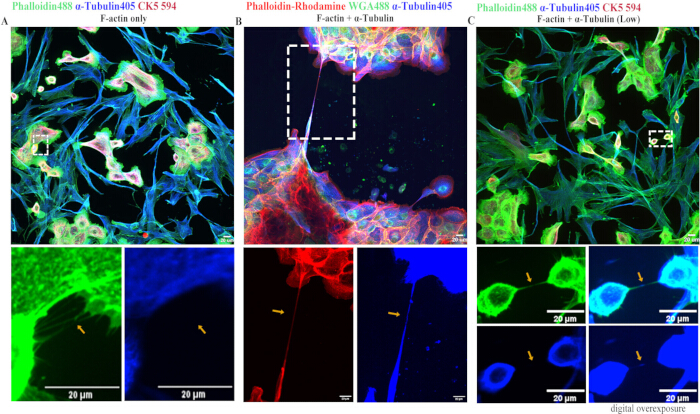
Figure 5: Cytoskeletal composition of TNTs in epidermal keratinocytes. (A) TNT containing only F-actin (green). (B) TNT containing both F-actin (red) and α-tubulin (blue). (C) TNT containing a low level of α-tubulin (blue) in CK5+ epidermal cells (red). Membranes were stained with WGA (green) in (B). Yellow arrowheads indicate TNTs. Scale bar = 20 µm. Please click here to view a larger version of this figure.
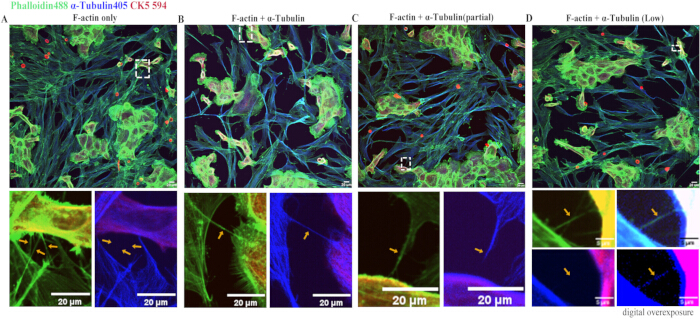
Figure 6: Cytoskeletal composition of TNTs between dermal fibroblasts and epidermal keratinocytes. (A) TNT containing only F-actin (green). (B) TNT containing both F-actin (green) and α-tubulin (blue). (C) TNT partially containing α-Tubulin (blue). (D) TNT containing low levels of α-tubulin (blue). Epidermal cells were stained with CK5 (red). Yellow arrowheads indicate TNTs. Scale bar = 20 µm (main), 20 µm (A-C, inset), 5 µm (D, inset). Please click here to view a larger version of this figure.
Supplementary Figure 1: Specificity validation of CK5 staining. Specificity validation of cytokeratin 5 (CK5) immunostaining as an epidermal cell marker. A positive control (anti-CK5 primary antibody followed by secondary antibody) is shown alongside negative controls, including antibody diluent only (2% BSA in PBS), primary antibody only, and secondary antibody only. For each condition, CK5 staining (red), nuclear staining with DAPI (blue), and merged images are shown. Scale bar = 50 µm. Please click here to download this File.
Supplementary Figure 2: Specificity validation of α-tubulin staining. A positive control (anti-α-tubulin primary antibody followed by secondary antibody) is shown together with negative controls, including antibody diluent only (2% BSA in PBS), primary antibody only, and secondary antibody only. For each condition, α-tubulin staining (red), DAPI (blue), and merged images are displayed. Scale bar = 50 µm. Please click here to download this File.
Supplementary Figure 3: Specificity validation of F-actin staining. Specificity validation of F-actin staining using phalloidin conjugates. (A) Phalloidin-488 (green) and (B) Phalloidin-Rhodamine (red) were tested using a positive control (anti-F-actin antibody) and a negative control (1% BSA in PBS diluent only). For each panel, the Phalloidin channel, DAPI (blue), and merged images are shown. Scale bar = 50 µm. Please click here to download this File.
Supplementary Figure 4: Specificity validation of plasma membrane staining with wheat germ agglutinin (WGA). WGA staining (green) was evaluated using a positive control (WGA-Alexa Fluor 488) and a negative control (1x PBS diluent only). For each condition, the WGA channel, DAPI (blue), and merged images are shown. Scale bar = 50 µm. Please click here to download this File.
Supplementary Figure 5: WGA staining distinguishes TNTs from adherent filopodia in dermal cells. WGA staining reveals distinct spatial localization of tunneling nanotubes (TNTs) and adherent filopodia in dermal fibroblasts. (A) Wide-field view of dermal cells stained with WGA to visualize the plasma membrane. The boxed region indicates the area shown at higher magnification. (B) Magnified view of the boxed region in (A). Red arrows indicate TNTs connecting adjacent cells, whereas blue arrows indicate substrate-adherent filopodia. (C) Inverted grayscale view of the magnified region shown in (B). (D) Three-dimensional reconstruction from the z-stack dataset showing an xz-plane side view of the cell base. Adherent filopodia (blue arrows) are localized at the basal plane, while the TNT (red arrow) projects above the substratum from a mid-cellular plane. Scale bars = 10 µm. Please click here to download this File.
Discussion
A critical step in this protocol is the preservation of TNTs during fixation and staining, as these structures are extremely fragile and easily disrupted. Gentle handling during fixation, appropriate timing, and the use of fresh fixatives are essential to maintain TNT integrity. The use of Z-stack confocal imaging is equally important to distinguish TNTs suspended above the substratum from filopodia or other adherent protrusions, which may otherwise lead to misinterpretation. These considerations underscore the need for standardized procedures to achieve reproducible TNT visualization across laboratories, particularly in skin cells, which exhibit strong substrate adhesion and prominent actin-based protrusions that can complicate TNT identification.
The fixation protocol is designed with three distinct solutions to meet different experimental needs, achieving a balance between fine structural preservation and antigenicity. Its core principle is to prioritize the quality of key staining targets by adjusting the composition and steps. Fixative Solution 1 contains 2% PFA, 0.05% glutaraldehyde, and HEPES buffer, which stabilizes pH during fixation to preserve membrane integrity. It is used for gentle pre-fixation. The low concentration of PFA mildly stabilizes overall cell morphology, while the very low concentration of glutaraldehyde reinforces membrane-associated structures, preserving binding sites for probes such as WGA. Skipping this step may result in membrane damage and unclear WGA staining. Fixative Solution 2 contains 4% PFA and HEPES buffer. It serves as the main fixative, ensuring sufficient crosslinking while maintaining antigenicity. Fixative Solution 3 contains 4% PFA and 0.05% glutaraldehyde and offers enhanced preservation of cytoskeletal structures, with acceptable antigen retention after permeabilization.
When staining with WGA, a sequential application of Solutions 1 and 2 preserves membrane structure while providing complete fixation. When membrane staining is not required, Solution 3 alone is appropriate and simplifies the workflow. In summary, this fixation protocol provides clear, practical decision points for users depending on experimental goals, prioritizing membrane staining quality or streamlined cytoskeletal labeling as needed.
Potential problems encountered during this protocol, along with their solutions, are outlined below. Cells may be unevenly distributed within the chamber. Since cell density affects TNT formation, even seeding is essential. Recommended steps include pre-adding medium, gently cross-mixing after seeding, and confirming distribution under a microscope. Background or non-specific staining may occur. Lower antibody concentrations, minimal mounting medium, appropriate gain settings, and proper antibody-species compatibility improve signal quality. Fluorescence quenching is common during imaging; reducing laser intensity whenever possible minimizes signal loss. These practical measures provide users with direct, actionable guidance to avoid common pitfalls.
Compared with live-cell imaging1,23, electron microscopy24,25, and reporter-based TNT systems26, this protocol offers a practical balance between accessibility and reproducibility, particularly for primary human skin cells. While each alternative method has strengths, this approach is better suited for fixed-sample analysis where TNT integrity, cytoskeletal composition, and consistency across replicates are required.
Despite its reliability, the method has some limitations. TNT detection is restricted to in vitro conditions and relies on imaging fixed samples, which may not fully capture their dynamic behavior. Live-cell imaging with fluorescent reporters or membrane trackers would provide additional insights into TNT formation and function, but these approaches require specialized imaging systems and may introduce phototoxicity. Future studies may explore in vivo or ex vivo approaches, such as intravital microscopy or tissue-clearing-based imaging, to investigate TNT-like structures within skin tissues, although significant technical challenges remain. Moreover, while this protocol confirms the presence of cytoskeletal elements such as F-actin and α-tubulin, it does not yet resolve whether distinct TNT subtypes in skin cells perform specialized transport functions, as reported in immune and neuronal systems7,12,13.
An advantage of this protocol is the consistent fixation and staining sequence, which helps preserve TNT structure -- a step that often fails in less standardized methods. Clear guidance on fixation order, temperature, and gentle handling improves repeatability between experiments. This is particularly important for skin cells, which are flattened, highly adherent, and prone to form filopodia-like structures that can be mistaken for TNTs without careful z-stack analysis. The method is also well-suited to primary human skin cells, which are difficult to genetically modify, making it more practical than reporter-based or live-cell labeling approaches. The combination of membrane labeling and Z-stack imaging provides a reliable means to distinguish TNTs from filopodia, a common source of misidentification.
The ability to detect TNTs in both dermal fibroblasts and epidermal keratinocytes, as well as across these cell types, has significant implications for skin biology and tissue engineering. Epidermal-dermal communication regulates key processes, including wound healing, angiogenesis, and hair follicle regeneration18,19,20. In the context of tissue engineering, TNTs may contribute to intercellular coordination during skin reconstruction, graft integration, or response to biomaterial scaffolds. TNT-mediated transfer of organelles, proteins, or signaling molecules may represent a previously unrecognized mechanism in these contexts. Standardizing a reproducible protocol for TNT visualization thus provides a foundation for future studies into their roles in skin homeostasis, pathological remodeling, and potential therapeutic manipulation. By enabling systematic TNT analysis, this protocol may facilitate future studies linking TNT formation to functional outcomes in regenerative skin models. By enabling reproducible detection, this method expands the toolkit available for studying intercellular communication in complex tissue environments.
Disclosures
The authors have no competing financial interests to declare.
Acknowledgements
This project was funded by the National Natural Science Foundation of China (Grant No. 82273554). The authors acknowledge the Biomaterials and Tissue Regeneration Engineering Laboratory at Ningbo Stomatology Hospital for continuous support and thank both current and past team members for their valuable discussions. The authors also thank Teacher Feng Li from the Research and Experiment Center of Hangzhou Medical College for generous assistance and strong support in facilitating access to the confocal microscope.
Materials
| Name | Company | Catalog Number | Comments |
|---|---|---|---|
| 15-mL tube | KIRGEN | KG2611 | Sterile, RNase/Dnase and pyrogenic free |
| 37 °C incubator | Thermo Scientific | 51032877 | The 37-degree CO2 incubator provides an ideal in vitro environment. |
| Actin-Tracker Red-Rhodamine | Beyotime | C2207s | Actin-Tracker Red-Rhodamine probe is a phalloidin labeled with the fluorescent dye Rhodamine, with a maximum excitation wavelength of 540nm and a maximum emission wavelength of 565nm. |
| Alexa Fluor conjugate of wheat germ agglutinin (WGA) | Molecular Probes | W11261 | Alexa Fluor 488 Conjugate |
| Anti-alpha Tubulin antibody | Abcam | ab7291 | Anti-alpha Tubulin antibody - Loading Control (ab7291) is a mouse monoclonal antibody detecting alpha Tubulin. Suitable for Human, Mouse, Rat. |
| Anti-cytokeratin 5 antibody | Abcam | ab52635 | Anti-Cytokeratin 5 antibody - Cytoskeleton Marker (ab52635) is a rabbit monoclonal antibody detecting Cytokeratin 5. Suitable for Human, Mouse, Rat. |
| Aqua-Poly/Mount | Polysciences | 18606 | Water-Soluble, Non-Fluorescing Mounting Medium formulated for mounting sections from aqueous solutions. Useful for immunofluorescent techniques as it enhances and retains fluorescent stains. |
| Automated cell counter | Countstar | IC1000 | Automated cell counter for fast, precise cell counting |
| Benchtop centrifuge | BIORIDGE | TD5 | Benchtop centrifuge for quick and efficient sample separation in laboratory settings |
| Biological safety cabinet | Thermo Scientific | 1379 | Biological Safety Cabinet is a sterile containment device that protects operators, samples, and environments from biohazards by filtering airborne pathogens and preventing cross-contamination during microbiological work. |
| Bovine serum albumin(BSA) | YOBIBIO | U5010-10g | BSA is a globulin in bovine serum containing 583 amino acid residues with a molecular weight of 66.430 kDa and an isoelectric point of 4.7 |
| Cell Culture Dish (60X15 mm) | eppendorf | 30701119 | Tissue culture treated Sterile, free of detectable pyrogens, RNase & DNase, DNA. |
| Cellvis Chamber Slide-8 Chamber | Cellvis | C8-1.5H-N | Designed for high resolution imaging such as confocal microscopy. |
| DAPI staining solution | Beyotime | C1006-10 mL | DAPI Staining Solution is suitable for nuclear staining of all common cells and tissues. |
| Goat Anti-Mouse IgG H&L (Alexa Fluor 405) | Abcam | ab175660 | Goat Anti-Mouse IgG H&L (Alexa Fluor 405) is a secondary antibody with a maximum absorption wavelength of 401nm and a maximum emission wavelength of 421nm. |
| Goat Anti-Rabbit IgG H&L conjugated to Alexa Fluor 405 | Abcam | ab175652 | Goat Anti-Rabbit IgG H&L (Alexa Fluor 405) is a secondary antibody with a maximum absorption wavelength of 401nm and a maximum emission wavelength of 421nm. |
| Goat Anti-Rabbit IgG H&L conjugated to Alexa Fluor 594 | Abcam | ab150080 | Goat anti-rabbit IgG H&L (Alexa Fluor 594) is a secondary antibody with a maximum absorption wavelength of 590nm and a maximum emission wavelength of 617nm. |
| Inverted confocal fluorescence microscope | Leica | TCS SP8 X | Leica SP8 X laser scanning confocal microscope delivers unparalleled high-resolution imaging with advanced fluorescence detection and live-cell analysis capabilities. |
| Inverted confocal fluorescence microscope | Andor | BC43 | The Andor BC43 is a compact, high-speed confocal microscope offering 10x faster imaging than traditional systems with one-click 2D/3D imaging capability |
| NH4Cl | MedChemExpress | HY-Y1269 | Ammonium chloride as a polar compound for regulating pH. |
| Phalloidin Conjugates Oregon GreenTM488 | Life Technologies | O7466 | Colour: Green. Excitation wavelength range: 496/520. |
| Phosphate Buffered Saline (PBS) | Viva Cell Biosciences | C3582-0500 | Its function is to keep the pH of the medium within physiological range and maintain the osmotic pressure balance inside and outside the cell. |
| Triton-X 100 | Solarbio | T8200-100ml | It is a versatile nonionic surfactant used to restore membrane components under mild denaturing conditions. |
| Trypsin-EDTA Solution | GIBCO | 25300054 | Due to its digestive strength, trypsin is widely used for cell dissociation, routine cell culture passaging, and primary tissue dissociation. |
| Y-27632 | MedChemExpress | HY-10071 | Y-27632 is an orally active, ATP-competitive inhibitor of ROCK-I and ROCK-II |
References
- Austefjord, M. W., Gerdes, H. H., Wang, X. Tunneling nanotubes: Diversity in morphology and structure. Commun Integr Biol. 7 (1), e27934(2014).
- Liu, Z., Sun, Y., Qi, Z., Cao, L., Ding, S. Mitochondrial transfer/transplantation: an emerging therapeutic approach for multiple diseases. Cell Biosci. 12 (1), 66(2022).
- Yang, F., et al. Tunneling Nanotube-Mediated Mitochondrial Transfer Rescues Nucleus Pulposus Cells from Mitochondrial Dysfunction and Apoptosis. Oxid Med Cell Longev. 2022, 3613319(2022).
- Yang, C., et al. Mitochondria transfer from early stages of erythroblasts to their macrophage niche via tunnelling nanotubes. Br J Haematol. 193 (6), 1260-1274 (2021).
- Rustom, A., Saffrich, R., Markovic, I., Walther, P., Gerdes, H. H. Nanotubular highways for intercellular organelle transport. Science. 303 (5660), 1007-1010 (2004).
- Alarcon-Martinez, L., et al. Pericyte dysfunction and loss of interpericyte tunneling nanotubes promote neurovascular deficits in glaucoma. Proc Natl Acad Sci U S A. 119 (7), 2110329119(2022).
- Zhu, C., Shi, Y., You, J. Immune Cell Connection by Tunneling Nanotubes: The Impact of Intercellular Cross-Talk on the Immune Response and Its Therapeutic Applications. Mol Pharm. 18 (3), 772-786 (2021).
- Zhang, F., et al. TFAM-Mediated mitochondrial transfer of MSCs improved the permeability barrier in sepsis-associated acute lung injury. Apoptosis. 28 (7-8), 1048-1059 (2023).
- Jiang, D., et al. Mitochondrial transfer of mesenchymal stem cells effectively protects corneal epithelial cells from mitochondrial damage. Cell Death Dis. 7 (11), e2467(2016).
- Zheng, Y., et al. Tunneling nanotubes mediate KRas transport: Inducing tumor heterogeneity and altering cellular membrane mechanical properties. Acta Biomater. 185, 312-322 (2024).
- Dilsizoglu Senol, A., et al. α-Synuclein fibrils subvert lysosome structure and function for the propagation of protein misfolding between cells through tunneling nanotubes. PLoS Biol. 19 (7), e3001287(2021).
- Scheiblich, H., et al. Microglia rescue neurons from aggregate-induced neuronal dysfunction and death through tunneling nanotubes. Neuron. 112 (18), 3106-3125.e8 (2024).
- Solimando, A. G., et al. Tunneling nanotubes between bone marrow stromal cells support transmitophagy and resistance to apoptosis in myeloma. Blood Cancer J. 15 (1), 3(2025).
- Korenkova, O., et al. Tunneling nanotubes enable intercellular transfer in zebrafish embryos. Dev Cell. 60 (4), 524-534 (2025).
- Ma, L., et al. Dynamic three-dimensional culture enhances tunneling nanotubes-mediated mitochondrial transfer in mesenchymal stromal cells to accelerate wound healing. J Nanobiotechnol. 23 (1), 559(2025).
- Sahinbegovic, H., et al. Intercellular Mitochondrial Transfer in the Tumor Microenvironment. Cancers (Basel). 12 (7), 12071787(2020).
- Gurke, S., Barroso, J. F., Gerdes, H. H. The art of cellular communication: tunneling nanotubes bridge the divide. Histochem Cell Biol. 129 (5), 539-550 (2008).
- Kobielak, K., Pasolli, H. A., Alonso, L., Polak, L., Fuchs, E. Defining BMP functions in the hair follicle by conditional ablation of BMP receptor IA. J Cell Biol. 163 (3), 609-623 (2003).
- Nowak, J. A., Polak, L., Pasolli, H. A., Fuchs, E. Hair follicle stem cells are specified and function in early skin morphogenesis. Cell Stem Cell. 3 (1), 33-43 (2008).
- Woo, W. M., Zhen, H. H., Oro, A. E. Shh maintains dermal papilla identity and hair morphogenesis via a Noggin-Shh regulatory loop. Genes Dev. 26 (11), 1235-1246 (2012).
- Sáenz-de-Santa-María, I., Henderson, J. M., Pepe, A., Zurzolo, C. Identification and Characterization of Tunneling Nanotubes for Intercellular Trafficking. Curr Protoc. 3 (11), e939(2023).
- Liu, Z., et al. A Simplified and Efficient Method to Isolate Primary Human Keratinocytes from Adult Skin Tissue. J Vis Exp. (138), e57784(2018).
- Dupont, M., Souriant, S., Lugo-Villarino, G., Maridonneau-Parini, I., Vérollet, C. Tunneling Nanotubes: Intimate Communication between Myeloid Cells. Front Immunol. 9, 43(2018).
- Gerdes, H. H., Rustom, A., Wang, X. Tunneling nanotubes, an emerging intercellular communication route in development. Mech Dev. 130 (6-8), 381-387 (2013).
- Sartori-Rupp, A., et al. Correlative cryo-electron microscopy reveals the structure of TNTs in neuronal cells. Nat Commun. 10 (1), 342(2019).
- Dagar, S., Pathak, D., Oza, H. V., Mylavarapu, S. V. S. Tunneling nanotubes and related structures: molecular mechanisms of formation and function. Biochem J. 478 (22), 3977-3998 (2021).
Reprints and Permissions
