This protocol uses a multichamber bed for parallel magnetic resonance imaging (MRI) of up to four animals to detect pancreatic adenocarcinoma tumors in genetically engineered mouse models. This multianimal MRI protocol is fast and cost-effective for detecting and measuring tumors, facilitating animal selection for preclinical studies and longitudinal monitoring of tumor growth.
Method Article
Multianimal Magnetic Resonance Imaging for Tumor Measurements in Pancreatic Cancer Mouse Models
In This Article
Summary
Abstract
Advanced in vivo imaging modalities, such as magnetic resonance imaging (MRI), are essential research tools to effectively detect tumors in preclinical mouse models. MRI provides detailed anatomical information on tumor location and size. However, this imaging modality is expensive and time-consuming. To overcome this access barrier without compromising imaging quality, a multianimal MRI protocol was implemented. This protocol uses a four-chamber bed insert to obtain high-resolution multianimal anatomical MRI scans within a single acquisition session. Simultaneously imagining multiple mice reduces the time and cost of this procedure. This protocol describes a multianimal MRI workflow designed to increase the efficiency of tumor detection and longitudinal tumor monitoring in a genetically engineered Kras-driven, p53-deleted (KPC) mouse model of pancreatic ductal adenocarcinoma. This well-established clinically relevant KPC model has provided invaluable insight into the molecular mechanisms underlying pancreatic carcinogenesis, tumor progression, and treatment resistance. As proof-of-concept, this protocol is applied to validate the therapeutic benefit of the standard-of-care chemotherapeutic agent gemcitabine in the KPC model. Future applications of this MRI-guided preclinical study design are briefly discussed to evaluate the therapeutic efficacy of combination therapies.
Introduction
Pancreatic ductal adenocarcinoma (PDAC) remains one of the most lethal malignancies. Despite modest improvements in survival over recent years, the 5-year survival rate is still only 13%1. In most cases, PDAC is detected at an advanced stage, often involving local invasion or distant metastasis, which complicates treatment. The disease is biologically diverse and marked by highly invasive tumor cells, a dense desmoplastic stroma, and poor vascularization2,3,4. This complex tumor microenvironment continues to hinder efforts to fully characterize the cellular and non-cellular components that influence disease progression. To address this, effective preclinical models are needed that closely mimic human disease progression and desmoplasia.
A variety of mouse models can be used to study the biology of cancer progression and evaluate the efficacy of novel therapeutics5,6. KRas-driven genetically engineered mouse model (GEMM) spontaneously develops pancreatic tumors that recapitulate many pathophysiological and molecular features of human PDAC3,7,8,9,10,11. In particular, the Kras-driven, p53-deleted KPC model (LSL-KrasG12D; p53lox/+; Pdx1-Cre) is a well-characterized PDAC GEMM7,8,9. Tumor imaging is an important component of preclinical studies. Tumor detection and measurement of tumor size enable the selection of animals for preclinical studies, longitudinal monitoring of tumor growth and disease progression, and assessment of treatment response.
Advanced in vivo imaging modalities such as ultrasound imaging (US), bioluminescence (BLI), computer tomography (CT), fluorescence imaging (FLI), positron emission tomography (PET), and magnetic resonance imaging (MRI) can be used for tumor imaging in the KPC model and similar PDAC models12,13,14,15,16. Yet, tumor imaging in the KPC model can be challenging, and each of these imaging modalities offers unique strengths and limitations. Optical imaging technologies, such as bioluminescence (BLI) and ultrasound imaging (US), are non-invasive and cost-effective. However, their limited spatial resolution, particularly for internal organs, can lead to a poor correlation with tumor volume12,15,17,18. Bioluminescence requires genetically engineered cells expressing luciferase signal, which also depends on substrate delivery, blood flow, and tissue oxygenation. A computer tomograph provides fast imaging with minimal motion artifacts but poor soft tissue contrast without contrast agents. Iodinated contrast may cause toxicity in mice. Fluorescence imaging requires contrast agents/fluorescent probes, and autofluorescence from abdominal organs reduces sensitivity.
Because of the constraints associated with other imaging methods, magnetic resonance imaging (MRI) is generally regarded as the most reliable technique for evaluating deep-seated tumors, offering superior soft tissue contrast and molecular sensitivity for internal anatomical structures13,14,15,19. However, standard preclinical MRI protocols incur high operational costs and long acquisition times and can be a barrier for many research laboratories. Multianimal MRI can overcome this access barrier by reducing pre-scan animal preparation time (anesthesia), scanning time, and post-scan animal recovery. This protocol demonstrates the technical feasibility of PDAC tumor imaging (Figure 1, Figure 2, Figure 3, and Figure 4) and the use of image findings to recruit animals for chemotherapeutic treatment with gemcitabine (Figure 5). PDAC tumors exhibit multiple inherent mechanisms that contribute to resistance against standard-of-care (SOC) chemotherapy agents. such as gemcitabine, gemcitabine/nab-paclitaxel, or FOLFIRINOX2,3,4. This protocol provides a suitable and robust platform to evaluate new therapeutic agents and SOC chemotherapy to find promising combinations20,21,22,23,24,25,26,27 that could enhance treatment response in patients.
Protocol
All experiments described were conducted in accordance with protocols approved by the Institutional Animal Care and Use Committee at Michigan State University. All procedures involving live animals comply with established guidelines to ensure the welfare and humane treatment of animals. This protocol describes the use and treatment of the KPC mouse model of PDAC: LSL-K-Ras G12D (Krastm4Tyj); p53lox/lox (Trp53tm1Brn); Pdx1-Cre (Pdx1-cre6Tuv)9.
1. Preimaging animal preparation
- Ensure proper genotyping verification of KPC mice before use. Transport experimental mice from the animal facility to the imaging facility.
- Anesthetize up to four mice in a prewarmed sealed induction chamber with 1.5-2% isoflurane and 0.8-2 L/min oxygen. Confirm anesthesia by applying a noxious stimulus (toe-pinching).
- Apply ophthalmic lubricant to both eyes of each mouse to prevent corneal desiccation.
2. Multianimal MRI bed setup
- Place two anesthetized mice in a ventral position on the bottom part (left and right) of the 3D printed bed insert, which is attached to the vendor-provided standard single-rat PET/MRI scan holder. Ensure the animals are positioned with their spines and limbs straight.
NOTE: A 3D printer was used to print the bed inserts (Supplemental File 1 and Supplemental File 2). - Connect the air input in the vendor bed to the nose cones using tubing (inner diameter 1/16", outer diameter 1/8"), and luer fittings (e.g., 7 x 1/16"-male, 2 x 1/16" female, 2 female-female connectors, 2 T socket to socket connectors).
- Secure the mouse head in a nose cone to maintain anesthesia (1.5-2% isoflurane, 0.8-2 L/min oxygen). Cover the bottom with the top of the 3D printed bed inserts (Figure 2B).
- Place the other two anesthetized mice in a ventral position on the top part (left and right) of the 3D printed bed insert.
- Secure the mouse head in a nose cone to maintain anesthesia (1.5-2% isoflurane, 0.8-2 L/min oxygen).
- Tape the respiratory monitoring pad to the top left mouse. Ensure that the monitoring pad is at the level of the abdomen, not the chest, to measure respiration without a signal from the heartbeat.
- Set the isoflurane level to maintain a respiration rate of 30-40 bpm throughout the scan, typically 1.5-2%. If the breathing trace is not visible or the amplitude is too low, make sure the pad is securely held in place by the tape and that all connections in the tubing are tight.
- Cover the bed to complete the multianimal MRI chamber (Figure 2B).
NOTE: The vendor-provided single-rat PET/MRI bed is equipped with circulating warm air to maintain the body temperature of the animals (~35-37 ˚C). Up to four mice can be scanned simultaneously with 3D-printed inserts. The exact settings of the warm water temperature, as well as air intake and air exhaust rates, will depend on the setup at each site, including distance from the control room to the MRI. These can be set up at each site using a series of pilot scans where temperature is monitored throughout and then standardized for each study.
3. Prescan setup and imaging calibration
- Ensure that the mice are in the center of the MRI coil lengthwise by aligning the red laser with the center of the multi-chamber bed before sending the bed holder into the bore.
- Assign a label to the scan using the mouse ID and scan date in the following format: Strain, Mouse ID, Scan Date.
- Set up a T1-weighted FLASH scan with one axial slice, two coronal slices, and two sagittal slices to visualize the mice in the four-chamber bed and define the imaging area using the following settings: TR/TE 50/2.4 ms, 2 averages, flip angle 20°, resolution 0.313 mm, 1 mm slice thickness, scan time 13 s.
- Verify that the whole mouse body is in the field of view and that the mice are straight. If not, repeat the mouse positioning steps and/or move the mouse bed into or out of the bore.
NOTE: These parameters were based on the specifications of the MRI system used. These parameters can be adjusted as needed to optimize image acquisition according to experimental requirements and/or the MRI system's capabilities.
4. Multianimal magnetic resonance imaging
- Set up the T2-weighted fast spin echo sequence with the following parameters: Repetition time (TR): 3,200 ms, Echo time: 46 ms, Number of averages: 10, In-plane resolution: 300 x 300 µm, Number of coronal slices: 14, Intraslice gap: 0.3 - 0.7 mm, Fat suppression: Enabled, Rare factor: 8, slice packages: 2, Total image acquisition time: 14 min.
- Click on the center (translation) and edge (rotation) of the yellow and green boxes on the localizer image to adjust the slice package positioning as needed to optimize coverage of the pancreas region and other abdominal organs for the top and bottom set of animals.
- Confirm that all four mice are correctly aligned in the multianimal bed setup before proceeding with the scanning.
- Monitor respiration throughout the imaging sequences and adjust isoflurane level if necessary.
- After the MRI scan is completed, check that the image quality is adequate. Look for motion artifact, which shows as blurring, if a mouse moved during the scan. Check for full coverage of the abdomen. If needed, reposition the mice and redo the scan.
5. Mouse recovery
- When the scan is completed and verified, remove the bed from the MRI system.
- Open the top of the multichamber bed. Remove the respiratory monitor from the top left mouse and transfer the animals from the top and bottom of the 3D printed inserts into the recovery cage.
- Place animals into a recovery cage over a 37 °C-heating pad for postanesthesia recovery.
- Monitor respiratory rate and movement to ensure full recovery from anesthesia before returning mice to home cages. Signs of recovery include normal breathing and movement (walking).
6. Magnetic resonance imaging file processing and analysis
- Export the DICOM images from MRI software to an image analysis program to crop the images from one image with four mice to one image for each individual mouse.
- In the software, open the image for the top set of animals in the View module. The automatic window/level settings are sufficient, but adjust in the general image display control tab if needed, so that the mice are visible. In the VOI tab, manually draw a generous box around the top right mouse using a cube analytic object; then crop the image around that box from the Masking and contouring operations tab. When saving the new file, edit the DICOM metadata and file name to the correct mouse ID; then, repeat for the top left mouse using the same image, open the image for the bottom set of mice, and repeat the ROI cropping and saving.
NOTE: The VOI does not have to be precise. - Use MRI viewer software to analyze images stored in DICOM files.
- Analyze imaging slices from dorsal to ventral or ventral to dorsal. Locate the spleen and stomach to establish a proper context for the identification of pancreas and/or pancreatic tumors.
- Define "Region of Interest" (ROI) by drawing a line on the tumor boundary and perform semiautomated segmentation to calculate tumor volume. Take note of fluid cysts and other hyperchromatic findings (Figure 3 and Figure 4).
NOTE: An MRI viewer should be used to analyze DICOM files.
7. Gemcitabine treatment
- Perform MRI scans of KPC animals weekly until the tumor starts forming and can be detected (volume of ≥20 mm3). Before scanning, ensure that mice are in good health (no excessive weight loss or signs of distress, difficulty breathing, and/or gasping).
- Set up a treatment regimen once tumor criteria have been met.
NOTE: For the treated group, gemcitabine was injected intraperitoneally (i.p.) at a dose of 100 mg/kg twice a week.
CAUTION: Gemcitabine is a cytotoxic chemotherapeutic agent. Handle with appropriate personal protective equipment (PPE), including gloves and a lab coat. Dispose of contaminated syringes and materials in accordance with institutional hazardous waste protocols. - Perform MRI scans (following sections 1-6) once every week to monitor tumor response to gemcitabine.
- Sacrifice animals when the tumor meets the euthanasia criteria based on volume measurements from MRI analysis (Section 6) and/or other symptoms.
- When MRI scanning treated mice, place a protective barrier to prevent the potential transfer of the chemotherapeutic agent through excretions. During and after working with gemcitabine, follow good personal hygiene practices. Dispose of used empty syringes in a chemotherapy sharps container.
- After completing the work, spray all the anesthesia equipment, MRI beds, and all working surfaces with 70% ethanol. Place chemically contaminated protective barriers and gloves used during imaging into a plastic bag, tie off the bag, and place it in a fiber barrel for incineration.
- Schedule imaging sessions before the next round of treatment to minimize exposure to the chemotherapeutic agent.
NOTE: A frequency of MRI scans of every other week may be considered depending on the tumor growth rate and treatment regimen. Responses to treatment by tumor kinetics can be assessed through longitudinal imaging (Figure 5).
Results
KPC animals develop pancreatic tumors after 12 weeks of age9. Using a multichamber MRI bed, tumor screening of KPC mice was initiated at 10 weeks of age. This enabled recruiting animals presenting with tumors of approximately 200 mm3 for the preclinical study with the gemcitabine treatment. Differences in tumor kinetics and variations in tumor presentation were observed. Most KPC tumors showed a solid growth pattern with a single or predominant focus (Figure 4A), which facilitated animal recruitment for treatments and tumor volume assessment. However, animals with multiple small solid tumors spread throughout the entire pancreas were also observed (Figure 4A). Some PDAC cases may also exhibit intratumoral fluid-filled cystic lesions, accompanied by peritumoral non-neoplastic cystic lesions and fluid retention resulting from ductal blockage of the gallbladder and/or pancreas. (Figure 4A).
Following recruitment, animals were randomly assigned to two experimental groups: a control group that received no treatment and a treated group that received intraperitoneal (i.p.) administration of gemcitabine at a dose of 100 mg/kg twice a week. Of the total 23 eligible animals, 4 females and 7 males were allocated to the control group, and 6 females and 6 males to the treated group. Weekly MRI scans were conducted using the multianimal bed system (Figure 5A), which enabled us to continuously monitor the changes in tumor growth kinetics in both the control and treated groups (Figure 5B).
The processed imaging data demonstrate that tumors in the gemcitabine-treated KPC model had a slower growth pattern compared to the untreated control group (Figure 5C), which was associated with a statistically significant (Log rank test, p = 0.04) increase in the overall survival of the treated cohort (Figure 5D). The median survival for untreated KPC was 20 weeks, whereas the treated group showed a prolongation of the median survival of over 23 weeks (Figure 5D).
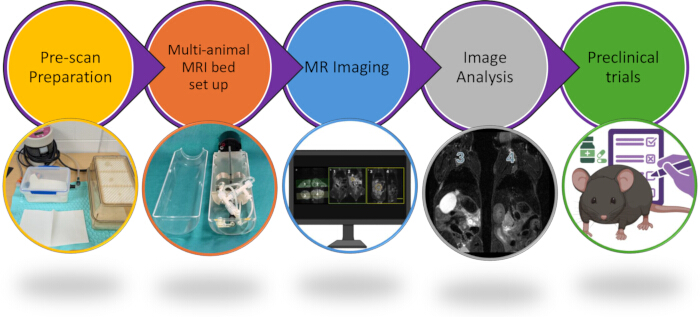
Figure 1: Workflow of multianimal magnetic resonance imaging procedure, image processing and analysis. Key steps of the multianimal MRI protocol are highlighted from prescan preparation to image-guided preclinical studies. Up to 4 animals are anesthetized in an induction chamber (prescan preparation) and prepared for placement in a multianimal bed (Multianimal MRI bed setup). A prescan image of the animals in a 2 x 2 configuration (2 in the top compartment, 2 in the bottom compartment) followed by a magnetic resonance scan (MR imaging). Each animal's imaging data are saved as individual files and analyzed independently (Image Analysis). Image finding and tumor size are used to select animals for preclinical studies and monitor treatment response (preclinical trials). Please click here to view a larger version of this figure.
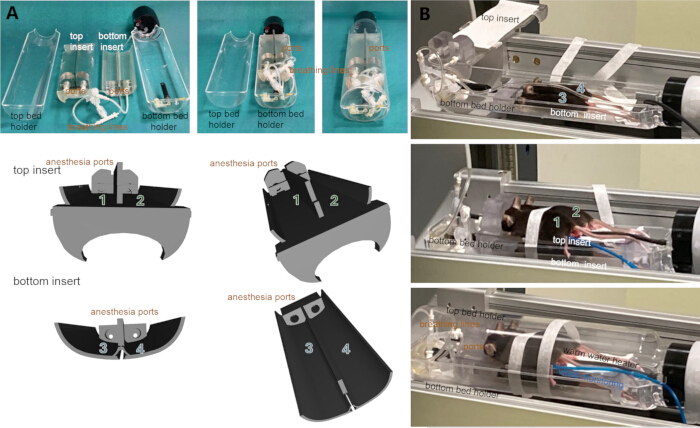
Figure 2: Key steps for multianimal MRI from setup to scan. (A) Top panel, assembly of the custom multianimal MRI bed system. Custom-designed 3D printed bed inserts with integrated anesthesia ports fit into a standard single-rat PET/MRI bed holder. Bottom panel, these 3D printed inserts divide the bed into two chambers, allowing simultaneous imaging of up to four animals: animals 1 and 2 on top of the top insert, and animals 3 and 4 on top of the bottom insert. Transverse plane and frontal modified plane of the 3D printer inserts from STL viewer are shown. (B) Sequential placement of mice into a multichamber MRI bed (from top to bottom). Top image, two animals placed in ventral position on the bottom part (left and right) of the 3D printed insert, which is inside the vendor-provided PET/MRI bed. Middle image, the other two mice are placed in ventral position on the top part (left and right) of the 3D printed insert; the mouse positioned on the left side of the top insert has a respiratory monitor attached. Bottom image: completed assembly of four animals set with the cover on top. All animals have heads secured in a nose cone to maintain anesthesia (1.5-2% isoflurane, 0.8-2 L/min oxygen). Final arrangement of all four animals in the MRI bed holder with anesthesia delivery, warm water heater, and vitals monitoring system to allow MRI scanning and data acquisition of all animals in a single session. Please click here to view a larger version of this figure.
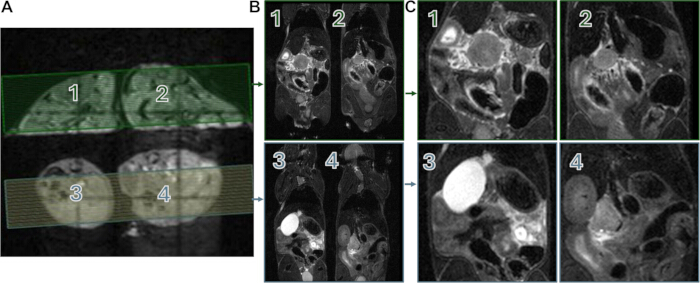
Figure 3: Data collection and processing from multianimal MRI scans. (A) Representative view (medial plane) of the initial MRI scan of all four animals. (B) MRI scan (dorsal plane) of all four mice in a multichamber bed: two mice positioned on the bottom (3, 4) and two mice on the top (1, 2) of the 3D printed inserts. (C) Final high-resolution MRI file of each individual mouse scan. Please click here to view a larger version of this figure.
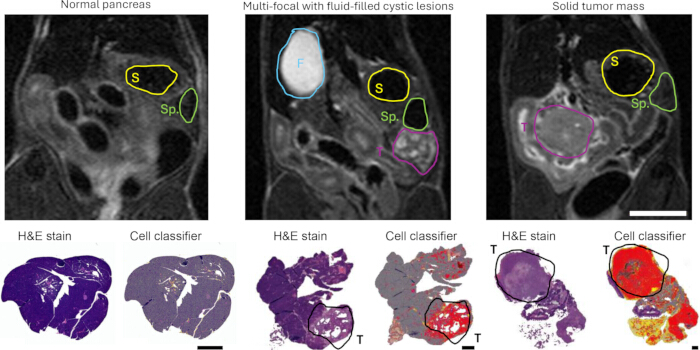
Figure 4: Diverse presentations of PDAC tumors: an integrated MRI and histology analysis. (A) Representative MRI image (dorsal plane) illustrating the anatomical variability of PDAC tumors (from left to right): normal pancreas, multifocal tumors with fluid-filled cystic lesions, and solid tumor mass. Anatomical organs are color-coded as follows: stomach (yellow), spleen (green), tumor (purple), fluid accumulation due to duct blockage (blue). White scale bar = 1 cm. (B) Histological sections of H&E-stained tumors alongside cell classes based on computer-assisted trained classifier overlays, highlighting the histopathological features of the tumors aligned with the MRI findings. Tumor (T) area outlined in black for all samples when the tumor is present. Cell classes are shown in color: normal pancreatic tissue (grey), tumor (red), and immune cells (yellow). Black scale bar = 0.5 cm. Please click here to view a larger version of this figure.
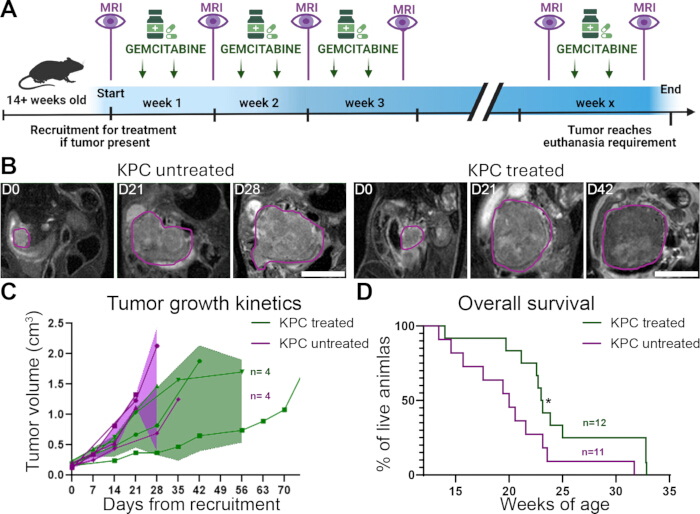
Figure 5: Multianimal MRI application for animal recruitment and tumor growth monitoring during gemcitabine treatment. (A) Timeline of the experimental design: Animals (14+ weeks old) were recruited after an MRI scan detected a tumor ≥ 200 mm3. Mice from the treated group received gemcitabine (100 mg/kg, i.p., b.i.w.) until they reached euthanasia criteria. Multianimal MRI scans were performed throughout the experiment for all animals to monitor tumor growth kinetics. (B) Representative MRI images (dorsal plane) showing tumor progression for one animal from the untreated and one animal from the treated group, from Day 0 until the final day of the experiment (survival endpoint). White scale bar = 1 cm. (C,D) Graphs illustrating tumor growth kinetics (C, n = 4 [2 F, 2 M] vs. 4 [2 F, 2 M]) and overall survival (D, n = 11 [4 F, 7 M] vs. 12 [6 F, 6 M]) in control untreated and treated group. Statistical significance for Kaplan-Meier survival curves was determined by the Log-rank (Mantel-Cox) test (* p < 0.05). Please click here to view a larger version of this figure.
Supplemental File 1: STL file for 3D printing of the bottom insert with integrated anesthesia ports that fits in a standard single-rat PET/MRI bed holder. Please click here to download this File.
Supplemental File 2: STL file for 3D printing of the top insert with integrated anesthesia ports that fits in a standard single-rat PET/MRI bed holder. Please click here to download this File.
Discussion
This protocol utilizes a vendor-provided standard single-rat PET/MRI bed, modified with custom-made 3D-printed inserts, which allow for the simultaneous scanning of up to four mice (Figure 1). This multianimal configuration substantially reduces not only the expensive MRI scanning time but also the overall procedure duration. It allows for the parallel preparation (anesthesia, positioning in bed, and bed loading), scanning, and recovery of four animals in one session, compared to the additional time required for preparing, scanning, and recovering each animal individually in four separate sessions. The setup also includes individual nose cones for controlled anesthesia delivery to each animal, dedicated vital monitoring for one animal, and integrated heating capabilities to maintain body temperature for all scanned mice (Figure 2). The 3D printed inserts provide consistent animal alignment and improve segmentation consistency. Real-time respiratory monitoring enables continuous assessment and adjustment of anesthesia during scanning, thereby minimizing motion artifacts.
This protocol was used to detect and longitudinally monitor pancreatic tumor progression in the KPC model (Figure 5A-C) treated with the chemotherapeutic agent gemcitabine, serving as a proof-of-concept preclinical study. Gemcitabine, alone or in combination, is a first- or second-line treatment for patients with local or metastatic pancreatic cancer28,29,30. These results with gemcitabine-treated animals are consistent with previous reports, which have also shown a survival benefit31. More importantly, this protocol provides a suitable and robust platform to study combination therapies of new therapeutic agents and SOC chemotherapy in the KPC model or similar models of PDAC. These combination therapies may be small molecule inhibitors, immunotherapy, siRNAs, microRNA activity modulators, and other therapeutic oligonucleotides against key molecular targets20,21,22,23,24,25,26,27. These combination therapies may also include genetically modified targets to understand their interaction with SOC chemotherapy or other therapies at an early stage of development9,20,32.
While the focus of this protocol is the imaging of the pancreas and other abdominal cavity organs, this multianimal protocol and described MRI sequences can be applied for anatomical characterization of other mouse models of cancer, such as breast cancer and glioblastoma, or other diseases involving the kidney, and/or liver33. We are aware of other protocols describing multianimal MRI scanning18,34. For example, Dazai et al. described neuroanatomical MRI scanning of up to seven mice18. While this setup enables brain imaging of seven animals, it does not enable individual control of anesthetic and temperature for each mouse. Their housing chamber is designed for mice weighing less than approximately 32 g; in contrast, our multichamber bed supports a broader range of mouse body sizes. Depending on the intended organ, scanning time, and resolution, Dazai et al.'s protocol may provide some advantages over the protocol described here.
Disclosures
The authors have no conflicts of interest to disclose.
Acknowledgements
This work was supported, in part, by the National Cancer Institute R01 CA258314 grant and the MSU Tetrad Initiative for Interdisciplinary Research grant 2024 edition to LFS. We are thankful to MSU Precision Health Program Tissue Analysis Core, Institute for MSU Quantitative Health Science and Engineering/Precision Health Program Advanced Molecular Imaging Facility, MSU Campus Animal Resources, MSU Veterinary Diagnostic Laboratory, and MSU Quantitative Bio Element Analysis and Mapping (QBEAM) Center for their technical assistance.
Materials
| Name | Company | Catalog Number | Comments |
|---|---|---|---|
| 3D printer | Stratasys | J750 | For multi-animal MRI bed inserts |
| Gemcitabine HCl | ApexBio | A1402-500 | For ip injections |
| HOROS | HOROS | https://horosproject.org/ | For MRI analysis |
| Isoflurane | Covetrus | 11695067772 | For mouse anesthesia |
| Isoflurane vaporizer | SOMNI Scientific | VS6002 | For mouse anesthesia |
| Lo-Dose U-100 Insulin Syringes | BD | 14-826-79 | For ip injections |
| luer lock tube couplings, nylon straight plugs, barbed for 1/16" tube ID x7 | McMaster | 51525K521 | For multi-animal MRI bed assembly |
| luer lock tube couplings, plug, for 1/16" bardbed tube ID x2 | McMaster | 7466N11 | For multi-animal MRI bed assembly |
| male to male luer connector x2 | SAI | MML | For multi-animal MRI bed assembly |
| MR-compatible small animal monitoring and gating system | SAII | Model 1030 | monitor animals during MRI |
| MRI bed adapter | Bruker | T150743 | vendor-provided MRI bed component |
| MRI coil, 72 mm ID | Bruker | T20209V3 | vendor-provided MRI coil |
| Multimodality cradle medium rat | Bruker | T151629 | vendor-provided MRI bed |
| ophthalmic lubricant | Covetrus | 75848 | For use during anesthesia |
| ParaVision 360 software | Bruker | https://www.bruker.com/en/products-and-solutions/preclinical-imaging/paravision-360.html | For MRI analysis |
| PMOD 4.2 | Bruker | https://www.bruker.com/en/products-and-solutions/preclinical-imaging/pmod.html | For MRI analysis |
| preclinical MRI system | Bruker | BioSpec 70/30 | For MRI |
| Stratasys Vero Clear resin | Stratasys | RGD810 | For multi-animal MRI bed fabrication |
| Tee Socket-to-Socket Connectors, Luer Lock Tube x2 | McMaster | 51525K443 | For multi-animal MRI bed |
| tubing (inner diameter 1/16", outer diameter 1/8") | Bruker | T12330 | For multi-animal MRI bed assembly |
References
- Siegel, R. L., Giaquinto, A. N., Jemal, A. Cancer statistics, 2024. CA Cancer J Clin. 74 (1), 12-49 (2024).
- Lafaro, K. J., Melstrom, L. G. The paradoxical web of pancreatic cancer tumor microenvironment. Am J Pathol. 189 (1), 44-57 (2019).
- Kleeff, J., et al. Pancreatic cancer. Nat Rev Dis Primers. 2, 16022(2016).
- Collisson, E. A., Bailey, P., Chang, D. K., Biankin, A. V. Molecular subtypes of pancreatic cancer. Nat Rev Gastroenterol Hepatol. 16 (4), 207-220 (2019).
- Grimm, J., Potthast, A., Wunder, A., Moore, A. Magnetic resonance imaging of the pancreas and pancreatic tumors in a mouse orthotopic model of human cancer. Int J Cancer. 106 (5), 806-811 (2003).
- Ireson, C. R., Alavijeh, M. S., Palmer, A. M., Fowler, E. R., Jones, H. J. The role of mouse tumour models in the discovery and development of anticancer drugs. Br J Cancer. 121 (2), 101-108 (2019).
- Westphalen, C. B., Olive, K. P. Genetically engineered mouse models of pancreatic cancer. Cancer J. 18 (6), 502-510 (2012).
- Cook, N., Olive, K. P., Frese, K., Tuveson, D. A. K-ras-driven pancreatic cancer mouse model for anticancer inhibitor analyses. Methods Enzymol. 439, 73-85 (2008).
- Schipper, J., et al. Loss of microRNA-21 leads to profound stromal remodeling and short survival in K-ras-driven mouse models of pancreatic cancer. Int J Cancer. 147 (8), 2265-2278 (2020).
- Uprety, D., Adjei, A. A. KRAS: from undruggable to a druggable cancer target. Cancer Treat Rev. 89, 102070(2020).
- Buscail, L., Bournet, B., Cordelier, P. Role of oncogenic KRAS in the diagnosis, prognosis and treatment of pancreatic cancer. Nat Rev Gastroenterol Hepatol. 17 (3), 153-168 (2020).
- Snyder, C. S., et al. Complementarity of ultrasound and fluorescence imaging in an orthotopic mouse model of pancreatic cancer. BMC Cancer. 9, 106(2009).
- Farr, N., et al. Noninvasive characterization of pancreatic tumor mouse models using magnetic resonance imaging. Cancer Med. 6 (5), 1082-1090 (2017).
- Yin, T., Liu, Y., Peeters, R., Feng, Y., Ni, Y. Pancreatic imaging: current status of clinical practices and small animal studies. World J Methodol. 7 (3), 101-107 (2017).
- Rojas, J. D., et al. Validation of a combined ultrasound and bioluminescence imaging system with magnetic resonance imaging in orthotopic pancreatic murine tumors. Sci Rep. 12 (1), 102(2022).
- Vohra, R., et al. Evaluation of pancreatic tumor development in KPC mice using multiparametric MRI. Cancer Imaging. 18 (1), 41(2018).
- Serkova, N. J., et al. Preclinical applications of multi-platform imaging in animal models of cancer. Cancer Res. 81 (5), 1189-1200 (2021).
- Dazai, J., Spring, S., Cahill, L. S., Henkelman, R. M. Multiple-mouse neuroanatomical magnetic resonance imaging. J Vis Exp. (48), e2497(2011).
- Iwano, S., et al. Single-cell bioluminescence imaging of deep tissue in freely moving animals. Science. 359 (6378), 935-939 (2018).
- Sempere, L. F., Powell, K., Rana, J., Brock, A. A., Schmittgen, T. D. Role of non-coding RNAs in tumor progression and metastasis in pancreatic cancer. Cancer Metastasis Rev. 40 (1), 1-20 (2021).
- Smith, E. S., et al. Clinical applications of short non-coding RNA-based therapies in the era of precision medicine. Cancers (Basel). 14 (6), 1588(2022).
- Sempere, L. F., Keto, J., Fabbri, M. Exosomal microRNAs in breast cancer towards diagnostic and therapeutic applications. Cancers (Basel). 9 (7), 71(2017).
- Sempere, L. F., Azmi, A. S., Moore, A. MicroRNA-based diagnostic and therapeutic applications in cancer medicine. Wiley Interdiscip Rev RNA. 12, e1662(2021).
- Nakisa, A., et al. Tumor-associated carbohydrate antigen 19-9 (CA 19-9), a promising target for antibody-based detection, diagnosis, and immunotherapy of cancer. ChemMedChem. 19 (24), e202400491(2024).
- Miller, A. L., Garcia, P. L., Yoon, K. J. Developing effective combination therapy for pancreatic cancer: an overview. Pharmacol Res. 155, 104740(2020).
- Dreyer, S. B., Beer, P., Hingorani, S. R., Biankin, A. V. Improving outcomes of patients with pancreatic cancer. Nat Rev Clin Oncol. 22 (6), 439-456 (2025).
- Nevala-Plagemann, C., Hidalgo, M., Garrido-Laguna, I. From state-of-the-art treatments to novel therapies for advanced-stage pancreatic cancer. Nat Rev Clin Oncol. 17 (2), 108-123 (2020).
- Koltai, T., et al. Resistance to gemcitabine in pancreatic ductal adenocarcinoma: a physiopathologic and pharmacologic review. Cancers (Basel). 14 (10), 2486(2022).
- Casper, E. S., et al. Phase II trial of gemcitabine (2,2′-difluorodeoxycytidine) in patients with adenocarcinoma of the pancreas. Invest New Drugs. 12 (1), 29-34 (1994).
- Moore, M. Activity of gemcitabine in patients with advanced pancreatic carcinoma: a review. Cancer. 78 (3 Suppl), 633-638 (1996).
- Ho, T. T. B., et al. Combination of gemcitabine and anti-PD-1 antibody enhances the anticancer effect of M1 macrophages and the Th1 response in a murine model of pancreatic cancer liver metastasis. J Immunother Cancer. 8 (2), e001367(2020).
- Kempinska, K., et al. Genetic ablation of microRNA-10b improves treatment outcomes in mouse models of pancreatic cancer. Cancer Res. 84 (6 Suppl), Abstract 467 (2024).
- Fan, J., et al. Species-specific hepatic uptake of [64Cu]Cu-EOB-NOTA, a newly designed hepatospecific PET agent. Mol Imaging Biol. 27 (3), 305-312 (2025).
- Ramirez, M. S., Esparza-Coss, E., Bankson, J. A. Multiple-mouse MRI with multiple arrays of receive coils. Magn Reson Med. 63 (3), 803-810 (2010).
Reprints and Permissions
