This protocol describes methods used to examine brain structure and function in children aged 3-5 years. It includes procedures for preparing children for a magnetic resonance imaging (MRI) session, including materials to send families in preparation for the session, mock scanner training, and methods employed during the scanning session.
Method Article
Scanning Dos and Don'ts: Using Magnetic Resonance Imaging in Awake Children Aged 3 to 5 Years to Assess Brain Structure and Function
In This Article
Summary
Abstract
Early childhood (3 to 5 years of age) is a period marked by significant changes in the brain. This development underlies age-related improvements in several domains - including language, memory, and socioemotional skills. However, assessing brain structure and function during this period using MRI poses several challenges. For example, difficulty remaining still, maintaining attention for long periods and non-compliance in performing behavioral responses in the scanner are particularly prevalent issues. Technological advances in neuroimaging techniques over the past decade have significantly improved success rates for pediatric neuroimaging studies. For example, shorter scan durations and real-time monitoring and correction of motion during scanning have proven especially valuable in acquiring reliable data. However, developmental researchers must still be creative to adequately prepare young participants for the scanning environment and, subsequently, ensure the data acquired can be used to address the questions of interest. The success of these sessions has become paramount with the onset of large, multi-site consortium studies, such as the HEALthy Child and Brain Development study, which seek to track normative and atypical brain development across the first years of life. To this end, the current report provides a pediatric neuroimaging protocol to improve young children's scanning experience and developmental neuroimaging data quality results from four neuroimaging studies conducted in a single laboratory over the past 11 years. These results provide an indication of expected scan preparation time, total scan duration, and success rates for structural and functional scans in young children when using this protocol.
Introduction
MRI studies in sleeping infants demonstrate how early structural and functional brain architecture sets the foundation for later skills across several domains, including language1,2, executive functioning3, and socioemotional development4. However, many developmental questions, such as those targeting specific cognitive processes, require children to be awake during scanning so that researchers can measure responses to tasks, movies, or other stimuli. As children grow, they increasingly have the capacity to provide behavioral responses during scanning, motivating a shift toward awake neuroimaging in early childhood. This shift from scanning sleeping children to acquiring scan data while children are awake introduces novel challenges. For example, many young children experience anxiety surrounding MRI, as it is a highly novel and stimulating environment that is often not designed to be child friendly. Further, it may remind children of doctor's offices and, indeed, many researchers scan at medical centers. If children can get in the scanner, it can be difficult to keep them in the scanner for the duration of the scan protocol and to maintain their attention. Loss of attention is especially relevant for task-based scans from which researchers hope to infer relations between functional brain characteristics and cognitive processes. Both anxiety and fluctuating attention contribute to increased motion in this age range and, as a result, early childhood is considered a very difficult period to image5.
Existing pediatric MRI protocols primarily focus on sleeping infants6, and task-based scanning in older children7,8. However, during early childhood (approximately 3 to 5 years of age) children can be scanned awake, but they may still be too young for traditional task-based functional MRI scans that require button press responses. This gap is important to address, as early childhood is a unique developmental window during which children's attention, ability to remain still, and compliance with instructions are emerging and allow for variations of awake scanning. As a result, scanning preschool-aged children awake requires additional considerations beyond those outlined for older children. To date, the best practices for approaching these sessions have been shared informally through conversations at conferences or carrying training from one position to the next (e.g., procedures learned during a postdoctoral fellowship and subsequently implemented when establishing an independent laboratory). The current protocol formalizes and consolidates these practices, with the goal of increasing transparency and enabling researchers who are new to working with this age group in MR-settings to implement awake MRI with young children.
Therefore, the goal of this protocol is to promote safe acquisition of high-quality brain images during early childhood to study brain-behavior relations. Specifically, acquiring high-quality data using this protocol enables researchers to address a range of developmental questions, such as relations between brain structure and cognitive outcomes, how functional connectivity among brain regions relates to cognitive outcomes, or how task-related functional activation of brain regions supports different cognitive processes. These questions are particularly salient during the preschool years, when foundational abilities such as theory of mind9, forming lasting memories10, and preliteracy skills underlying reading development11 rapidly emerge. Moreover, research on cognitive development during this time may have important clinical and policy implications. For example, linking brain development and nap transitions in early childhood may inform preschool nap policies, with consequences for learning and memory12.
The techniques described in this paper build off previous protocols7,8 for scanning children while incorporating more recent technological advances and methodological considerations in order to scan very young children awake. This method is especially applicable to researchers acquiring MRI data from children ages 3 to 5 years. Future research should continue to adapt procedures and technologies to enable examination of brain-behavior relations across broader age ranges and developmental stages using awake MRI (e.g., infancy13, toddlerhood14).
By following the steps outlined in this protocol, researchers will be able to examine how structural and functional brain development supports cognitive development during a period of rapid growth in both domains. In addition, this protocol can be used in clinical settings, as it enables the acquisition of high-quality neuroimaging data, which has the potential to improve early diagnosis and characterization of neurodevelopmental conditions in young children. To illustrate the efficacy of the protocol, results are presented from four neuroimaging studies conducted in a single laboratory that employed this protocol over the past 11 years in children ages 3-8 years. The results provide an indication of the expected preparation time needed before the scan, scan protocol durations and actual amount of time spent in the scanner, and usable data acquired across different sequence types (e.g., structural vs. functional).
Protocol
This protocol describes methods and tools to measure brain structure and function in awake and healthy preschool-aged children using magnetic resonance imaging (MRI) and follows the guidelines of University of Maryland, College Park's human research ethics board. Written informed consent was obtained from each child's parent or legal guardian, and verbal assent was obtained from each child. The protocol includes all steps in facilitating a successful neuroimaging session from recruitment practices through to the actual scanning session and highlights ways to reduce child and parent anxiety surrounding MRI and includes troubleshooting practices to maximize data.
1. Staff training and experience
- First, have new members of the research team shadow a session where they only observe.
- After shadowing two or three sessions, new members serve as the Scan buddy, which requires less decision-making and troubleshooting than other roles (such as leading the session) but offers the chance for them to be more involved in the study visit and practice building rapport with a child participant.
- After serving as the Scan buddy for two or three sessions, new members lead a session while an experienced research team member assists. Provide detailed feedback on their performance after the session. Repeat this process until the new member can independently and confidently lead a session.
- Have the new members start by scanning older children, as they tend to be more compliant, and the sessions run smoother than with younger children. Alternatively, have them practice on colleagues' children who may be more comfortable in research settings.
2. Recruitment and scheduling
- Inquire about preconceived notions of MRI and alleviate potential sources of anxiety. For example, ask whether the child has previous experience with MRIs and if there were any issues during the session (e.g., child was sensitive to the scanner noise or confined space of the scanner).
- Let potential families know that the scan will not require sedation or radiation, that the scan can be stopped at any point during the session, and (if consistent with imaging center practices) that parents/guardians may stay with the child at all times and/or that a researcher will be in the room with the child for the duration of the scan.
NOTE: Some children will perform better if their parents are heavily involved in all steps while some children will perform better if their parent takes a less active role.
Directly ask the parent in the initial recruitment/screening whether their child will be more attentive to the researcher's instructions if the parent is engaged or disengaged (e.g., in the room during the mock training and actual scan vs. outside the room, as it will determine how to structure the study visit). - Use child-friendly language for any materials geared towards the child participant. For example, "brain camera" sounds less intimidating than "MRI" or "scanner" and "helmet" sounds less intimidating than "head coil".
- Use videos and other visuals to show the families exactly how the session will go when they arrive at the neuroimaging center (See Figure 1A).
- Have a few articles (ideally ones that are written with a lay audience in mind) or other resources ready for parents that want to read more about MRI and understand the process in greater detail15,16.
- Offer appointments on weekends, school holidays and mornings (not after school when the child is likely fatigued and less compliant). Obtain the parents' input on the best time to schedule the MRI for their child. For example, some children perform best early in the morning whereas others are groggy in the morning and perform better in the afternoon.
- Send the parents a reminder a few days before the session requiring them to confirm they are still able to attend the session. Include any requirements for their upcoming visit. For example, tell the parents to dress the child in comfortable, metal-free clothing such as a cotton T-shirt and sweatpants.
- Have MR-safe spare clothing on site in case the child arrives in clothing that is not MR-safe.
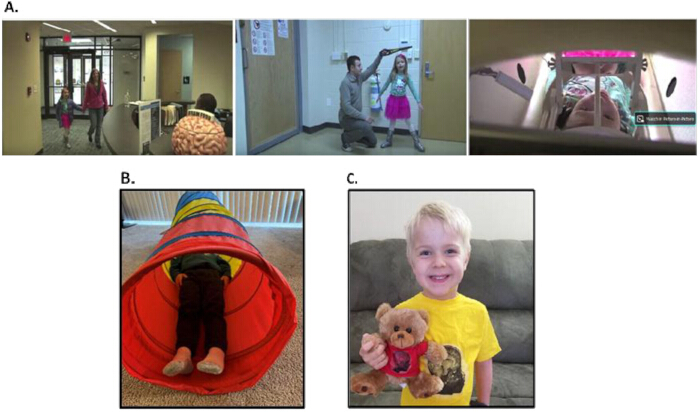
Figure 1: Materials for recruitment, training, and compensation of participants. (A) MRI video to send to families before the study visit. It should outline what to expect from the time the family enters the neuroimaging center to the time they leave. (B) Play tunnel used to give participants experience laying still under conditions like those for the actual MRI. (C) Participant prizes using their brain images include a teddy bear wearing a t-shirt with the child's brain image ironed on as well as a t-shirt for the child to wear themselves. Please click here to view a larger version of this figure.
3. Preparations before the scan
- Have at least two lab members who are experienced in working with children at the visit - one staff member to work with the participant during the mock session as well as manage the MRI control room setup during the scan and one staff member to serve as the helper (a.k.a. 'Scan buddy') that will remain in the room with the child during the actual scan.
- Avoid overwhelming the family with the size of the research team. Keep the team small and introduce members one at a time.
- Have one team member greet the family and bring them to the mock suite and then introduce additional staff when relevant, such as introducing the MR operator when entering the scanner suite.
NOTE: Some neuroimaging centers have their own MRI operators/technicians that will run the scan, while at other locations the research team trains a member to do so. If the center does not provide an operator, then have an additional research team member that can operate the scanner for a total of 3 staff members. - Before entering the actual scanner suite, hold a mock MRI session where the child is shown what they will be asked to do for the actual scan, such as practicing laying still while hearing noises similar to those the scanner will make.
NOTE: Some neuroimaging centers may not have a dedicated mock suite with a replica scanner, but the same principles can be applied with a little creativity. For example, recreate the mock MRI environment by having the child lay in a fabric play tunnel (see Figure 1B) while playing scanner noises on a cell phone at full volume. However, some studies suggest that mock scanner sessions are not essential to successfully scanning young children,17,18 so determine whether to employ this method. It should be noted that mock scanning does require additional time, which may present a burden. In addition, if done on the same day as the actual scan, children can get tired/hungry/fussy and families frustrated. Therefore, it is up to the researcher's discretion to employ this method or not. The current protocol goes over the steps for a mock session, consistent with the studies presented in the Results section. - Provide a lot of scaffolding to prepare children for the MRI scan. Start by preparing them to lay still in a narrow space by using something more familiar/child-friendly, such as a fabric play tunnel (see Figure 1B).
- Introduce the mock scanner suite and allow the child to explore the space on their own terms.
- Decorate the space to fit a child-friendly theme (e.g., outer space demonstrated in Figure 2) to help the child feel comfortable upon entering and build rapport by discussing aspects of the room (e.g., asking child "which spaceship picture on the wall is your favorite?").
- Use the mock MRI training as an opportunity to prepare the child for all aspects of the real scan (see Figure 2A, B). Create a brain camera book that details the steps they will follow while getting their brain pictures taken with visual aids demonstrating each of the steps (Figure 2C-F).
- Have the child listen to pre-recorded scanner sounds that mimic the ones they will hear during the actual scan as another opportunity to scaffold their experience.
- Start with having the child listen to the sounds while standing in the room and have them identify things that remind them of the sound. For example, one of the sequences often reminds children of a ringing telephone, alarm clock or fire engine. Map these foreign sounds onto more familiar ones to help reduce anxiety when hearing the noises in the actual scanner.
- Have the option for the child to watch a movie during structural scans, as this increases their engagement and, subsequently, reduces motion for those scans. During the mock session, have the child select the movie they will watch for the structural scans from a predetermined, age-appropriate selection.
NOTE: Offer movies that will engage the child's attention but that are not too comical or involve singing. Comical movies will induce laughing and movies with singing will prompt the child to sing along, which both induce motion. Obtain the parent's input on the movie, as they may have additional insights on movies that are especially funny to the child or, on the other hand, may be scary and cause distress. - Have the child practice lying still on the mock MRI bed while watching a movie with the scanner sounds playing.
- Remind the child that they should be still like a statue but soft like their favorite stuffed animal (as introduced in the brain camera book, Figure 2F). Do so for the same amount of time as one of the actual MRI sequences (e.g., around 4-5 min for a T1-weighted anatomical sequence).
- Provide feedback to the child on motion and attention during this time. Continue this practice until the child can remain still for two minutes straight.
NOTE: If the child nods or otherwise gives a gesture to answer questions, prompt them to respond verbally and let them know that they will need to do so for the real brain camera as well. This is important to reduce head motion during the scan. Incorporate this prompt into questions to the child (e.g., "Say 'yes' if you are ok and ready to move on or say 'no'"). Take note of any other typical movements or tendencies to move a certain way that the child makes, such as pulling their knees up, moving their hands to the mirror/scanner ceiling and use this to adjust the instructions and approach during the scan (see Supplementary Table 1 for the scan parameters for each sequence). - Push the mock MRI scanner bed to move the child into the mock scanner, mimicking the experience in the actual MRI.
- Repeat the progress in sections 3.12-3.14 of playing the movie, scanner noises, and monitoring motion. Continue this practice until the child remains still for the length of one of the scans without movement (about 5 min), while being mindful of overall visit length and child's ability to continue.
- If the child is especially anxious, offer for the parent or a researcher to demonstrate laying still in the mock scanner first. Often it is helpful for the child participants to see that others are willing to do the things that are being asked of them.
- Offer for the child to choose a stuffy from a selection of MRI-safe stuffed animals to bring with them to the actual scanner.
- Ask the child, "would you like to bring a friend into the brain camera room?". If they respond yes, show them the options and have them select one. If they say no, proceed without selecting a stuffed animal.
- Before proceeding to the actual scanner room, have the parent confirm the information on the screening form, take a quick snack break (minimize liquids) and ensure the child uses the restroom.
- Ensure that the family leaves all belongings (e.g., phones, bags, watches, jewelry) in a locker outside the control and scanner room to keep distractions minimized.
NOTE: Have the parent fill out the MRI safety screening form for both their child and themselves (if the neuroimaging center permits parents to go into the scanner room) before scheduling the visit to ensure the child is eligible. Then, re-screen the participant and parent/caregiver on the scan day. Even if the parent does not intend to stay in the room with the child during the scan, this will allow greater flexibility during the scan if the child becomes distressed in the scanner and the parent wants to/is permitted to go in to comfort them. If the parent is not MR safe, they should fully understand any associated restrictions. - Provide brain-themed prizes such as a t-shirt with the child's own brain image or a small 3D printout of the child's brain to serve as extra motivation (see Figure 1C). Let the child know about this prize before doing the scan and inform them that, if they are still, the pictures for their prize will turn out better.
NOTE: Though it is possible for these prizes to be made onsite at the session (e.g., make brain t-shirts using iron-on appliques), the timing may not always work out. If these prizes cannot be provided on the day of the MRI session, have a prize that the child will be able to take with them at the end of the session such as a teddy bear or sticker book.
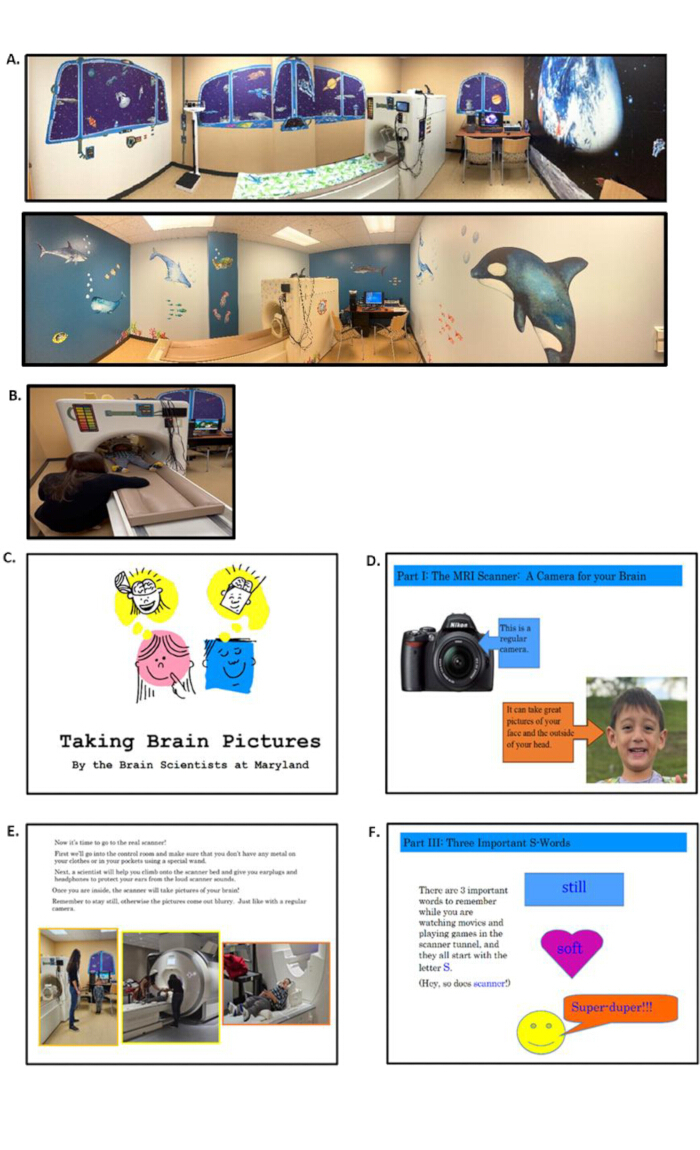
Figure 2: Mock scanner suite equipment and training materials. (A) Two examples of a mock MRI suite where the child gets more practice for the real scan and in a space that more closely mimics the actual scanner suite (as opposed to the play tunnel from Figure 1B). Using a space or underwater theme makes the mock space less intimidating and allows researchers to frame the MRI visit as an adventure. (B) Use the mock space to practice all the steps for the real scan such as putting on headphones, laying down on the scanner bed, and putting on the superhero helmet. (C) A colorful cover page with child-friendly images. (D) Connecting the brain camera to concepts that the child is already familiar with, such as a regular camera, can help increase their comfort with the brain camera and reinforce the importance of concepts such as staying still to avoid blurry pictures, which is true of both regular pictures and brain pictures. (E) Providing pictures of other children going through the scanning process, including practicing the poses for being wanded to check for metal and putting on headphones. (F) Simple commands with the participants, such as "still", "soft", and "super-duper" can later provide brief reminders of what to do during the session. Please click here to view a larger version of this figure.
4. During the scan
- Set up before the child enters the room (completing these items before the child arrives in the scanner room is ideal, so then the focus can be on making the child comfortable).
- Make sure the child's selected movie and any task files needed are prepped before checking the visual display and audio settings.
- Open a screen check for when the child is in the scanner. This can be as simple as a PowerPoint slide with child-friendly images along the borders (see Figure 3).
- If the child can name all the images on the screen while in the scanner without moving their head, then they can see the whole screen. If they miss some of the images, then adjust the mirror and ask again what they can see. Repeat this process until they name all images.
NOTE: If possible, decorate the actual scanner with decals or themed sheets, as it makes the scanner environment less intimidating and more child friendly. - Check the headphone volume level to make sure it is not too quiet or too loud.
- Set out the ear protection that will be used for the child and any padding for their head.
- If using motion monitoring software, make sure to set up the parameters ahead of time. If using the Framewise Integrative Real-time MRI Monitoring (FIRMM), set the following settings: fMRI motion threshold: 0.3 mm, T1/T2 motion threshold: 0.5 mm, Brain Size: Default.
- Entering the scanner suite with the child
- Once in the control room, introduce the child to the MRI operator and tell them that this is a friend that will help take their brain pictures.
- Use a handheld metal detector to ensure parent/caregiver and child do not have any metal on them. If the parent/caregiver or child are wearing clothes with pockets, instruct them to check and ensure their pockets are empty.
- Ask the child stand straight "like a pencil," with their hands at their sides and their feet together. Pass the handheld metal detector along the front of the child's body from their feet to the top of their head, and then along their back.
- Ask the child to spread their arms out "like a starfish." Pass the metal detector along the side of one leg, up the child's side, under the arm, along the top of the arm, up the side of the head, and then down the opposite side, following the same path.
- If the metal detector signals at any point, check for metal, remove the item, and re-screen the child.
- Repeat the process in section 4.2.3-4.2.5 for the parent/caregiver.
- Once in the scanner suite, give the child an opportunity to explore the scanner space or ask any questions about the machine before directing them to sit on the scanner bed.
- Have a stool for them to use to climb onto the bed to increase their sense of control and autonomy.
NOTE: If the child is particularly anxious, try playing child-friendly music in the scanner room to mask the "whooshing" noise the scanner makes. - When the children are sitting on the bed, show them the screen in the back of the MRI where they will watch their movie and remind them that they will see the movie using a mirror.
- Before putting in their ear protection, let them feel it with their own hands and explain to them that this will help make sure the 'camera noise' does not bother them while they watch their movie or play their game.
- Once the ear protection is in, place headphones on the child's head and have them lay down in the head coil. Reposition the child until they are laying comfortably and their head is straight.
- Use soft foam padding to pack the child's head into the head coil and explain that these are like pillows to make them more comfortable and that they should be "nice and cozy, but not too tight". Let them squeeze the pads before putting them in.
- Eliminate any negative space between the child's head and the head coil to prevent large head movements during the scan. Once the pads are in place, ask the child, "is that nice and cozy, but not too tight?". Readjust pads as needed until the child confirms.
- Play part of the child's movie through the headphones to ensure that it is not too quiet or too loud for the child.
- Place a rolled-up towel underneath the child's knees to increase their comfort and decrease the likelihood that they will move their legs or cross them, which could result in conductive loops.
NOTE: For children that tend to move their legs, use a MR-safe weighted blanket to help reduce motion. If the child chooses an MRI stuffed animal (see section 3.16.2), hand them the stuffed animal to hold and make sure they settle in a comfortable position. Remind them not to move it during scanning. To provide tactile motion feedback during the scan, apply medical tape from one end of the head coil base to the other via the child's forehead, as this has been shown to reduce head motion during the scan19. - Next, tell the child that they are going to get their space or superhero helmet that they will need to get the brain pictures taken and put the head coil on.
- Once the head coil is in place, tell the child that the 'brain camera bed' is going to be raised.
- Once the scanner bed is in home position, put the mirror on and adjust it so that the child can see the full screen by using the screen check (see Figure 4). Ask the child which animals/colors they see on the screen and make sure they name all the images.
NOTE: Young children may not understand what is meant when asked if they can see the full screen, so this step is essential to ensure the child will be able to see the entire screen during the scan. - Before moving the child into the scanner, ask if they have any last questions, make sure they are comfortable, and remind them to stay still and to not cross their arms or legs.
- Remind the child that a study staff member will stay in the room with them for the whole scan and that they will check in with them in between each 'picture.' Also remind them to respond verbally rather than nodding their head.
NOTE: It is very important to always have something on the screen for the child to look at from the time they are put into the scanner and continually talk to them through the headphones in between sequences. This will reduce motion, as children get antsy when they cannot see anything in the scanner and are uncertain of what is going to happen next.
- Role of the helper (Scan buddy) in the scanner room
- Remain close to the scanner bore and monitor for motion and alertness during the scan. Avoid making inconsistent physical contact with the child during the scan, unless they become distressed, as this often prompts them to look down, which results in head motion.
NOTE: The effectiveness of physical contact in preventing motion varies largely from child to child but an "all or none" approach works well. For children that are doing well in the scanner or move at physical contact, do not provide any physical contact during the scan. For children that are anxious in the scanner and tend to move unless reassured in some way, keep constant pressure in the form of a hand on their ankle or a forearm across both ankles. If necessary, the Scan buddy may also lean into the bore and lay a hand on the child's stomach for the duration of the scan. - Once scanning starts, avoid moving too much at the bore to limit magnetic field inhomogeneities which can result in image artifacts.
- Aid in the transition between sequences by having the researcher in the control room or operator talk to the child for particularly long setups, which will remind the child that they are not alone in the scanner room and will reduce their anxiety. Avoid having the Scan buddy talk to the child unless necessary, as this will likely prompt the child to look down, which moves their head.
- Communicate information to the child close to when it is relevant and in small chunks to avoid overwhelming them. For example, tell the child "We are going to set up your game/movie now. We'll let you know right before it starts" as researchers are setting up their functional scan. Then, after it is set up, provide any instructions for the game/movie, and remind them to stay still right before starting the scan.
- Be receptive to the child's needs. For example, if they become cold during the scan, put a blanket on them and, if they get hot, remove the blanket.
- Signal to the researchers in the control room if they should stop the scan (e.g., child wants to get out, child moved the mirror on the head coil). Ensure signals are understood and agreed upon by all staff members.
- Ensure that the child remains awake and attends to the screen for functional tasks.
- Remain close to the scanner bore and monitor for motion and alertness during the scan. Avoid making inconsistent physical contact with the child during the scan, unless they become distressed, as this often prompts them to look down, which results in head motion.
- Control room
- Talk to the child through the headphones and let them know that the first brain picture will be starting soon, and they will start to hear the 'brain camera noises'. Remind them to remain still, soft, and do their super-duper best to follow instructions (see Figure 2F). If this first sequence is a structural scan (a sequence that provides static anatomical information), have the child's pre-selected movie playing.
- Structural scans: Put on the child's movie and start the scan. Check the quality of the scan after it finishes to determine whether it is necessary to re-run.
NOTE: If the child is engaged during the movie and is still, consider running through multiple structural sequences without checking in. This can reduce head motion as well as the child's anxiety. - Functional scans: For task-based functional scans, load the task and provide any instructions to the child via their headphones. Remind them to remain still while they complete the task.
NOTE: Talk to the child while the task loads to keep them engaged and still, as downtime during task setup can result in boredom and/or anxiety7. If the child is left for even a few seconds without someone speaking to them, they are likely to move and/or ask to end the scan. Watch out for common issues such as the child falling asleep during the task, talking during the task (which induces motion), the child asking for a blanket partway through the scan or asking to remove a blanket partway through, the child getting itchy and subsequently moving, the child looking at the researcher in the room instead of the screen during the task, and the child reaching up and moving the mirror during the scan, which may impact how much of the screen they can see. Button responses are incredibly difficult to get from young children without inducing motion. Consider using simple verbal responses with sparse scanning or eye movement responses20,21. - Be as flexible as possible in adjusting the scan order.
NOTE: For example, it may be better to start with task-based sequences for young children to take advantage of their greater engagement early in the scan session. However, if a child is particularly anxious, it may be better to start with an anatomical scan where they can watch a movie of their choice. - Keep in mind that the task and rest data may not be usable if a usable structural scan is not acquired. Strike a balance between attending to the child's specific needs and prioritizing the most important sequences for the study, as they may not get acquired the longer the session goes on.
NOTE: If a sequence or task fails to run and requires troubleshooting, put on a Pixar short or other short, animated clip to keep the child still and engaged. Communicate any changes to the child through the headphones so they know what to expect. For example, if troubleshooting the functional task say, "We're having a little trouble getting your game to start, so we're going to put on a short movie for you before we try again." - For sequences where motion monitoring via software is available, ensure that the child's motion meets a predefined threshold for acceptable motion. For sequences where this is not viable, use visual inspection to determine whether a sequence should be re-run (e.g., crispness of image, evidence of banding/striping, artifacts).
- Have a quality assessment guide on hand to determine if a sequence should be re-run.
- Clearly document scan order, number of runs for each sequence, and any protocol deviations during the session, as these should be considered when analyzing the data.
- After the scan
- Once the final sequence finishes running, tell the child via headphones that they are all done and that the operator will be in to get them out. Remind them to stay still until the operator lets them out.
- Have the Scan buddy assist in ensuring the child remains in the scanner until the appropriate time.
- Give positive feedback to the child, telling them they did well and thank them for their efforts!
- If permitted, bring up an image of the child's brain for them to see once they are out of the scanner and provide the child with a small prize or gift.
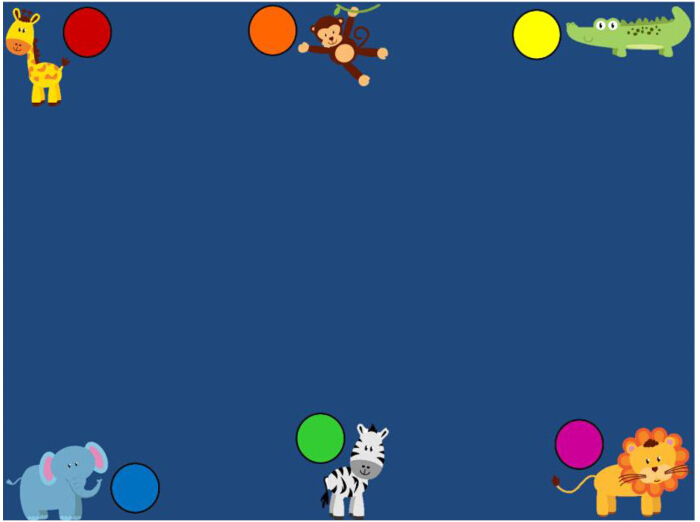
Figure 3: Example screen check after setting the child up in scanner. Ask them to name all the animals/colors they can see. If they can name all the animals/colors, then they can see the whole screen. If they cannot, readjust the mirror and ask again until they name all animals/colors. Please click here to view a larger version of this figure.
Results
Scan success rates
Using the procedures detailed above leads to successful MRI scan acquisition in young children. The following results come from post hoc analysis of four neuroimaging study samples from a single lab with participants ranging between 3 to 8 years of age (N = 344). Additionally, three of these studies (Studies 1, 2, and 4) included a longitudinal component in which participants were brought back at 6-month or 1-year intervals. Study 1 has been completed22,23, Study 2 is in the data analysis phase, and data collection is ongoing for Study 3 and Study 4. Note that, across all figures and tables, success rates are calculated from the number of families that came in for the scan. Therefore, these numbers do not reflect the families that declined to participate in the MRI or did not come in for their appointment. Studies 1 and 2 typically began with children watching Inscapes24 (a 7 min abstract and language-free movie meant to keep children's attention while not being too cognitively demanding), followed by a movie of their choice. Study 3 typically began with a task followed by a movie of their choice, and Study 4 typically began with the child's movie choice followed by Partly Cloudy25. Figure 4 summarizes scan success across participants and timepoints, defining success as obtaining at least one usable (i.e., included in subsequent analyses) scan. The purpose of this figure is to highlight the overall efficacy of this protocol in acquiring neuroimaging data from young children. Sequence specific success rates, including the distinction between structural and functional scans, are detailed in Table 1, Table 2, and Table 3. Overall, most participants contributed usable data, with most unusable sessions concentrated in the youngest participants.
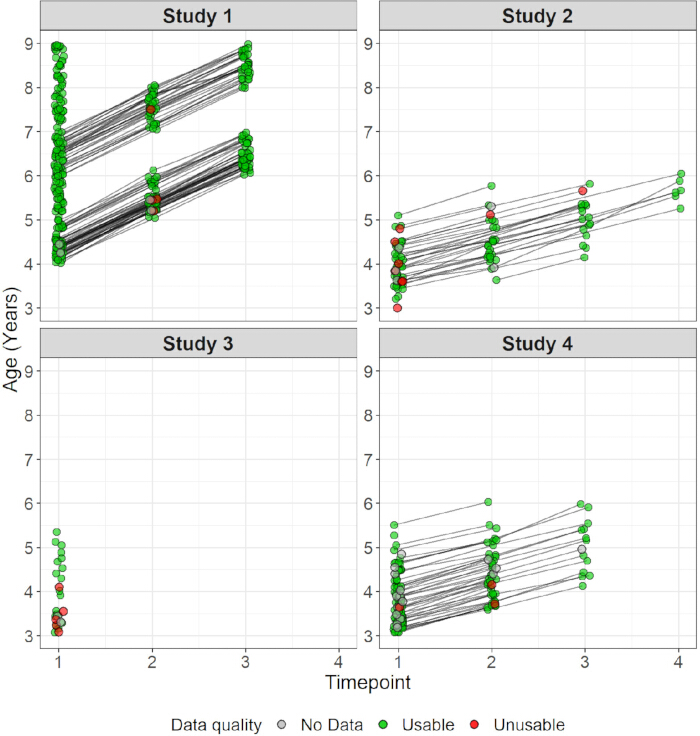
Figure 4: Age distribution and longitudinal MRI sessions across four studies. Each panel represents one study (Study 1-4). Individual dots indicate MRI sessions for each participant, plotted by timepoint (x-axis) and age (y-axis). Colors denote session type: green = at least one usable scan acquired, red = low-quality scan data acquired, and gray = no usable scan data acquired. Black horizontal lines connect sessions from the same participant, illustrating longitudinal data collection. Please click here to view a larger version of this figure.
Table 1 presents structural scan success rates (at least 1 usable scan) at participants' first timepoint and subsequent timepoints by age group. Success rates for the first timepoint were generally high, though lowest in the youngest group (87% for ages 3-4 years). In contrast, all participants 5 years and older successfully completed their first structural scan. At subsequent timepoints, the youngest age group's success rate slightly decreased (83%) as well as the 5-6 year group (decreased from 100% to 91%). These results may partly reflect noise as there were fewer 3-4 year olds at subsequent timepoints (n = 18) than at the first timepoint (n = 98) and fewer 5-6 year olds at the first timepoint (n = 39) than the subsequent timepoints (n = 83). Yet several factors may also contribute. Younger children often improve with age but, when they do not, they may not retain a strong memory of the initial scan session and thus approach subsequent sessions with increased anxiety. Older children's performance often remains stable, but declines may reflect recollection of prior difficulties and subsequently less compliance. Alternatively, worse performance could reflect increased comfort in the scanner to the point where children had less concern about staying still. However, as this study did not measure children's subjective experiences of previous scan sessions, these interpretations remain speculative.
| 3–4 yrs | 4–5 yrs | 5–6 yrs | 6–7 yrs | 7–8 yrs | 8–9 yrs | Total | ||||
| Timepoint 1 | ||||||||||
| # of scheduled visits | 98 | 105 | 39 | 42 | 30 | 30 | 344 | |||
| # of kids who went in scanner | 89 | 99 | 39 | 42 | 30 | 30 | 329 | |||
| # of kids too scared to enter scanner | 9 | 7 | 0 | 0 | 0 | 0 | 16 | |||
| # of successful structural scans | 77 | 94 | 39 | 42 | 30 | 30 | 312 | |||
| % of successful structural scans | 87% | 95% | 100% | 100% | 100% | 100% | 95% | |||
| Subsequent Timepoints | ||||||||||
| # of scheduled visits | 18 | 52 | 82 | 47 | 33 | 34 | 266 | |||
| # of kids who went in scanner | 18 | 48 | 82 | 47 | 33 | 34 | 262 | |||
| # of kids too scared to enter scanner | 0 | 4 | 0 | 0 | 0 | 0 | 4 | |||
| # of successful structural scans | 15 | 46 | 75 | 47 | 32 | 34 | 249 | |||
| % of successful structural scans | 83% | 96% | 91% | 100% | 97% | 100% | 95% | |||
Table 1: First timepoint and subsequent timepoints structural scan completion and success rates by age group. The table shows the number of scheduled visits, the number of children who entered the scanner, the number who declined due to fear, and the number of successful structural scans. Percentages represent the proportion of successful scans relative to the number of children who entered the scanner.
Studies 1 and 2 also included a functional task-free resting state sequence using Inscapes, an abstract and language-free movie meant to keep children's attention while not being too cognitively demanding24. Table 2 shows the success rates for participants' first timepoint where this task was administered and their subsequent time points. Across all age ranges, success rates for this scan at participants' first timepoint were lower than for the structural scan. Moreover, six years seemed to serve as an inflection point for performance whereby children under six show similar poor success rates (mean success rate = 58%) and children of age six and over perform significantly better (mean success rate = 82%). At subsequent timepoints, performance in the three- to six-year-old groups improved (mean success rate = 65%) whereas the six-to nine-year-old groups stayed more consistent (85%).
| 3–4 yrs | 4–5 yrs | 5–6 yrs | 6–7 yrs | 7–8 yrs | 8–9 yrs | Total | |||||
| Timepoint 1 | |||||||||||
| # of scheduled visits | 27 | 73 | 33 | 42 | 30 | 30 | 235 | ||||
| # of kids who went in scanner | 25 | 70 | 33 | 42 | 30 | 30 | 230 | ||||
| # of kids too scared to enter scanner | 2 | 3 | 0 | 0 | 0 | 0 | 5 | ||||
| # of kids who attempted "task-free" sequence | 24 | 70 | 33 | 41 | 30 | 30 | 228 | ||||
| # of successful “task-free” functional scans (≤0.2 censor fraction at 0.3 mm) | 14 | 43 | 18 | 34 | 24 | 25 | 158 | ||||
| % of successful “task-free” functional scans (≤0.2 censor fraction at 0.3 mm) | 58% | 61% | 55% | 83% | 80% | 83% | 69% | ||||
| Subsequent Timepoints | |||||||||||
| # of scheduled visits | 2 | 26 | 69 | 46 | 33 | 34 | 210 | ||||
| # of kids who went in scanner | 2 | 26 | 68 | 46 | 33 | 34 | 209 | ||||
| # of kids too scared to enter scanner | 0 | 0 | 1 | 0 | 0 | 0 | 1 | ||||
| # of kids who attempted the "task-free" sequence | 2 | 26 | 66 | 44 | 33 | 33 | 204 | ||||
| # of successful “task-free” functional scans (≤0.2 censor fraction at 0.3 mm) | 2 | 10 | 39 | 36 | 26 | 31 | 144 | ||||
| % of successful “task-free” functional scans (≤0.2 censor fraction at 0.3 mm) | 100% | 38% | 59% | 82% | 79% | 94% | 71% | ||||
Table 2: First timepoint and subsequent timepoints "task-free" functional scan completion and success rates by age group. The table shows the number of scheduled visits, the number of children who entered the scanner, the number who declined due to fear, and the number of successful "task-free" functional scans. Success was defined as ≤0.2 censor fraction at 0.3 mm. Percentages represents the proportion of successful scans relative to the number of children that attempted this scan.
Studies 1 and 3 both included functional task-based scans. In Study 1 participants encoded a series of object-character pairs at timepoint 1, and in Study 3, participants passively viewed pictures of objects that were encoded outside the scanner immediately before the scanning session. Unsurprisingly, success rates for this task were lower than the structural scan success rate. This is likely because the tasks, which had no audio and consisted of static images presented one after another, were less engaging than the movie selected by the child for the structural scan.
| 3–4 yrs | 4–5 yrs | 5–6 yrs | 6–7 yrs | 7–8 yrs | 8–9 yrs | Total | |||
| # of scheduled visits | 15 | 62 | 35 | 42 | 30 | 30 | 214 | ||
| # of kids who went in scanner | 13 | 60 | 35 | 42 | 30 | 30 | 210 | ||
| # of kids too scared to enter scanner | 2 | 2 | 0 | 0 | 0 | 0 | 4 | ||
| # of kids that attempted task sequence | 12 | 17 | 11 | 20 | 23 | 13 | 96 | ||
| # of successful task-based functional scans (≤0.2 censor fraction at 0.3 mm) | 7 | 9 | 6 | 14 | 13 | 10 | 59 | ||
| % of successful task-based functional scans (≤0.2 censor fraction at 0.3 mm) | 58% | 53% | 55% | 70% | 57% | 77% | 61% | ||
Table 3: First timepoint "task-based" functional scan completion and success rates by age group. The table shows the number of scheduled visits, the number of children who entered the scanner, the number who declined due to fear, and the number of successful "task-free" functional scans. Success was defined as ≤0.2 censor fraction at 0.3 mm. Percentages represents the proportion of successful scans relative to the number of children that attempted this scan.
These results highlight the existing challenges associated with task-based functional MRI in young children. Study 4 attempted to remedy this issue using a passive movie-viewing paradigm in which 3-to-5-year-old children watched the animated Pixar short film, Partly Cloudy, in the scanner and answered memory-related questions following the scan session. Of the 61 children at the first timepoint, 50 (82%) provided useable data. Data collection for this study is ongoing but, of the 64 participant data points from subsequent timepoints 56 (88%) have been successful. These success rates are much higher than those seen for this age group using the task-free resting state scan and the task-based block designs using stock images. These results illustrate the importance of developmentally appropriate and child-friendly tasks to ensure successful scanning sessions.
Scan prep time and data collection time
Figure 5 illustrates the average time required to set up participants in the scanner (measured from their arrival in the control room) as well as the average time they spent in the scanner. Setup time was fairly consistent across studies and age groups, typically ranging from 10 to 20 min. However, total in-scanner time showed more study-specific patterns. In Studies 1 and 2, children remained in the scanner for similar durations regardless of age. In Study 3, however, younger children appeared to spend less time in the scanner than older children, likely reflecting age-related increases in tolerance for the scanning environment and specific task demands. Notably, Study 3 included a block design functional task with static images, a particularly challenging paradigm for young children. Study 4 showed the opposite pattern: younger children tended to stay in the scanner longer than older children. This may reflect greater efficiency in scanning older children, who are more likely to provide usable data on the first attempt. For example, Study 4 included a high-resolution hippocampal structural scan that is highly sensitive to motion; younger children often required multiple runs to obtain a usable dataset.
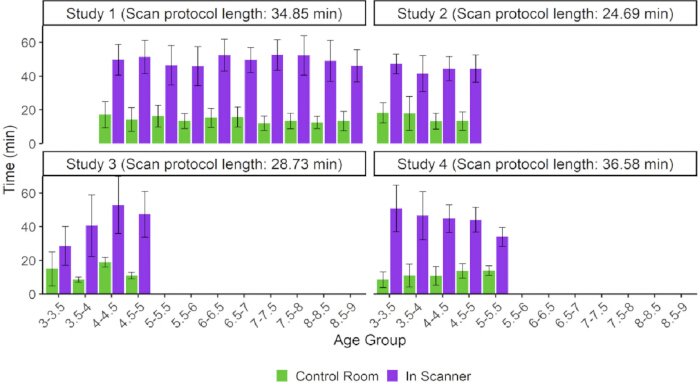
Figure 5: Preparation and scanning times by age group. Each panel represents one study (Study 1-4), with mean times (± SD) plotted for different age ranges. Green bars indicate time from entering the control room to being set up in the scanner, while purple bars represent total in-scanner time. Titles include the scan protocol duration for each study. Please click here to view a larger version of this figure.
Figure 5 illustrates two important points about how timing informs scan success rates. First, the setup time includes all the steps outlined above in protocol section 3.2. This section, more than any other in the protocol, emphasizes the importance of patience. Taking this additional time to allow the child to explore the scanner environment contributed greatly to the high success rates presented in Table 1, Table 2, and Table 3. Therefore, researchers should expect to block off around 15-20 min setting the child up for the scan, which may be different than what is expected when scanning infants, older children, and adults. Second, although scan protocols in this age tend to be around 30 min, it takes about twice as long to acquire the data. As outlined in the protocol, this is likely due to re-running unusable scans until they reach the appropriate motion/quality threshold and/or taking breaks in between scans to ensure the child is comfortable.
Supplementary Table 1: Scan parameters. Please click here to download this File.
Discussion
Since MRI was introduced in research settings, it has greatly advanced understanding of the brain in school-aged children, adolescents, and adults. The presented data show that, with child-friendly protocols, many barriers to scanning younger children can be overcome. Preparation is key: providing parents with child-friendly MRI materials, offering an extended mock scanner session, answering questions from both parents and children, and building rapport and trust all significantly increase the likelihood of success.
However, even with strong preparation, flexibility at all stages of the protocol is essential. While this protocol outlines the main steps for preparing children for structural and functional scan sessions, these steps rarely occur in the exact same order or in the same exact way across participants. For example, an especially anxious child may benefit from first seeing a research assistant be put in the scanner, or from starting with structural scans paired with a preferred movie before attempting more demanding task-based or passive-viewing movie-watching scans. In contrast, children with less developed attentional control may benefit from starting with task-based scans, capitalizing on their ability to focus early in the session. Some children will stay still without any physical contact while some will require constant physical contact during scanning. Moreover, some children will perform better if their parent is heavily involved in all steps while some children will perform better if their parent takes a less active role. Therefore, it is essential to learn as much about the individual child leading up to and during the scan session in order to tailor the experience to their needs. This flexibility helps maximize the chance of obtaining usable data while respecting each child's comfort level. These considerations are especially relevant in the age of multi-site cohort studies and shared developmental neuroimaging datasets. Researchers who analyze these data may not have direct experience collecting MRI data from young children and may therefore be unaware of key factors that influence data quality. For example, whether a given scan reflects a first attempt or a later attempt following earlier failures, as well as how acquisition order and in-session decision-making varied across participants, has important implications for subsequent analyses, as children may process stimuli differently upon repeated viewing26. By documenting the preparation, flexibility, and real-time judgment required to successfully scan young children, the current protocol aims to increase transparency around how these data are acquired. This information may help secondary data users better interpret variability in data quality and appreciate the expertise and effort involved in pediatric neuroimaging acquisition.
Functional MRI (fMRI) has become particularly valuable because it links brain activity to specific cognitive processes, often by having participants perform tasks in the scanner. However, most fMRI studies focus on older children (8+ years) and adults, as collecting task-based data from younger children poses significant methodological challenges27. To address this, researchers have used "task-free" approaches in which young children passively view abstract, nonverbal movies designed to reduce motion without imposing high cognitive demands24. However, these movies may fail to reliably engage participants during early childhood and do not allow for targeted examination of functional networks supporting specific cognitive processes. Lack of engagement introduces significant motion during the scan which further compromises usability of the data.
The results demonstrate both progress and remaining challenges in pediatric neuroimaging. Structural scans, which are typically paired with child-selected movies, yield the highest rates of usable data. Task-free resting-state scans -- abstract movies without language or narrative -- produce lower success rates, and existing task-based fMRI which requires children to attend to static images shows the lowest success rates. Therefore, researchers must be creative in designing tasks that are engaging enough to sustain young children's attention, thereby reducing motion, while still acquiring enough data to robustly index the neural mechanisms underlying the cognitive process of interest28,29. Although it requires more effort than the traditional abstract, non-verbal movies, developing engaging, naturalistic movie stimuli with interesting characters and contexts may be the best path forward to improve functional scan success rates and data usability in this age range. This approach aligns with recent work showing that naturalistic movie watching outperforms resting state in predicting behavior30. Further, movie-watching paradigms have advantages over traditional tasks with static images, as they more closely reflect cognitive processes as they unfold in real-world contexts. For example, encoding information while characters are embedded within a meaningful narrative more closely reflects everyday learning than encoding static images presented in isolation or superimposed on a static background. At the same time, if isolating specific processes is essential to the research question, task-based paradigms may remain feasible when designed to be developmentally appropriate, highly engaging, and brief. For example, studies that have successfully acquired behavioral responses from children during a traditional fMRI task included audiovisual stimuli which likely helped keep children engaged despite the presentation of static images31.
However, it is important to reiterate that these results come from one lab and therefore should not be interpreted as normative or field-wide benchmarks for pediatric neuroimaging success rates. Retention and data usability are expected to vary across laboratories, protocols, and time as methods, technology, and training practices evolve. Moreover, within-lab variability likely reflects not only child- or task-related factors but also increasing expertise of the data acquisition team, as confidence in protocol implementation and the ability to make appropriate in-the-moment judgments improve with experience. Instead, the intention of sharing these results is to demonstrate the variability in scan success rates across sequence type and age group to call attention to areas to improve data acquisition in early childhood neuroimaging.
This paper provides a comprehensive protocol for pediatric neuroimaging, from recruitment through data acquisition. Unlike previous protocols, it emphasizes the preparation that can be done before the scan session to reduce the child's and parents' anxiety surrounding MRI (i.e., at the recruitment/scheduling phase). Moreover, this protocol addresses important considerations for collecting different sequences from participants - different actions are necessary to promote successful collection of task-based functional scans from anatomical scans. This is especially important, as research shows that functional neural characteristics are likely shaped by the brain's underlying structural properties32,33 indicating that observed structural changes in the existing literature likely interact with emerging functional properties to support cognitive development. Further, investigating these processes during early childhood is particularly crucial, as this developmental period reflects an inflection point for several important brain structures and cognitive domains. Ultimately, improving pediatric neuroimaging protocols will advance the ability to chart brain-behavior relations across development and inform early interventions for children at risk for neurodevelopmental challenges.
Disclosures
The authors have no known conflicts of interest to disclose.
Acknowledgements
This work was supported by the National Institutes of Health (grant number HD079518, HD094758, HL164628, DA055316, HL164628), the National Science Foundation (BCS 1749280), and the Ann G. Wylie Dissertation Fellowship. We would like to thank the families that have participated in the studies presented here. We also acknowledge the members of the Neurocognitive Development Lab that contributed to data recruitment and collection and three anonymous reviewers for helpful comments.
Materials
| Name | Company | Catalog Number | Comments |
|---|---|---|---|
| Framewise Integrative Real-time MRI Monitoring (FIRMM) | Turing Medical | https://turingmedical.com/firmm/ | Real-time motion monitoring software that can be used during MRI scans |
| Mock MRI Scanner | MRA | https://www.mra1.com/ | A non-magnetized replica of the machine that will take the structural and functional images of the child's brain |
| MRI Scanner | Siemens | TrioTim: https://www.siemensmriequipment.com/siemens-magnetom-trio-a-tim-system-3t-mri-system/ Prisma: https://www.siemens-healthineers.com/magnetic-resonance-imaging/3t-mri-scanner/magnetom-prisma | The actual machine that will acquire the structural and functional brain images from the child. The current study used a Siemens MAGNETOM TrioTim and Siemens MAGNETOM Prisma Fit scanners. |
| PigPigPen Pop Up Play Tunnel Tent for Toddlers Babies or Dogs, Indoor & Outdoor Toys for Kids Backyard Playset. (Red,Yellow,Blue) | QC Toys (purchased via Amazon) | ASIN: B08CX8CSHS https://www.amazon.com/Tunnel- Toddlers-Outdoor-Backyard-Playset /dp/B08CX8CSHS/ref=sr_1_1_sspa ?crid=TMOEHG3ZTIQE&dib=eyJ2I joiMSJ9.KGpH71dFbEqINLzxRIF4R T40fQjmYlf97lr28PSUQNzrTA9P-d FnIV1nntEtQZvzDwa6S-XD_oQSC fq9Edygmi7-8HNvzD5ViiGcUFK8-L hnMM4Cp9a9tFjFyjSdZ9XqnbHEiQ q5-s840MGEibn9yiBcuegF5bTDqJ nN5lUYbSGH-miQpPrVX2aOUEUB QffUCJ2jBTGCkJkZkzuzg02Kp2Kv 6Xy2-v_viwbb0NL0xrUrraeP1RBF MONLgHdUy-ytWBY2nTBz7nQ_j0ks wk8boVM_K_dBGWbpYNb3rNXea IE.MyBdkK5mhRpPkVeiVrEUfyGhd uoejLoPKY0cU5vRyVY&dib_tag=se &keywords=fabric%2Bplay%2Btun nel&qid=1766335944&sprefix=%2C aps%2C67&sr=8-1-spons&sp_csd= d2lkZ2V0TmFtZT1zcF9hdGY&th=1 | A cylindrical play tunnel made out of fabric that can be used to mimic the experiences while in the MRI scanner |
References
- Zuk, J., et al. White matter in infancy is prospectively associated with language outcomes in kindergarten. Dev Cogn Neurosci. 50, 100973(2021).
- Yu, X., et al. Functional connectivity in infancy and toddlerhood predicts long-term language and preliteracy outcomes. Cereb Cortex. 32 (4), 725-736 (2021).
- Ghassabian, A., et al. Infant brain structures, executive function, and attention deficit/hyperactivity problems at preschool age. A prospective study. J Child Psychol Psychiatry. 54 (1), 96-104 (2013).
- Kanel, D., et al. Neonatal white matter microstructure and emotional development during the preschool years in children who were born very preterm. eNeuro. 8 (5), (2021).
- Barkovich, M. J., Li, Y., Desikan, R. S., Barkovich, A. J., Xu, D. Challenges in pediatric neuroimaging. NeuroImage. 185, 793-801 (2019).
- Copeland, A., et al. Infant and child MRI: A review of scanning procedures. Front Neurosci. 15, (2021).
- Raschle, N. M., et al. Making MR imaging child's play - Pediatric neuroimaging protocol, guidelines and procedure. J Vis Exp. (29), e1309(2009).
- Harrington, S. G., et al. Strategies to perform magnetic resonance imaging in infants and young children without sedation. Pediatr Radiol. 52 (2), 374-381 (2022).
- Wellman, H. M., Carey, S., Gleitman, L., Newport, E. L., Spelke, E. S. The child's theory of mind. , The MIT Press. (1990).
- Fivush, R., Hudson, J. A. Knowing and remembering young children. CUP. 8 (2), 222-223 (1990).
- Ozernov-Palchik, O., Gaab, N. Tackling the 'dyslexia paradox': Reading brain and behavior for early markers of developmental dyslexia. Wiley Interdiscip Rev Cogn Sci. 7 (2), 156-176 (2016).
- Spencer, R. M. C., Riggins, T. Contributions of memory and brain development to the bioregulation of naps and nap transitions in early childhood. Proc Natl Acad Sci. 119 (44), e2123415119(2022).
- Ellis, C. T., et al. Re-imagining fMRI for awake behaving infants. Nat Commun. 11 (1), 4523(2020).
- Olson, H. A., et al. Utilizing functional neuroimaging to study early language development. Dev Cogn Neurosci. 76, 101641(2025).
- Jiménez Sánchez, L., et al. Behind the scenes: Using movies to study the human brain. Front Young Minds. 13, 1508144(2025).
- Raschle, N., et al. The magical art of magnetic resonance imaging to study the reading brain. Front Young Minds. 8, 72(2020).
- Fletcher, S., et al. Effectiveness of training before unsedated MRI scans in young children: A randomized control trial. Pediatr Radiol. 53 (7), 1476-1484 (2023).
- Thieba, C., et al. Factors associated with successful MRI scanning in unsedated young children. Front Pediatr. 6, (2018).
- Krause, F., et al. Active head motion reduction in magnetic resonance imaging using tactile feedback. Hum Brain Mapp. 40 (14), 4026-4037 (2019).
- Vannest, J., et al. FMRI activation in language areas correlates with verb generation performance in children. Neuropediatrics. 41 (5), 235-239 (2010).
- Lukasova, K., et al. Predictive saccades in children and adults: A combined fMRI and eye tracking study. PLoS One. 13 (5), e0196000(2018).
- Geng, F., Botdorf, M., Riggins, T. How behavior shapes the brain and the brain shapes behavior: Insights from memory development. J Neurosci. 41 (5), 981-990 (2021).
- Canada, K. L., Hancock, G. R., Riggins, T. Developmental changes in episodic memory across early- to mid-childhood: Insights from a latent longitudinal approach. Memory. 30 (3), 248-261 (2022).
- Vanderwal, T., et al. Inscapes: A movie paradigm to improve compliance in functional magnetic resonance imaging. NeuroImage. 122, 222-232 (2015).
- Pixar Animation Studios and Walt Disney Pictures. , Partly Cloudy. https://www.pixar.com/partly-cloudy (2009).
- Segaert, K., et al. The suppression of repetition enhancement: A review of fMRI studies. Neuropsychologia. 51 (1), 59-66 (2013).
- Yates, T. S., et al. Hippocampal encoding of memories in human infants. Science. 387 (6740), 1316-1320 (2025).
- Richardson, H., et al. Development of the social brain from age three to twelve years. Nat Commun. 9 (1), 1027(2018).
- Richardson, H., Saxe, R. Development of predictive responses in theory of mind brain regions. Dev Sci. 23 (1), e12863(2020).
- Finn, E. S., Bandettini, P. A. Movie-watching outperforms rest for functional connectivity-based prediction of behavior. NeuroImage. 235, 117963(2021).
- Raschle, N. M., et al. Functional characteristics of developmental dyslexia in left-hemispheric posterior brain regions predate reading onset. Proc Natl Acad Sci. 109 (6), 2156-2161 (2012).
- Honey, C. J., et al. Predicting human resting-state functional connectivity from structural connectivity. Proc Natl Acad Sci. 106 (6), 2035-2040 (2009).
- Preti, M. G., Van De Ville, D. Decoupling of brain function from structure reveals regional behavioral specialization in humans. Nat Commun. 10 (1), 4747(2019).
Reprints and Permissions
