This protocol introduces an automated sound localization testing system with precise loudspeaker placement and integrated response analysis, validated in normal-hearing participants and participants with single-sided deafness. It provides a reproducible method to assess spatial hearing and supports functional classification using the International Classification of Functioning, Disability and Health (ICF) framework.
A subscription to JoVE is required to view this content. Sign in or start your free trial.
Research Article
An Automated System for Sound Localization Testing in Hearing-Impaired Listeners
In This Article
Summary
Abstract
Sound localization is a fundamental component of auditory perception, yet its clinical assessment remains technically demanding. Although free-field localization tests using semicircular loudspeaker arrays are considered the gold standard, many existing protocols rely on examiner-driven procedures and provide limited guidance for the functional interpretation of localization errors.
An automated sound localization protocol that combines standardized stimulus delivery and response acquisition with a function-oriented interpretive framework is presented. Stimuli are presented from predefined azimuthal positions under controlled conditions, participant responses are collected via a graphical interface, and localization performance metrics are computed automatically upon test completion. Importantly, quantitative localization errors are subsequently translated into clinically meaningful categories using the International Classification of Functioning, Disability and Health (ICF)-based classification framework.
The protocol was applied to 34 adults, including 20 with normal-hearing and 14 with single-sided deafness (SSD). Participants were tested under standardized conditions, and their performance was quantified using the root mean square error (RMSE) and mean absolute error (MAE). Outcomes were functionally classified according to the ICF framework. Normal-hearing listeners consistently demonstrated low localization errors corresponding to no or mild impairment, whereas the SSD group demonstrated larger angular errors and higher ICF-defined impairment levels.
By integrating an automated localization protocol with an ICF-based interpretive scale, this approach facilitates reproducible assessment of horizontal sound localization while enabling clinically relevant interpretation of spatial hearing deficits. The proposed framework supports examiner-independent testing and may be applied in clinical and research settings to characterize localization performance across listener groups and interventions.
Introduction
Hearing loss is typically quantified using pure-tone audiometry, which provides a straightforward measure of auditory thresholds and allows clinicians to classify the severity of impairment and predict associated difficulties in daily life. However, the decline in sound localization ability, a functional consequence of hearing loss, cannot be captured as easily 1. Unlike threshold testing, localization requires the integration of binaural cues and is far more challenging to evaluate objectively or to classify in terms of functional disability.
Conventional free-field localization tests have long been considered the gold standard, but they exhibit several limitations. Accurate placement of at least seven loudspeakers in a semicircular arrangement (-90° to 90°) is needed to ensure reliable testing 2. The requirements, including precise spatial calibration and the need to control multiple loudspeakers simultaneously, can render the setup technically demanding. In addition, sound localization procedures have traditionally relied on substantial examiner involvement across multiple stages of testing, including stimulus delivery, response monitoring, and result recording3,4. Although varying degrees of automation have been introduced in more recent studies, examiner oversight or manual intervention is typically still required from test initiation to completion5,6. As a result, localization outcomes can be influenced by examiner-dependent factors and site-specific implementation, leading to variability in test execution and limiting standardization across institutions. These challenges are further exacerbated in pediatric populations, where maintaining attention and compliance over extended testing sessions can be particularly difficult5. Collectively, these factors introduce variability across examiners and sites, complicating cross-study comparisons and limiting standardization of sound localization protocols1,7.
To address these challenges, an automated and standardized system that enables efficient, examiner-independent sound localization testing is needed. Such a system would not only streamline the testing procedure but also enhance reproducibility across clinical and research environments. Furthermore, beyond quantifying angular error or bias, translating localization performance into functional categories can support more clinically meaningful interpretations.
In this work, we present an integrated approach for an automated sound localization testing system and demonstrate its application using the International Classification of Functioning, Disability and Health (ICF) classification scale 1. This approach addresses the practical limitations of traditional methods while providing a standardized, function-oriented framework for evaluating localization ability in individuals with hearing loss. The proposed system is intended for use in controlled clinical and research settings where standardized assessment of horizontal sound localization is required. The current protocol focuses on azimuthal localization under fixed head-position conditions and does not address vertical localization or dynamic listening scenarios involving head movement. These constraints are inherent to the goal of minimizing extraneous cues and ensuring reproducible assessment across examiners and test sessions.
Access restricted. Please log in or start a trial to view this content.
Protocol
The study protocol was reviewed and approved by the Institutional Review Board of Hallym University Sacred Heart Hospital (approval number: HALLYM 2023-07-015-001). All participants provided written informed consent before participation.
1. Instruments
NOTE: During testing, the background noise level inside the booth was maintained below approximately 35 dBA, ensuring that external noise did not interfere with sound localization performance.
A soundproof booth (internal dimensions of approximately 3,800 × 2,200 × 2,100 mm) provided a controlled free-field listening environment with minimal ambient noise. A semicircular loudspeaker rack with a radius of 3,000 mm was installed inside the booth. Seven loudspeakers were mounted at 30° intervals spanning from −90° to +90° azimuth, and all loudspeakers were positioned at the same height (head level when seated; approximately 1,050 mm) and at an equal distance from the participant's head (Figure 1). The loudspeakers were connected to a multichannel audio interface using balanced, shielded XLR audio cables.
NOTE: When connecting multiple loudspeakers to a personal computer located outside the soundproof booth, a wall-mounted cable panel or feedthrough was installed on the booth wall. This facilitated stable cable routing between the interior and exterior of the booth while maintaining acoustic isolation and minimizing cable clutter.
Stimulus presentation and data acquisition were controlled using a Windows-based personal computer running custom-developed software (Figure 2; see Table of Materials). A height-adjustable chair equipped with a headrest was prepared to stabilize the participant's head position during stimulus presentation. A custom-made chair with adjustable seat height and headrest position was used to accommodate individual participant anthropometry. The headrest provided tactile feedback to help participants maintain a consistent forward-facing head orientation during stimulus presentation.
NOTE: The custom software was developed in-house to support automated sound localization testing. Once the test was initiated, the software controlled stimulus presentation and trial sequencing, collected participant responses via a touchscreen interface, and automatically computed localization performance metrics, including root mean square error (RMSE), mean absolute error (MAE), and localization bias at the completion of the test.
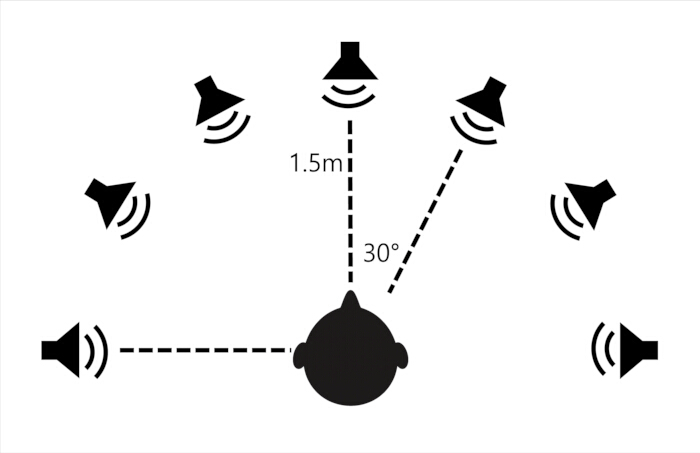
Figure 1. Loudspeaker array for the horizontal sound localization test Please click here to view a larger version of this figure.
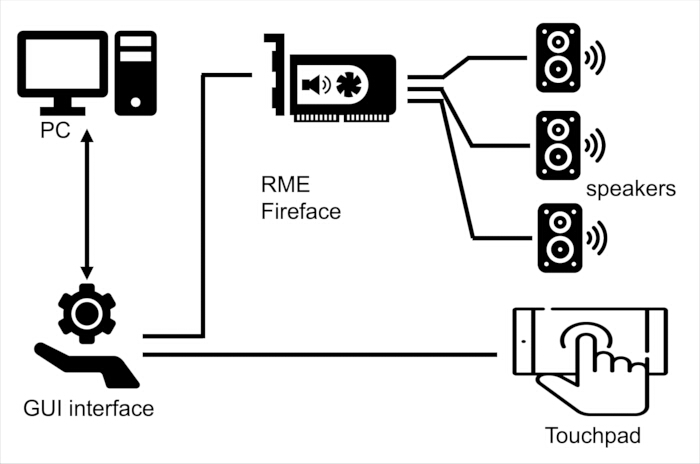
Figure 2. Schematic of the experimental system. The system comprised a personal computer connected to an audio interface, which delivered signals to a power amplifier and subsequently to the loudspeaker array. A sound level meter was used for calibration to ensure consistent output levels across all the loudspeakers. Please click here to view a larger version of this figure.
2. Setup01
Before starting the test, a calibration procedure was performed to ensure consistent sound presentation levels across all test loudspeakers. A broadband noise stimulus that was root mean square (RMS) matched to the test stimuli was presented sequentially from each loudspeaker. A Class 1 precision sound level meter equipped with a free-field microphone was placed on a tripod at head level (approximately 1,050 mm) at the participant position. The equivalent continuous sound level (LZeq; Z-weighted, time-averaged sound pressure level) from each loudspeaker was measured, and output levels were adjusted so that the measured LZeq was approximately 60 dB SPL (±0.5 dB) across all loudspeakers.
NOTE: Adjustment of loudspeaker output levels was performed at the audio interface level to ensure consistent calibration across loudspeakers. The custom software did not include level-control functions and was used solely for stimulus presentation, trial control, response collection, and computation of localization metrics.
3. Experiment
The participant was seated on the custom-made chair so that the head was aligned with the frontal loudspeaker (0° azimuth, the central position of the semicircular array) and was positioned at the center of the semicircular loudspeaker array. The headrest was adjusted to fit firmly against the occipital protuberance, and the participant was instructed to maintain contact with the headrest throughout the test. A touchpad was placed directly in front of the participant to record responses, and instructions on its use were provided.
NOTE: Improper positioning at the beginning of the test may affect the effective loudspeaker angles and compromise measurement accuracy. The headrest provided tactile feedback, enabling participants to monitor whether the head remains correctly positioned. The response device must not act as a visual or audio barrier and the touchpad should not obstruct the direct line of sight between the participant and the central loudspeaker.
The participant identification code and trial number were entered, and the hearing-device status (cochlear implant, hearing aid, or no hearing aid) was selected using the graphical user interface (GUI). The familiarization sequence was started. On the GUI, the Familiarization button was selected to initiate the familiarization sequence. The participant was instructed to maintain gaze toward the central loudspeaker throughout the sequence. During the familiarization sequence, the system automatically presented auditory stimuli sequentially from each loudspeaker.
NOTE: The participant was instructed to keep the head directed forward and avoided turning toward the sound source during this step. The sound localization test employed broadband noise stimuli (20-20,000 Hz) generated in two spectral shapes and were presented at three intensity levels (55, 60, and 65 dB HL). All stimuli had a duration of 500 ms with 5 ms onset and offset ramps, consistent with established localization protocols1,2. In total, six unique stimuli were presented once from each of the seven loudspeakers in randomized order, resulting in 42 trials per participant.
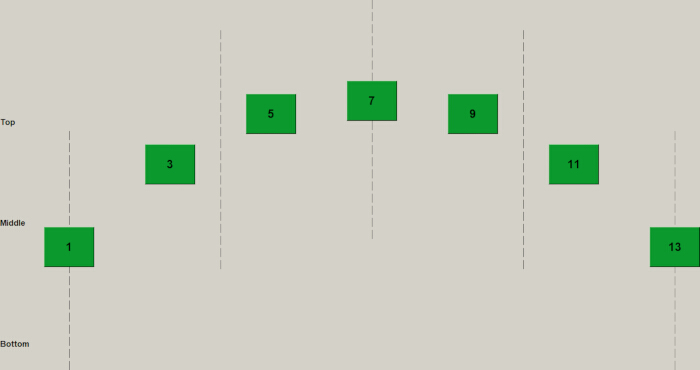
Figure 3. Speaker-map interface used for participant responses. Please click here to view a larger version of this figure.
On the GUI, the Pre-test button was selected to activate the pre-test mode. The participant was instructed to face the frontal loudspeaker and to press the Start button on the touchpad when ready, while maintaining a forward head orientation. Upon pressing the Start button, the system presented the first test sound from one of the loudspeakers. After the sound presentation, the touchpad display switched to a loudspeaker map, on which the participant selected the perceived sound-source location (Figure 3).
After each response, the system provided immediate feedback. For correct responses, a confirmation message was displayed before progression to the next trial was allowed. For incorrect responses, the correct loudspeaker location was highlighted on the map, and the sound was replayed three times from that loudspeaker. The pre-test consisted of three trials and was automatically terminated by the system upon completion of the third trial.
NOTE: The participant was monitored to ensure that the head remained directed toward the frontal loudspeaker during the feedback sequence, as turning the head interfered with accurate perception of spatial cues. Because individual trials could not be repeated within the automated sequence, any instance in which the participant clearly failed to maintain the required forward head position triggered a session restart rather than trial-level repetition. These restarted sessions were not included in the final analysis. The number of pre-test trials was predefined in the system (limited to three trials) and could not be modified by the examiner8,9.
After completion of the pre-test, the main test button was clicked to start the main test sequence. The participant pressed the Start button on the touchpad to trigger the presentation of a sound from one of the loudspeakers. After the sound presentation, the touchpad display switched to a loudspeaker map, on which the participant selected the perceived sound location. Following each response, the system displayed the Next button. The participant was allowed to take additional time before pressing the Next button to rest and verify proper head orientation prior to initiating the subsequent trial. The system automatically advanced through the predefined number of trials, repeated the trial sequence, and continued until the main test was completed.
NOTE: It was emphasized that the head remained directed toward the frontal loudspeaker throughout the test. This position ensured a consistent perception of spatial cues and prevented bias due to unintended head movements. After the stimulus ended, participants were allowed to turn their heads to identify and select the perceived loudspeaker visually. Before the next trial began, however, they returned to the initial frontal position to ensure that all subsequent stimuli were perceived under the same standardized condition. Although the system did not include integrated head-tracking, the examiner visually monitored head orientation throughout the test to ensure that participants maintained the required forward position before each stimulus.
At the end of the test, the system automatically terminated the session and generated a log file. The log contained records of each trial, including the stimulus presented, the direction of the sound source, and the participant's response. On the basis of these responses, the system calculated the RMSE, MAE, and response bias, which were saved together with the trial log for subsequent analysis.
NOTE: The log file was properly stored after the session, as it contained both the raw response data and the calculated performance metrics required for further analysis.
4. Data Processing and Analysis
After completion of the sound localization test, the system automatically calculated the RMSE, MAE, and response bias for each participant based on the recorded trial responses. For visualization and figure preparation, the exported data were subsequently processed using custom-developed scripts.
To facilitate a clinically meaningful interpretation of sound localization performance, localization error metrics were additionally categorized using an International Classification of Functioning, Disability and Health (ICF)-based framework. This approach was adopted based on a previously proposed consensus classification system for horizontal sound localization, which mapped quantitative localization errors onto graded levels of functional impairment1. In this framework, localization performance was classified into five categories-no, mild, moderate, severe, and complete impairment-based on the distribution of localization error in a normal-hearing (NH) reference group and the chance level associated with the specific test setup. Importantly, this classification did not replace conventional error metrics (e.g., RMSE or MAE) but served as an interpretive layer that translated numerical performance measures into functionally relevant categories. The ICF-based classification was applied post hoc to the localization results obtained in the present study to support standardized interpretation and to facilitate comparison across participants and listener groups.
Access restricted. Please log in or start a trial to view this content.
Results
A total of 34 participants were enrolled in this study, with 20 adults with normal hearing (NH) and 14 adults with single-sided deafness (SSD), defined as having severe-to-profound hearing loss in the impaired ear (> 70 dB HL) and a contralateral ear with a pure tone average ≤30 dB HL up to 4,000 Hz, following a definition of SSD established via international consensus2,10. The NH group comprised 12 males and 8 females, with a mean age of 28.85 ± 5.88 years an...
Access restricted. Please log in or start a trial to view this content.
Discussion
To place the performance of the proposed localization system in context, the localization errors observed in the present study were examined in relation to values reported in previous free-field localization studies. Although direct quantitative comparisons across studies are inherently limited by differences in experimental configurations, stimulus parameters, and response methods, prior work has reported that horizontal sound-localization performance in NH listeners under broadband noise conditions falls within a compa...
Access restricted. Please log in or start a trial to view this content.
Disclosures
The authors declare that they have no conflicts of interest.
Acknowledgements
This research was supported by the Basic Science Research Program through the National Research Foundation of Korea (NRF) (NRF-RS-2023-00244421, NRF-RS-2023-00243712, and NRF-RS-2022-NR069203); the Ministry of Health & Welfare, Republic of Korea (RS-2025-02215795 and RS-2024-KH145084); and the Hallym University Research Fund.
Access restricted. Please log in or start a trial to view this content.
Materials
| Name | Company | Catalog Number | Comments |
|---|---|---|---|
| Custom sound localization testing software | In-house developed | N/A | Custom-developed software (Python-based, version 3.14.2) used for automated stimulus presentation, trial sequencing, touchscreen-based response collection, and automatic computation of RMSE, MAE, and localization bias. |
| R software | R Foundation for Statistical Computing | N/A | Statistical computing environment used for post hoc data visualization and figure generation (version 4.4.2) |
| RME Fireface UFX+ audio interface | RME | Fireface UFX+ | Multi-channel ASIO Compatible soundcard used for stimulus playback and level calibration. Output levels of individual loudspeakers were adjusted at the interface level. |
| Genelec 8010A Loudspeakers | Genelec | 8010A | Full-range loudspeakers used for free-field sound localization testing. All loudspeakers were identical models to ensure consistent acoustic output across azimuthal positions. |
| Custom semicircular speaeker rack | In-house fabrication | N/A | Radius 3000 mm, height 1050 mm, designed to mount 7 loudspeakers at equal angular spacing (30°) |
| Height-adjustable chair | In-house fabrication | N/A | Custom-made height-adjustable chair with adjustable headrest used to provide tactile feedback for maintaining a stable head position during testing. |
| Windows-based personal computer | ASUS | PN64 | Mini PC (Intel Core i5-13500H) used for stimulus presentation, trial control, and data acquisition |
| Balanced Audio cable | Mogami | W2594 | Low-capacitance balanced audio cable, used for connecting speakers to the audio interface |
| Sound level meter | Brüel & Kjær | Type 2250 | Used for calibration of loudspeaker output; Class 1 precision instrument (IEC 61672-1) |
| Free-field microphone | Brüel & Kjær | Type 4189 | ½-inch prepolarized free-field microphone, compatible with Type 2250, used for accurate SPL measurement. |
| Touch screen monitor | Jooyon | Carry view B | Touch screen monitor for participant response collection. |
| Sound proof room | Sontek (custom-made, Korea) | N/A | External: 4050 × 2450 × 2575 mm (W × D × H); Internal: 3800 × 2200 × 2100 mm, designed to provide a noise-isolated environment for free-field testing |
References
- Mertens, G., et al. Towards a consensus on an ICF-based classification system for horizontal sound-source localization. Journal of Personalized Medicine. 12 (12), 1971(2022).
- Van de Heyning, P., et al. Towards a unified testing framework for single-sided deafness studies: A consensus paper. Audiology and Neurotology. 21 (6), 391-398 (2017).
- Carlile, S., Leong, P., Hyams, S. The nature and distribution of errors in sound localization by human listeners. Hearing Research. 114 (1-2), 179-196 (1997).
- Brimijoin, W. O., McShefferty, D., Akeroyd, M. A. Undirected head movements of listeners with asymmetrical hearing impairment during a speech-in-noise task. Hearing Research. 283 (1-2), 162-168 (2012).
- Zhang, X., et al. Sound source localization testing in single-sided deafness following bone conduction intervention. Journal of Visualized Experiments. (214), e67300(2024).
- Kim, J. H., Shim, L., Bahng, J., Lee, H. -J. Proficiency in using level cue for sound localization is related to the auditory cortical structure in patients with single-sided deafness. Frontiers in Neuroscience. 15, 749824(2021).
- Häusler, R., Colburn, S., Marr, E. Sound localization in subjects with impaired hearing: Spatial-discrimination and interaural-discrimination tests. Acta Oto-Laryngologica. 96 (Suppl. 400), 1-62 (1983).
- Witte, C., Grube, M., von Cramon, D. Y., Rübsamen, R. Auditory extinction and spatiotemporal order judgment in patients with left- and right-hemisphere lesions. Neuropsychologia. 50 (5), 892-903 (2012).
- Ludwig, A. A., et al. Sound localization in single-sided deaf participants provided with a cochlear implant. Frontiers in Psychology. 12, 753339(2021).
- Vincent, C., et al. Identification and evaluation of cochlear implant candidates with asymmetrical hearing loss. Audiology and Neurotology. 20 (Suppl. 1), 87-89 (2015).
- Yost, W. A., Loiselle, L., Dorman, M., Burns, J., Brown, C. A. Sound source localization of filtered noises by listeners with normal hearing: A statistical analysis. The Journal of the Acoustical Society of America. 133 (5), 2876-2882 (2013).
- Freigang, C., Richter, N., Rübsamen, R., Ludwig, A. A. Age-related changes in sound localisation ability. Cell and Tissue Research. 361 (1), 371-386 (2015).
- Agterberg, M. J., et al. Sound-localization performance of patients with single-sided deafness is not improved when listening with a bone-conduction device. Hearing Research. 372, 62-68 (2019).
- Dobreva, M. S., O'Neill, W. E., Paige, G. D. Influence of aging on human sound localization. Journal of Neurophysiology. 105 (5), 2471-2486 (2011).
- Song, H., Kyong, J. -S., Lee, J. H. Horizontal sound localization and spatial short-term memory span in hearing-impaired listeners and listeners with simulated hearing loss. Journal of Audiology and Otology. 28 (3), 203(2024).
- Alzaher, M., Strelnikov, K., Marx, M., Barone, P. Brain plasticity and auditory spatial adaptation in patients with unilateral hearing loss. Cerebral Cortex. 33 (11), 7221-7236 (2023).
- Zeitler, D. M., et al. Sound source localization and speech understanding in complex listening environments by single-sided deaf listeners after cochlear implantation. Otology and Neurotology. 36 (9), 1467-1471 (2015).
- Middlebrooks, J. C., Green, D. M. Sound localization by human listeners. Annual Review of Psychology. 42, 135-159 (1991).
- Wallach, H. The role of head movements and vestibular and visual cues in sound localization. Journal of Experimental Psychology. 27 (4), 339(1940).
Access restricted. Please log in or start a trial to view this content.
Reprints and Permissions
